
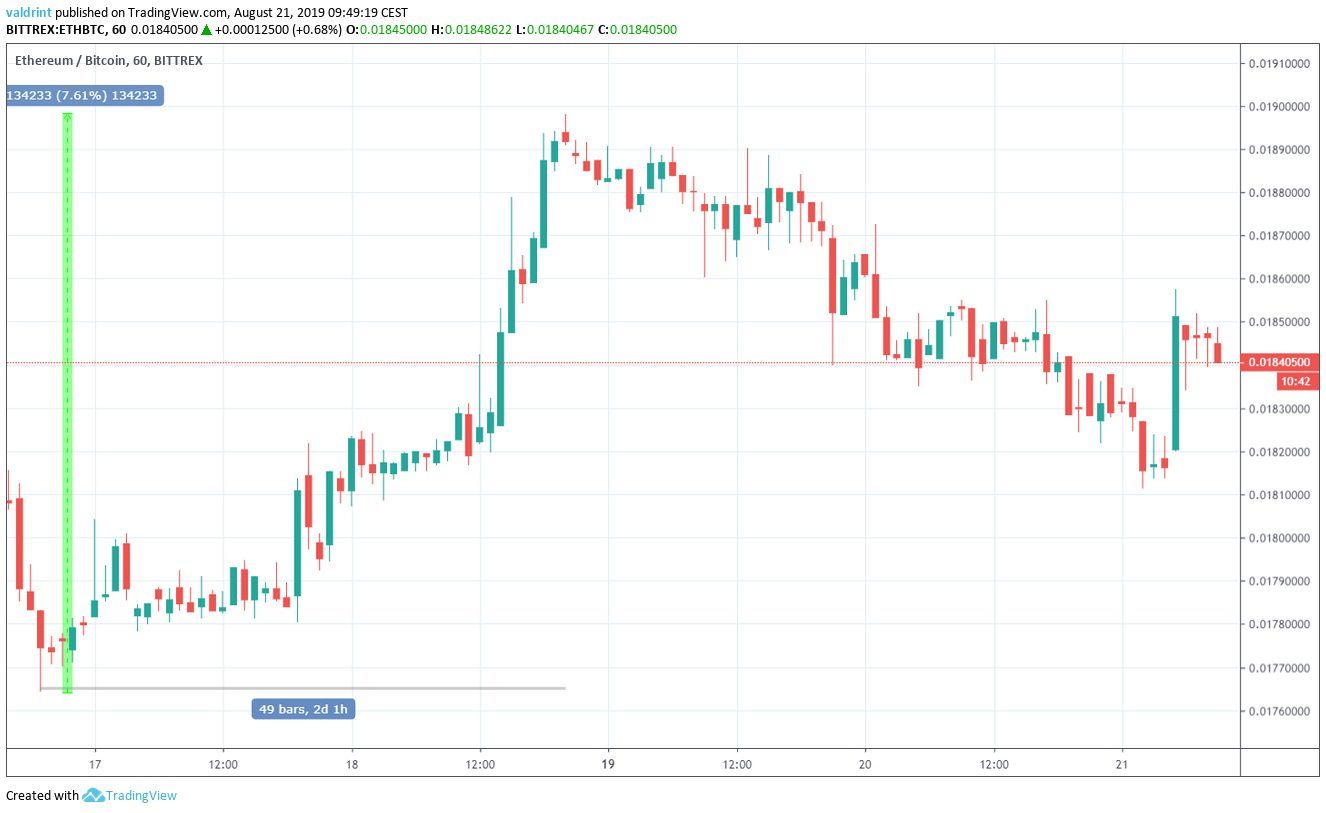
On August 16, the Ethereum price reached a low of ₿0.0176. It immediately initiated an upward move and reached a high of ₿0.0189 on August 18. This amounts to an increase of 7.5 percent in two days. The ETH price has been decreasing since.
Where will the Ethereum price go next? Continue reading if you are interested in finding out.
For our previous analysis, click here.
If you are interested in trading Ethereum (ETH) and other cryptocurrencies with a multiplier of up to 100x on our new partner exchange with the lowest fees, follow this link to get a free StormGain account!

Ethereum Price: Trends and Highlights for August 21
- ETH/BTC is following a descending resistance line.
- It is trading below the 400- and 800-hour moving averages.
- There is minor support at ₿0.0176 and major support at ₿0.015.
Descending ETH Price Resistance
A look at the two-hour time-frame shows that ETH has been following a descending resistance line since July 29.
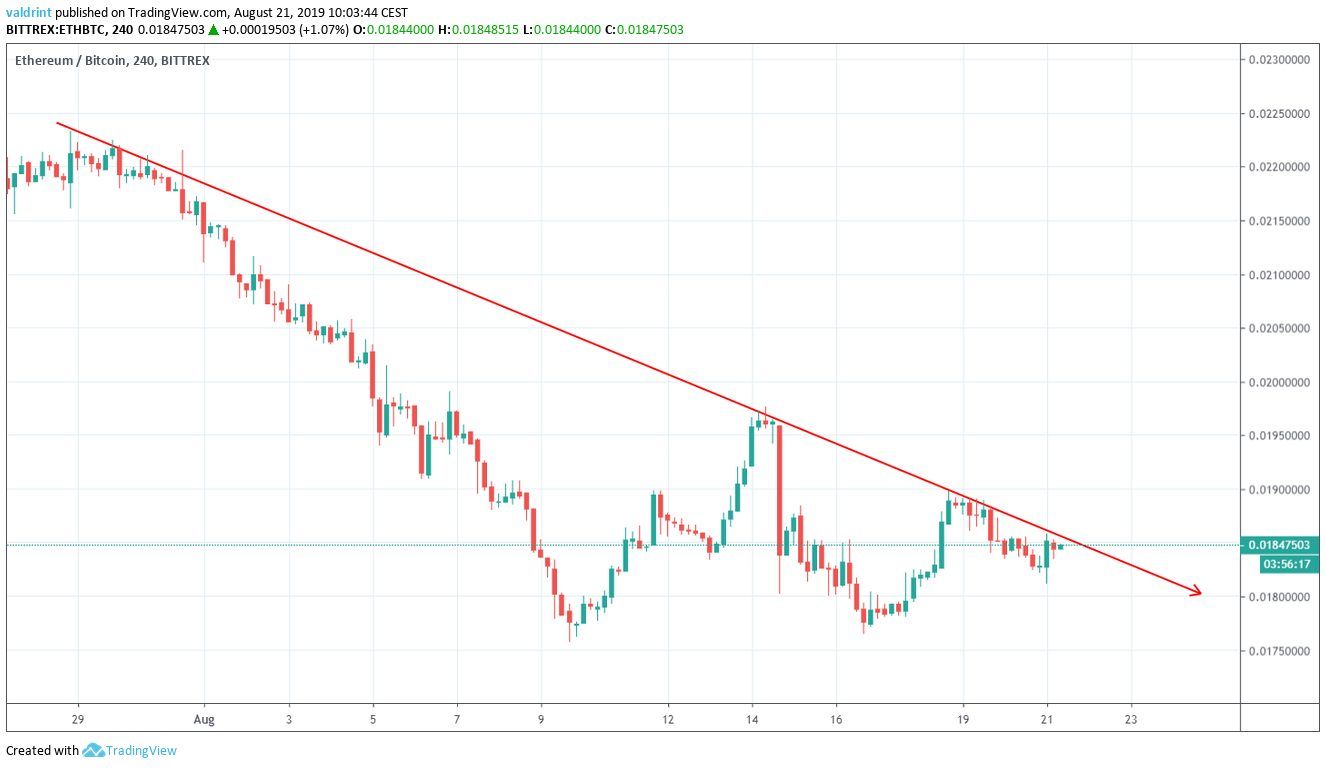
The ETH price has made continuous attempts at breaking out for the past 20 hours. However, they have all been unsuccessful.
A look at the moving averages (MA) reiterates the strong resistance that is currently above the price.
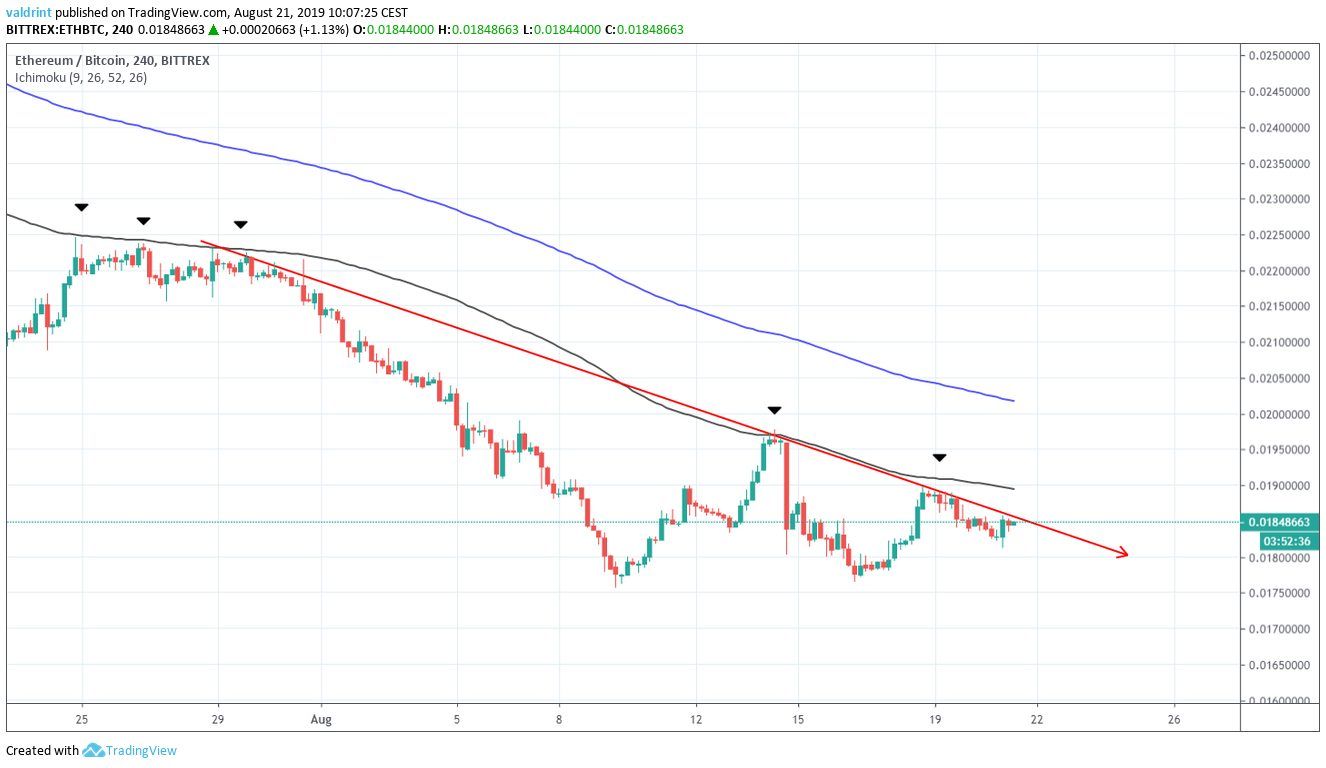
ETH is trading below both the 100- and the 200-period moving averages.
The 100-period one has served as resistance in at least five instances and it is likely to continue doing so.
The strong resistance above the price makes us believe that the Ethereum price will continue decreasing.
One support area is outlined below.
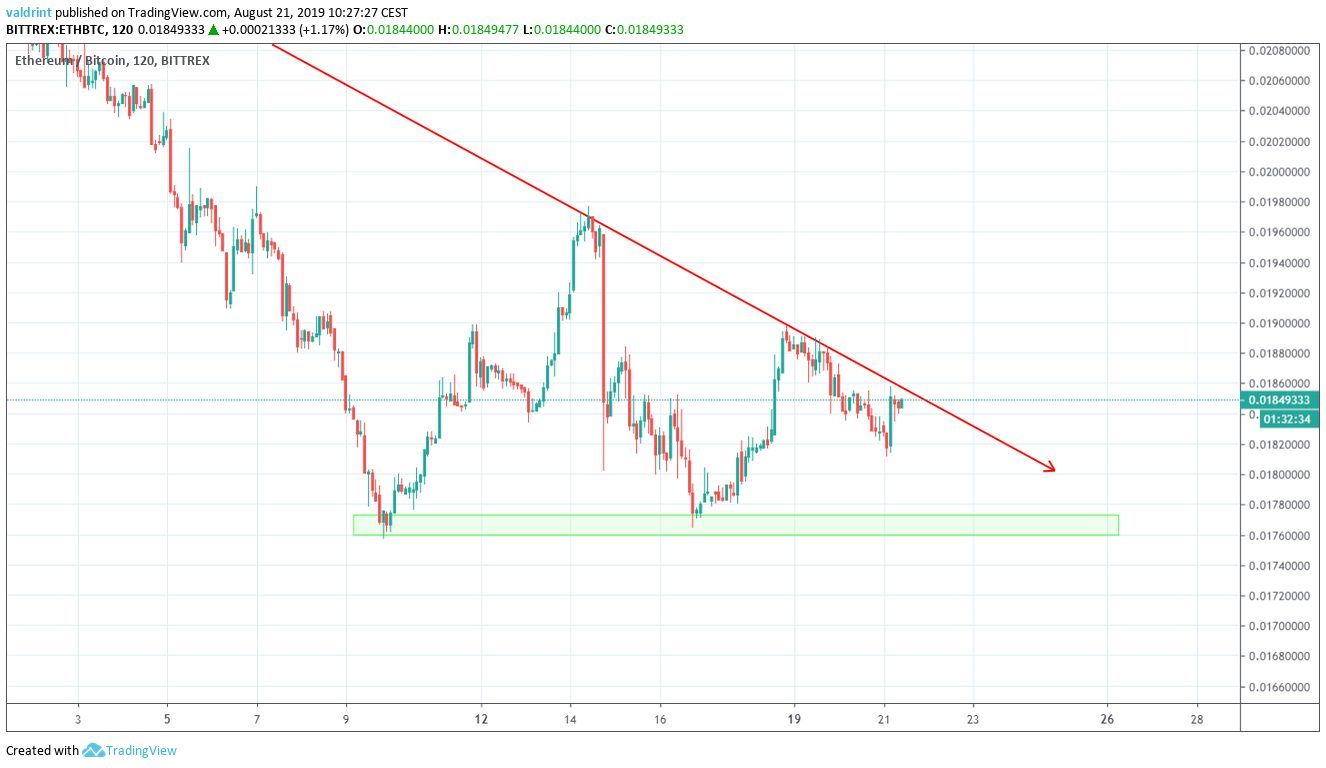
It is found at ₿0.0176.
We believe that the ETH price is likely to reach it within the next few days.
If it does, it would likely create a descending triangle, which is considered a bearish pattern.
Now that we have an outline of possible short-term movement, let’s take a look at the long-term.
Long-Term
A look at the weekly time-frame gives us one major support area.
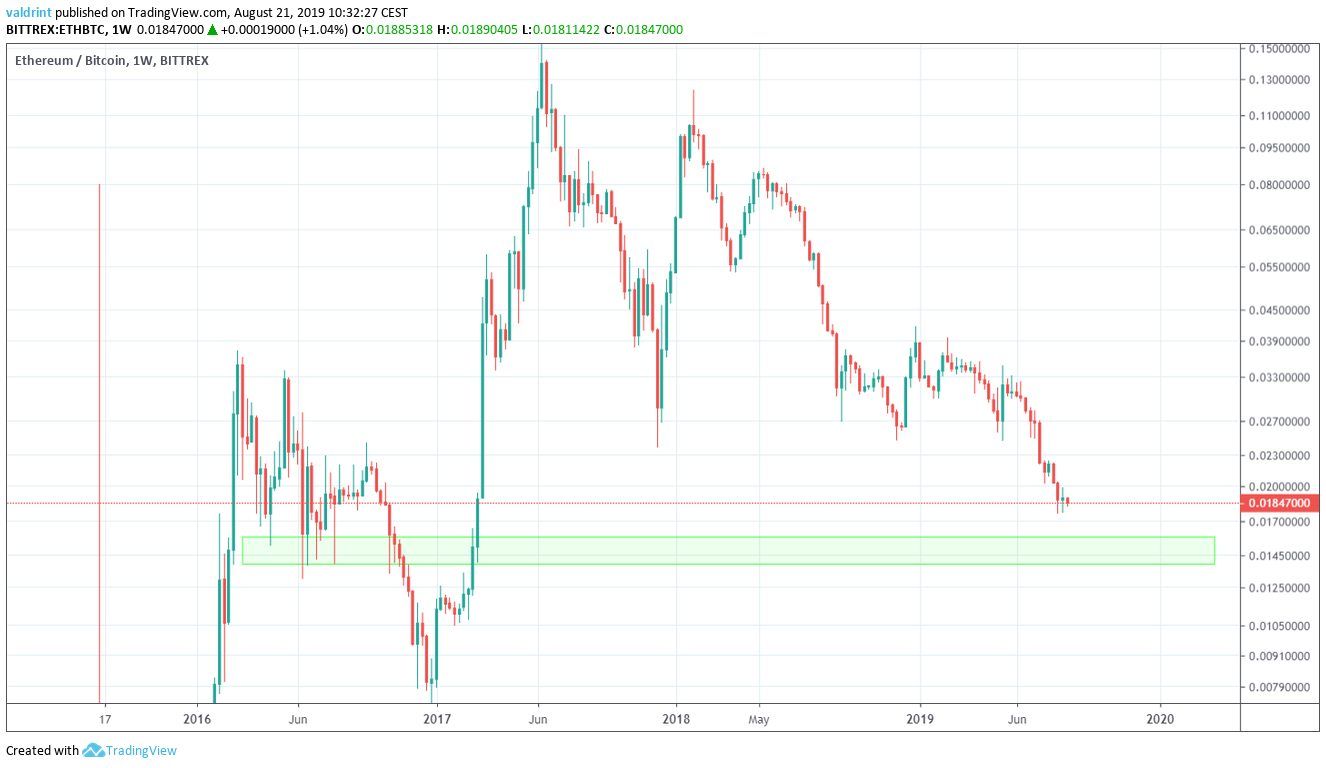
It is found between ₿0.0140-₿0.0155.
It is a very significant support area and a suitable level for the initiation of a long-term upward move.
A more accurate target is given by using a Fibonacci retracement tool in the most recent upward move.
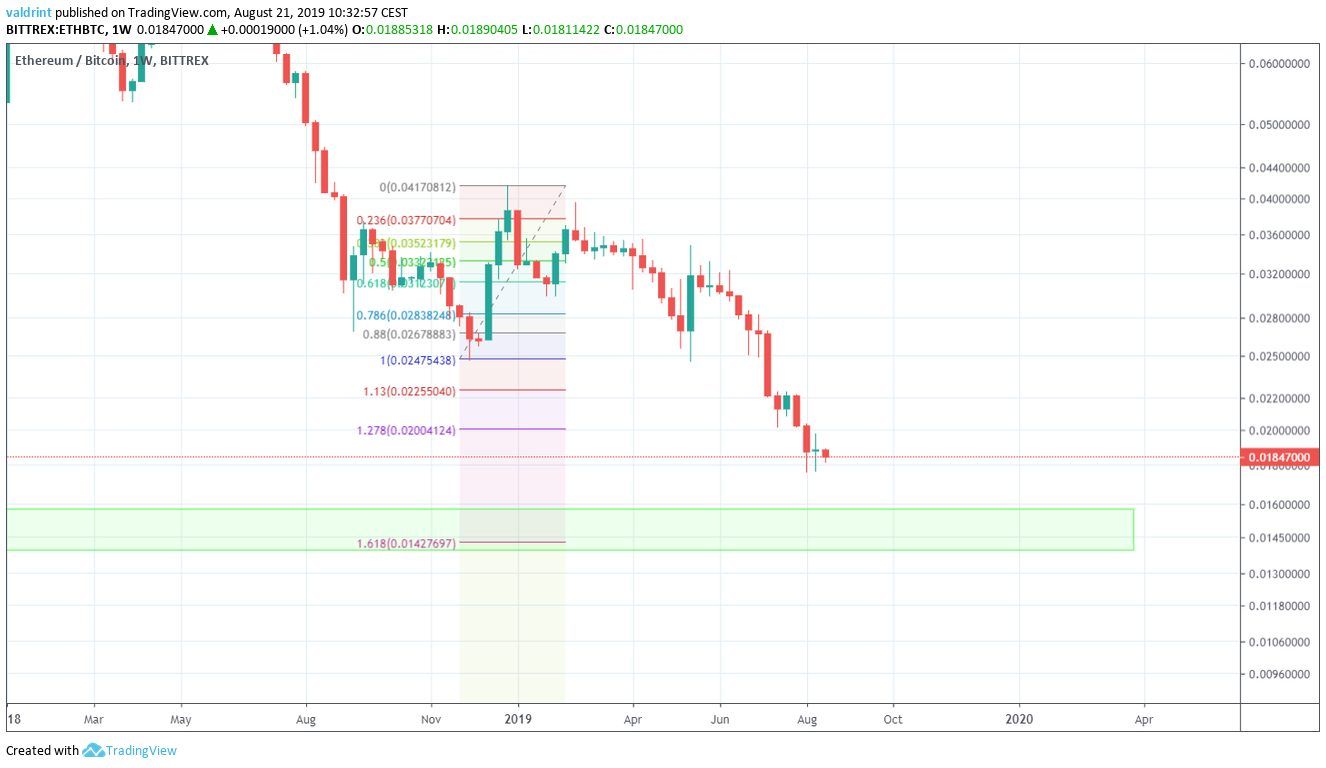
The target is found by the 1.618 fib level and is at ₿0.0142.
Unless the price shows any signs of reversal once it reaches the minor support area discussed in the previous section, we would expect the ETH price to eventually reach ₿0.0142.
Ethereum Price Summary
The Ethereum price is following a descending resistance line.
According to our analysis, it is likely to decrease at the rate predicted by the line until it reaches the support area outlined above.
Afterward, unless the price begins to show signs of reversal, a continued decrease is likely.
Do you think the ETH price will reach the support area? Let us know in the comments below.

Disclaimer: This article is not trading advice and should not be construed as such. Always consult a trained financial professional before investing in cryptocurrencies, as the market is particularly volatile.
Images are courtesy of Shutterstock, TradingView.
