
On August 9, 2019, the Ethereum price reached a low of ₿0.0176. An upward move followed, and ETH made a high of ₿0.0197 on August 14. However, the increase was short-lived, since the price made a double bottom at ₿0.0176 on August 16. It has been increasing since then.
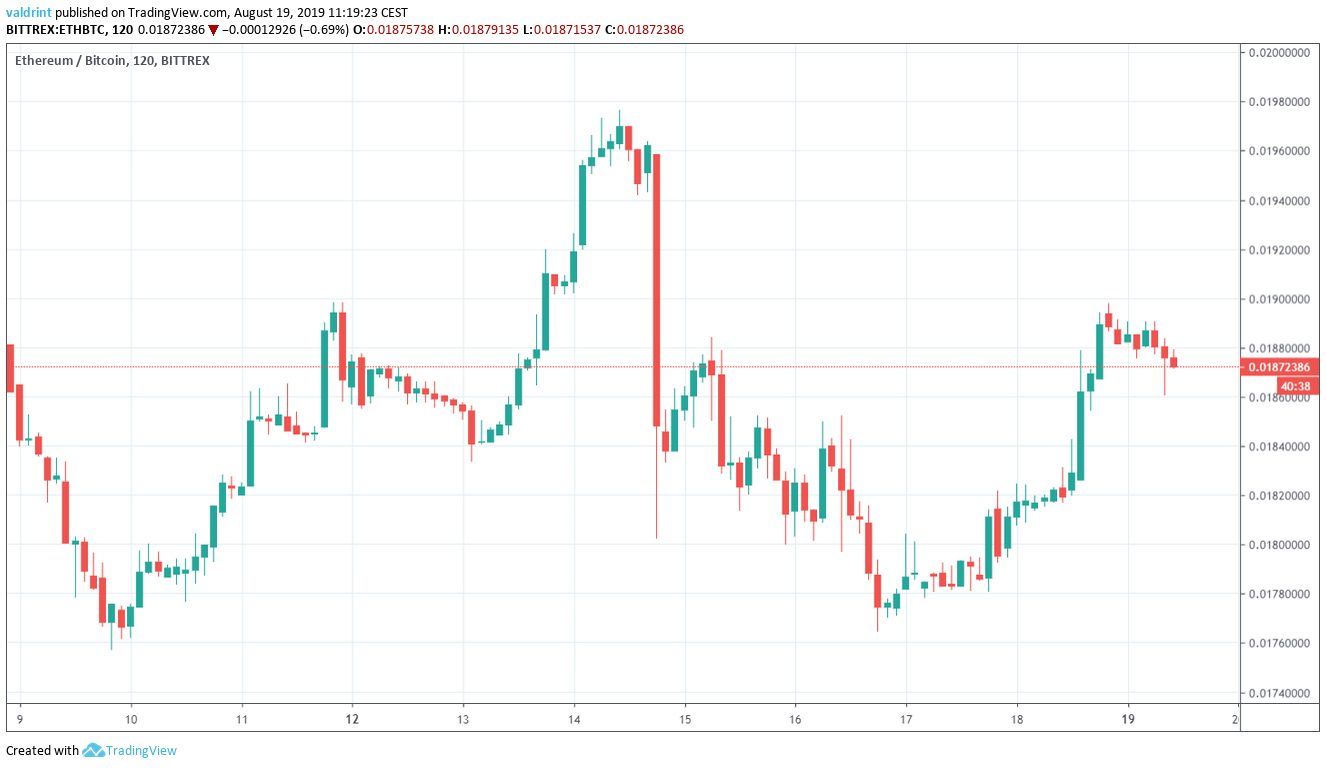
Will the Ethereum price reach ₿0.02 or do further decreases await? Continue reading if you are interested in finding out.
For our previous analysis, click here.
If you are interested in trading Ethereum (ETH) and other cryptocurrencies with a multiplier of up to 100x on our new partner exchange with the lowest fees, follow this link to get a free StormGain account!

Ethereum Price: Trends and Highlights for August 19
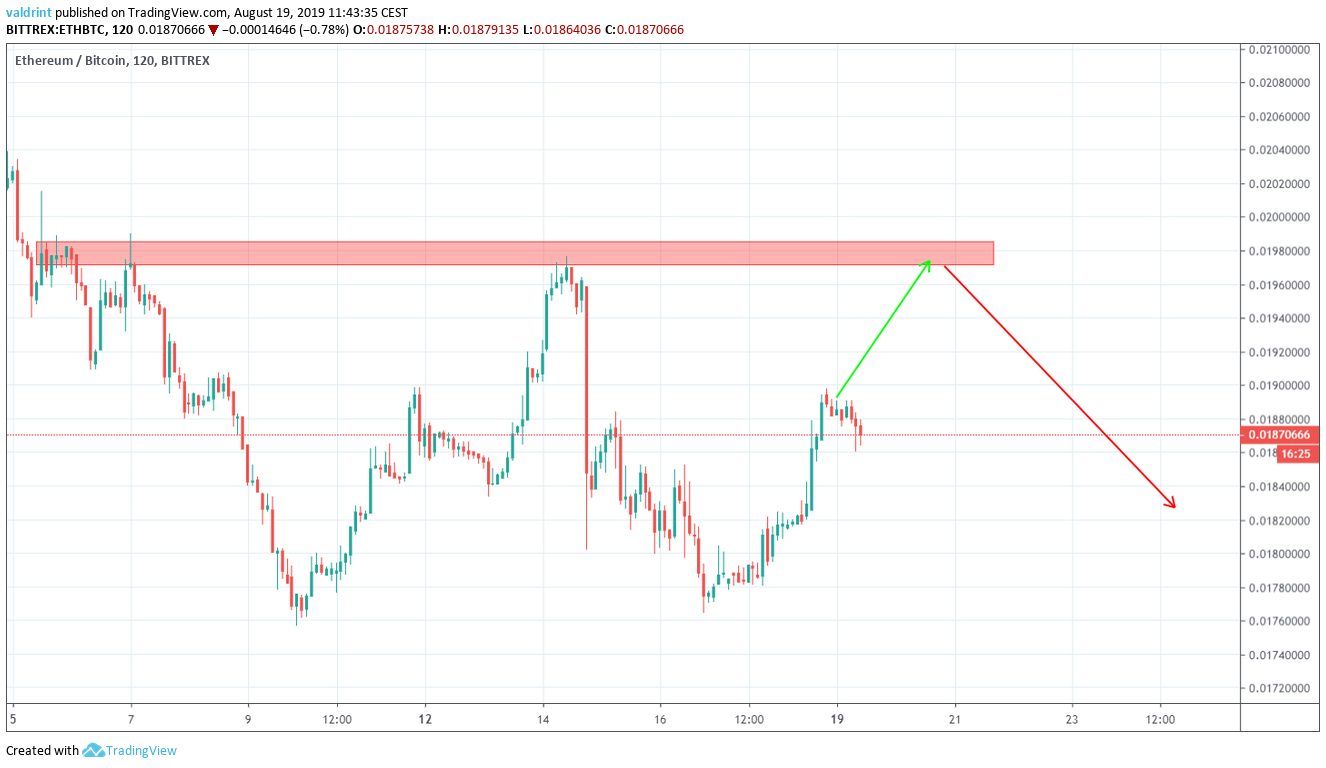
- ETH/BTC has possibly made a bullish Adam and Eve pattern.
- There is resistance at ₿0.0198.
- The bullish divergence has developed in the RSI and MACD.
- The 400-hour moving average can be considered a resistance benchmark.
ETH Price Forming Adam and Eve Pattern
A closer look at the Ethereum price reveals a possible Adam and Eve pattern.
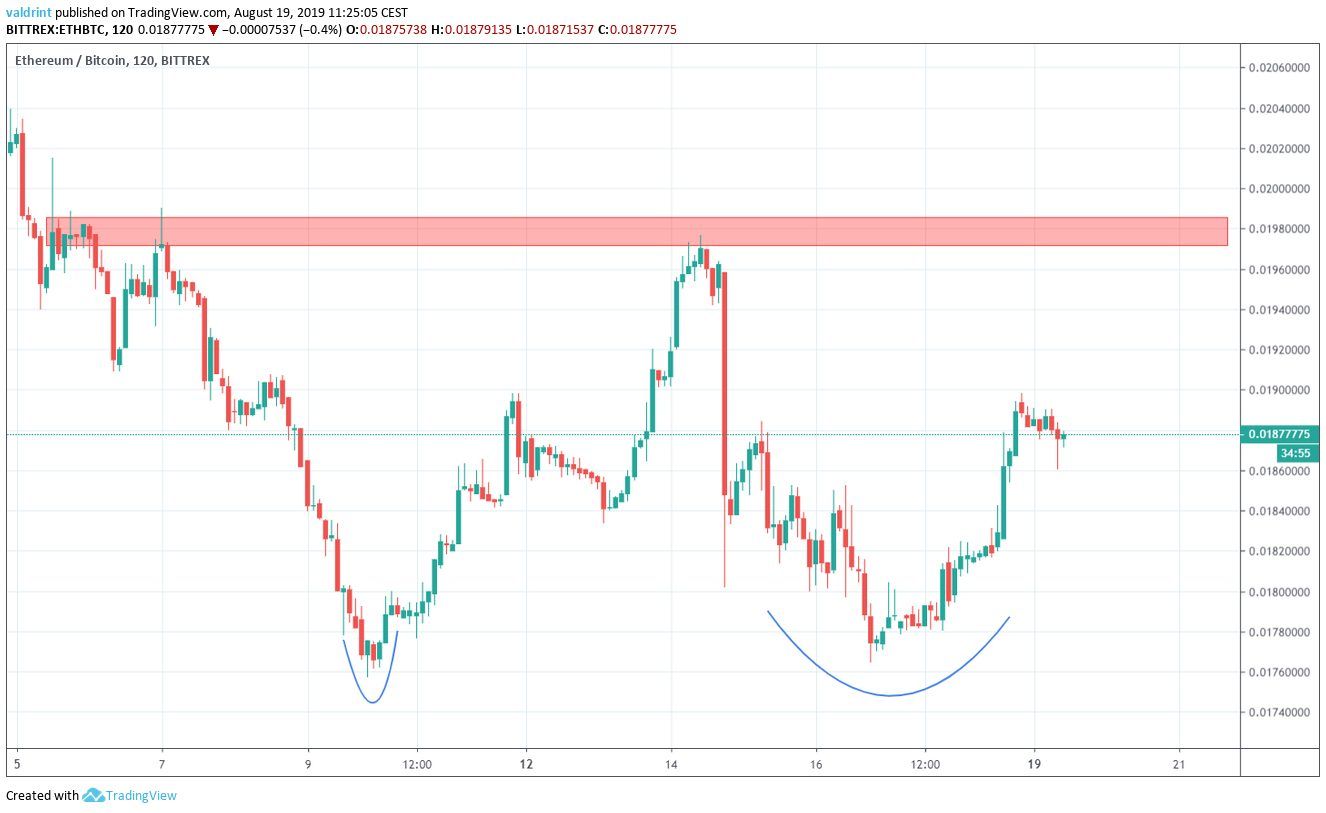
The pattern is similar to a double bottom, with the only exception being that the second bottom is smoother than the first.
Additionally, we can see a resistance area at ₿0.0198.
Technical Indicators
A look at the MACD and RSI reveals that bullish divergence has developed over the duration of this pattern.
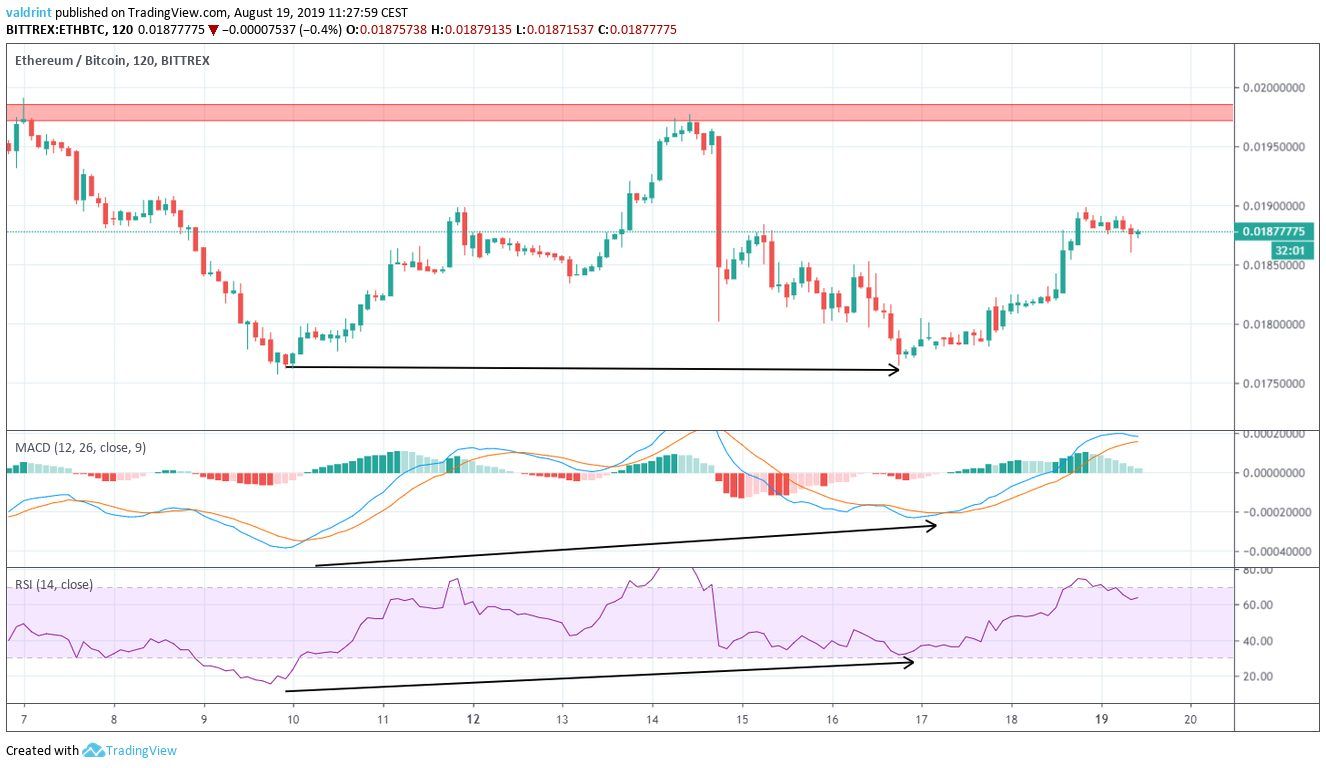
The divergence is significant and present in both indicators.
Additionally, it is visible until the daily time-frame.
This observation supports the creation of a bullish pattern and a move towards the resistance at ₿0.0198.
A look at the moving averages suggests that the Ethereum price is at a critical juncture in time.
It is trading between the 100- and 200-period moving averages (MA).
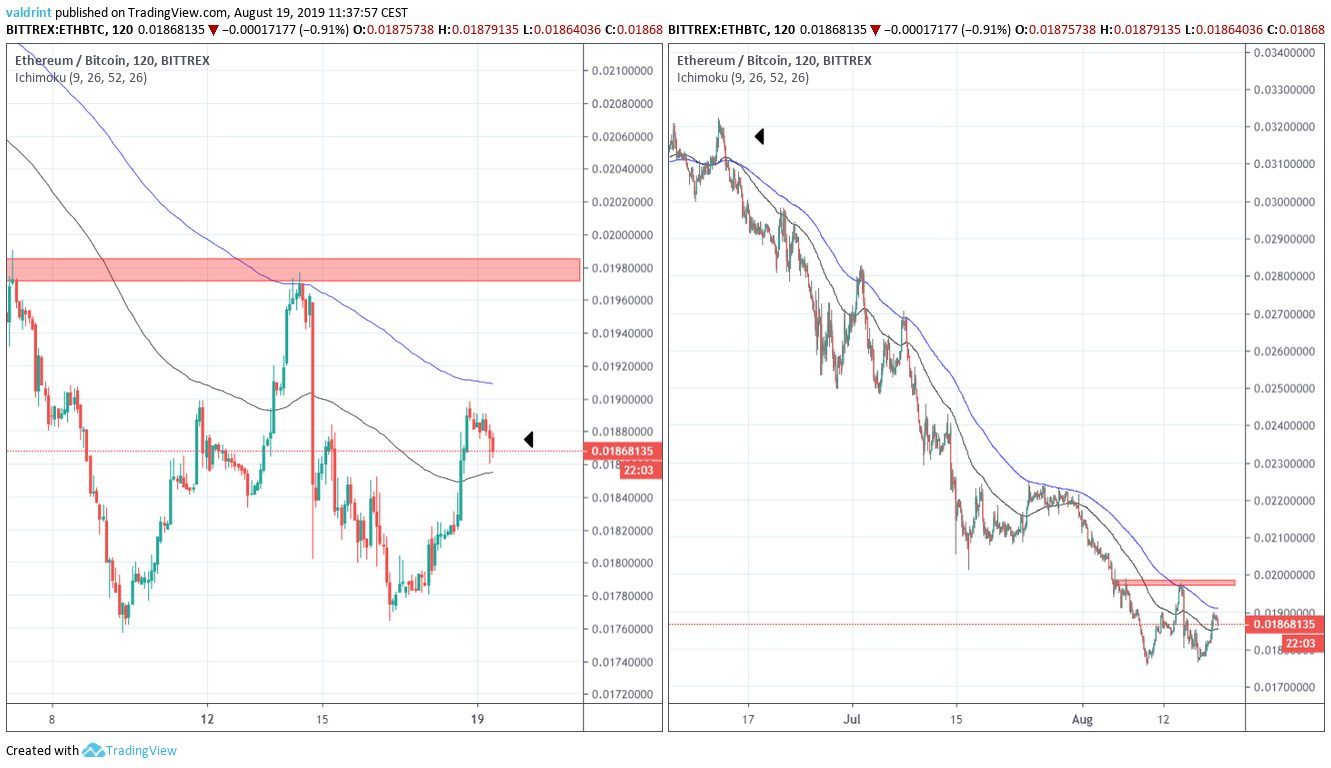
The previous upward move failed on August 14 once the ETH price reached the 200-period MA.
On the right side of the graph, we can see that the last time the price traded above the 200-period MA was in June 2019.
Therefore, the MA can be considered a very significant resistance — possibly stopping the price rally before it reaches the resistance area.
Future Movement
While the Ethereum price might continue to increase above the MA and reach the resistance area, we think the increase will be short-lived.
This view stems from the previous long-term movement and the lack of a suitable level for the initiation of a reversal.
We expect the ETH price to drop towards ₿0.018 soon.
Ethereum Price Summary
The Ethereum price has created a bullish Adam and Eve pattern.
According to our analysis, it is likely to increase towards ₿0.0198.
However, we do not believe this is the beginning of a long-term upward move.
Rather, we expect ETH to eventually make new lows below ₿0.018.
Do you think Ethereum will reach the resistance area? Let us know in the comments below.
Disclaimer: This article is not trading advice and should not be construed as such. Always consult a trained financial professional before investing in cryptocurrencies, as the market is particularly volatile.
Images are courtesy of Shutterstock, TradingView.
