
On August 9, 2019, the Ethereum price reached a low of ₿0.0175. An upward move began. The ETH price reached a high of ₿0.0197 on August 14. It has been decreasing since then.
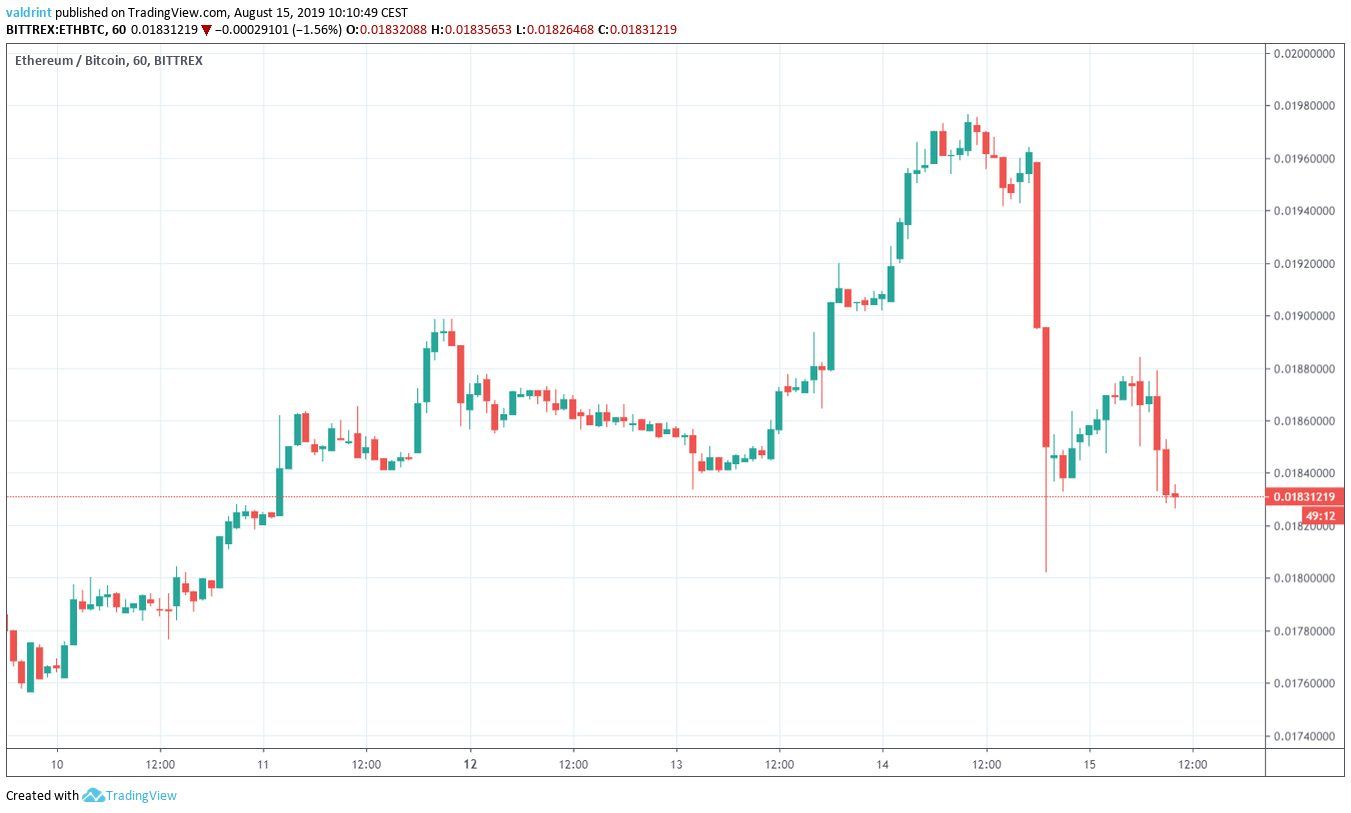
At the time of writing, the ETH price was trading near ₿0.0182.
Will Ethereum initiate a reversal or do further decreases await? Continue reading if you are interested in finding out.
For our previous analysis, click here.
If you are interested in trading Ethereum (ETH) and other cryptocurrencies with a multiplier of up to 100x on our new partner exchange with the lowest fees, follow this link to get a free StormGain account!

Ethereum Price: Trends and Highlights for August 15
- ETH/BTC is trading inside a descending channel.
- There is support at ₿0.0183.
- The hourly RSI has developed bullish divergence.
- The Ethereum price is trading below the 10- and 20-day moving averages.
- Volume has been higher on bearish candlesticks.
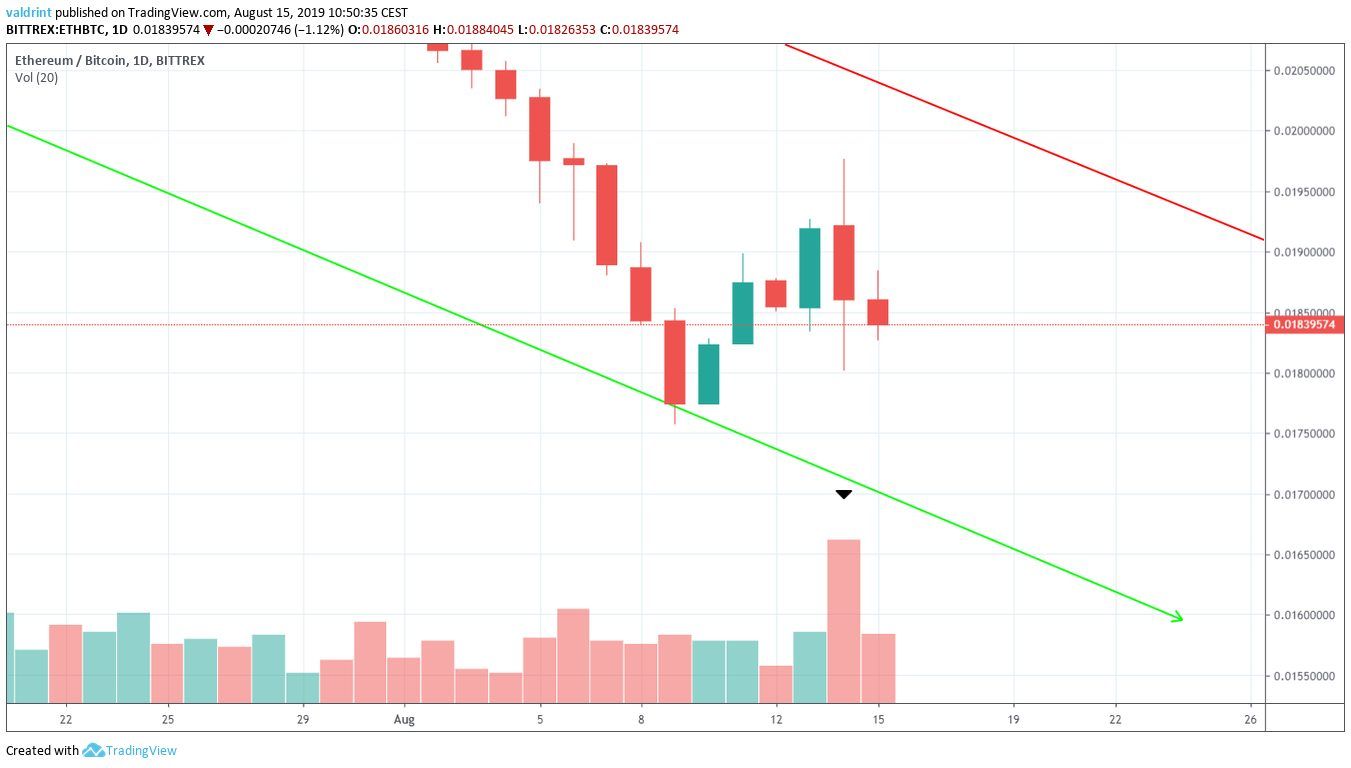
Short-Term ETH Price Support
A closer look at the hourly ETH price gives us our first minor support area.
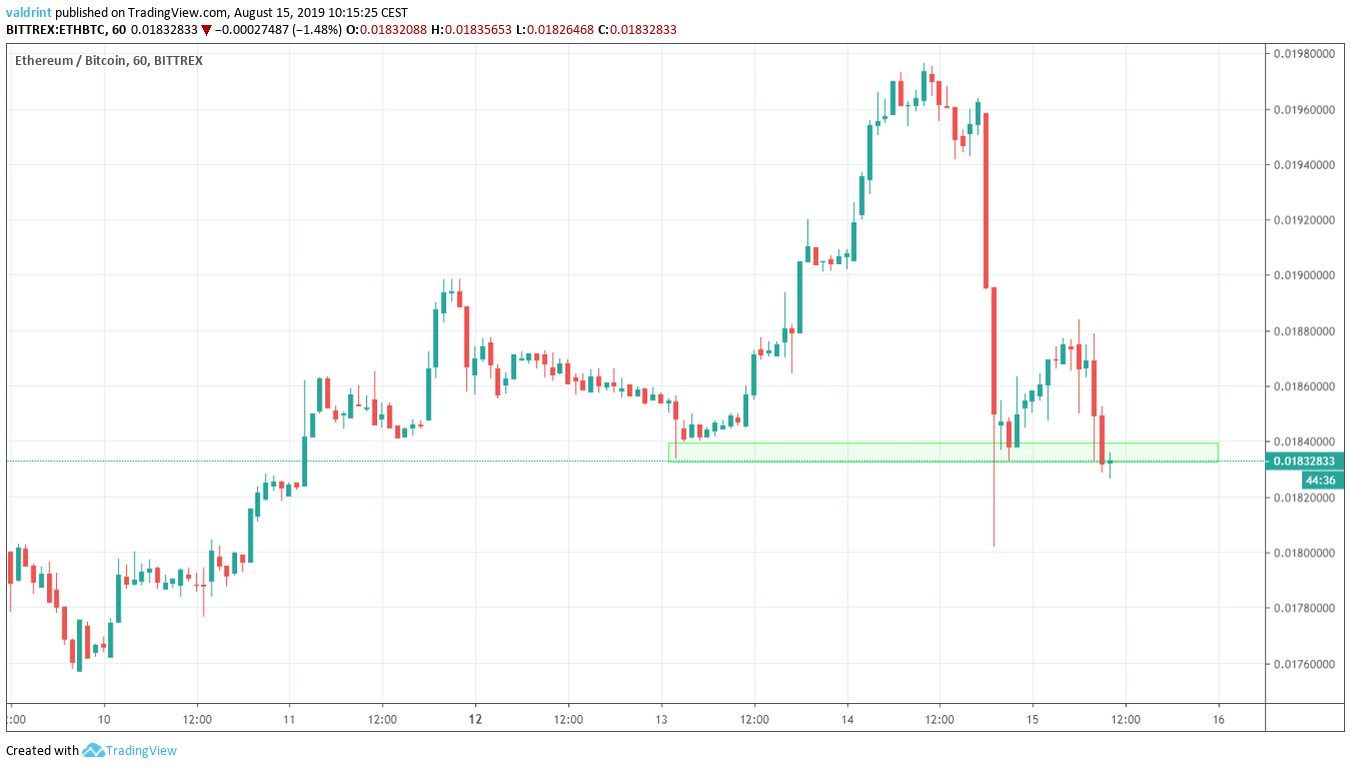
It is found at ₿0.0183, a level where the Ethereum price is currently trading.
The two previous times it reached this area, (August 14-15) it began upward moves of varying magnitudes.
This idea is supported by a look at the hourly RSI.
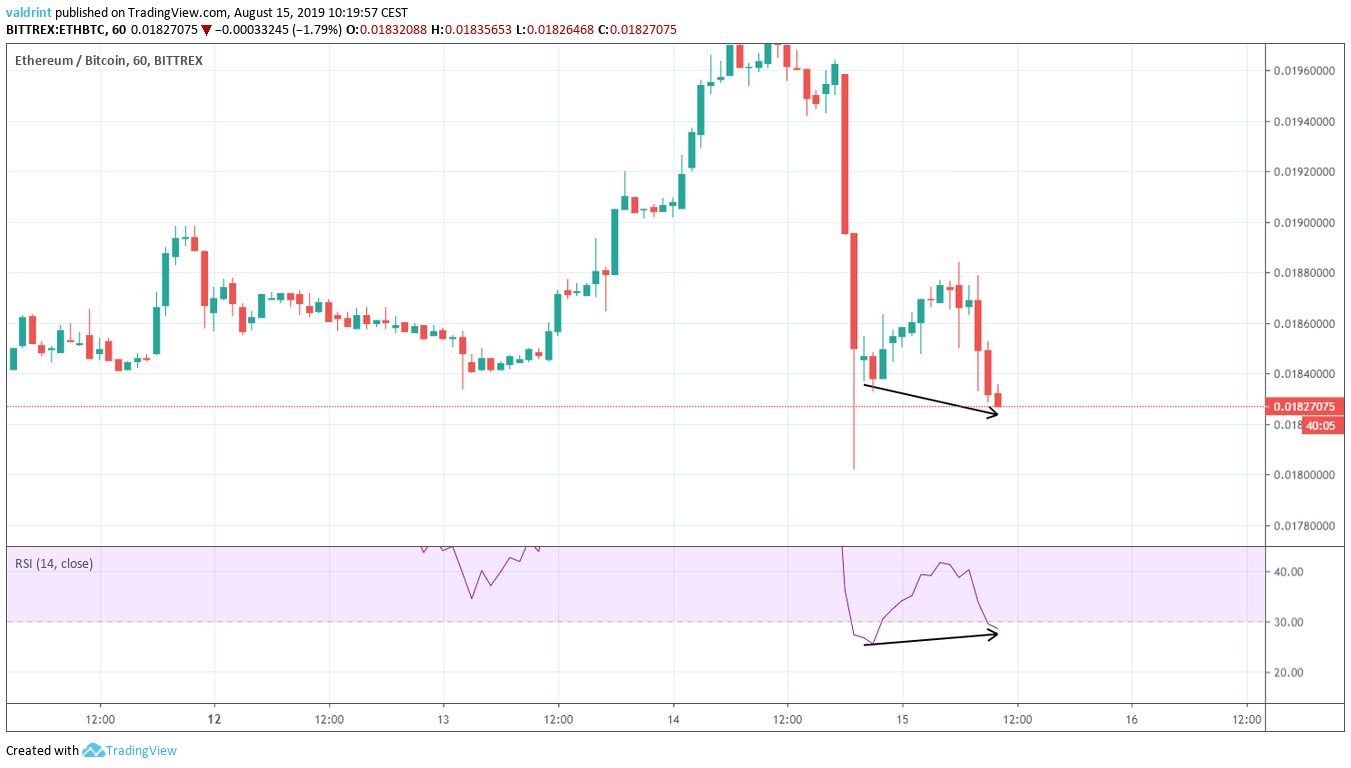
It has generated bullish divergence over the past 24 hours.
However, the divergence is not very significant and is not present in longer-term time-frames.
Therefore, any upward moves resulting from it will most likely be temporary.
Let’s take a look at the daily time-frame to see how the recent price movement fits into a larger picture.
Descending Channel
A look at the daily time-frame shows that Ethereum has been trading inside a descending channel since July 9.
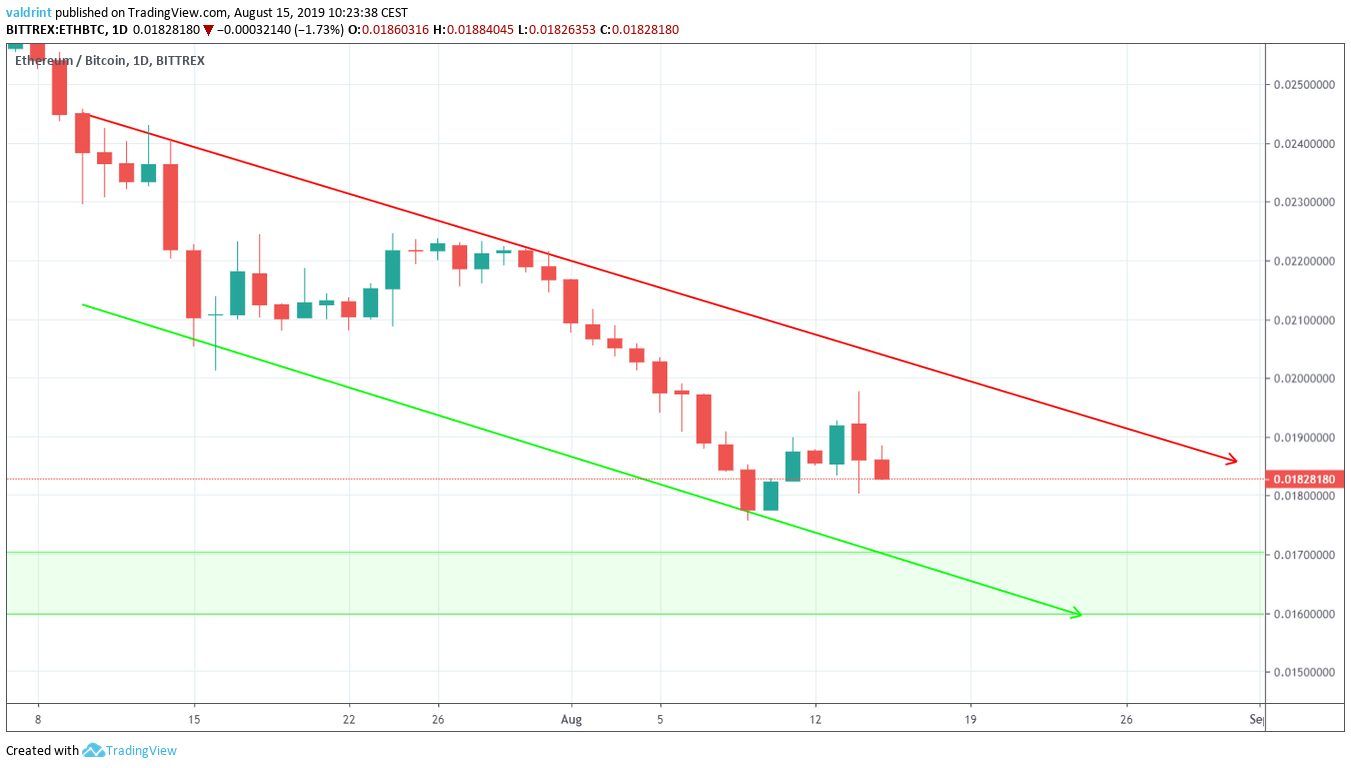
At the time of writing, it was trading in the middle of the channel.
Additionally, there is a support area between ₿0.016 and ₿0.017.
If the Ethereum price were to decrease at the rate predicted by the channel, it would reach this area and the descending support line on August 20-25.
A look at moving averages supports this possibility.
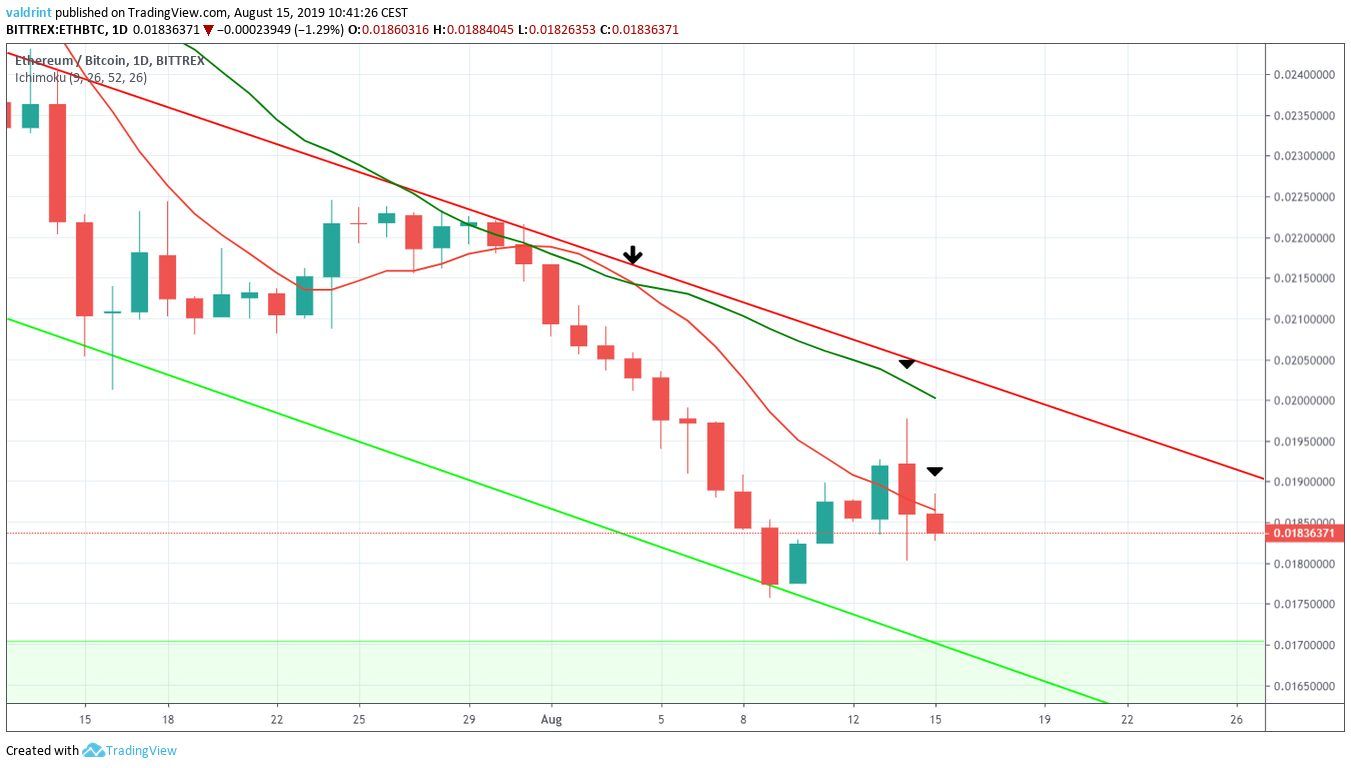
A bearish cross between the 10- and 20-day MAs occurred on August 4.
The ETH price has been trading below both since then.
Yesterday, the price reached the 20-day MA before decreasing.
It is currently facing very close resistance from the 10-day MA.
Additionally, the volume was significantly higher during the bearish candlestick on August 14.
This makes us believe that ETH will decrease until it reaches the support area at ₿0.016 – ₿0.017.
Summary
The Ethereum price has been trading inside a descending channel.
According to our analysis, it is likely to continue decreasing until it reaches the support area outlined above.
A short-term increase towards ₿0.019 could occur before the Ethereum price resumes its downward movement.
Do you think ETH will reach the support area? Let us know in the comments below.
Disclaimer: This article is not trading advice and should not be construed as such. Always consult a trained financial professional before investing in cryptocurrencies, as the market is particularly volatile.
Images are courtesy of TradingView and Shutterstock.
