
On July 15, 2019, the Ethereum price reached a high of ₿0.024. A rapid decrease ensued. The next day, it reached lows slightly above ₿0.020. It has been slowly increasing since.
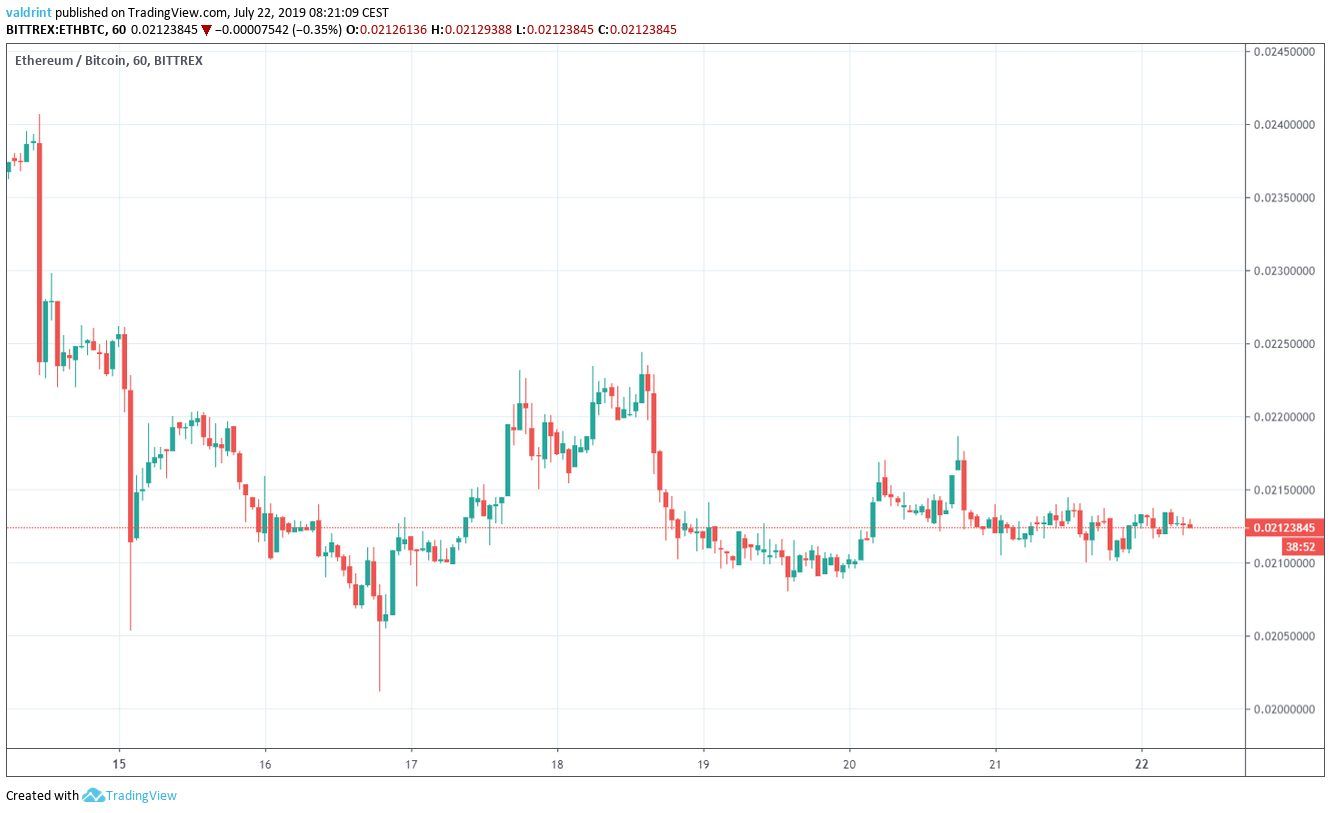
At the time of writing, it was trading near ₿0.021.
Will the Ethereum price decrease below ₿0.02, or will it continue its upward movement? Keep reading below in order to find out.
For our previous analysis, click here.
If you are interested in trading cryptocurrencies with a multiplier of up to 100x on our new partner exchange with the lowest fees, follow this link to get a free StormGain account!
Ethereum Price: Trends and Highlights for July 22
- ETH/BTC is trading inside a symmetrical triangle.
- There is support near ₿0.020.
- There is resistance near ₿0.0235.
- The ETH price trading inside a long-term descending wedge.
- There is a very significant bullish divergence developing in the RSI and the MACD.
ETH Price in a Symmetrical Triangle
Since reaching the aforementioned high on July 15, the ETH price has been trading inside the symmetrical triangle outlined below:
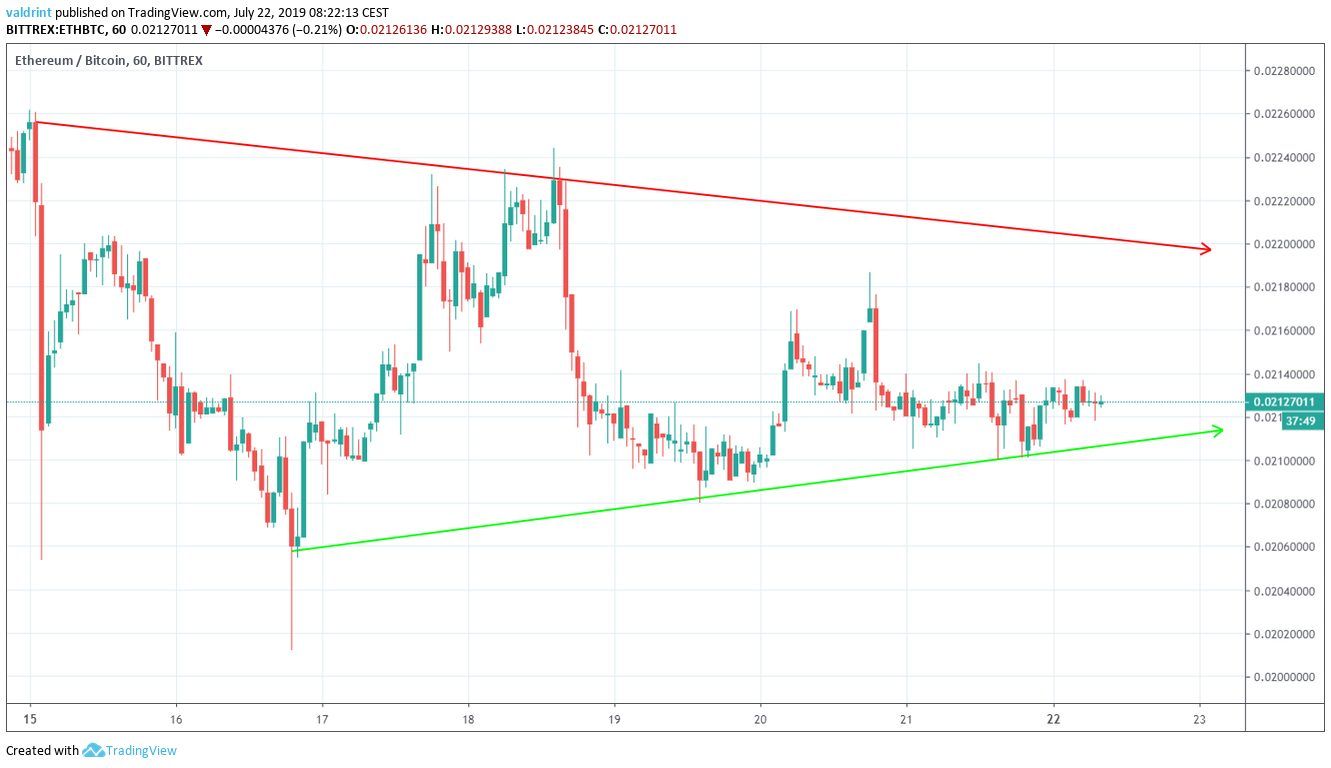
At the time of writing, it was trading very close to the support line of the channel.
In order to predict whether the ETH price is likely to break out or down, we will first analyze a long-term outlook.
Descending Wedge
A look at the weekly time-frame gives us important information about price movement.
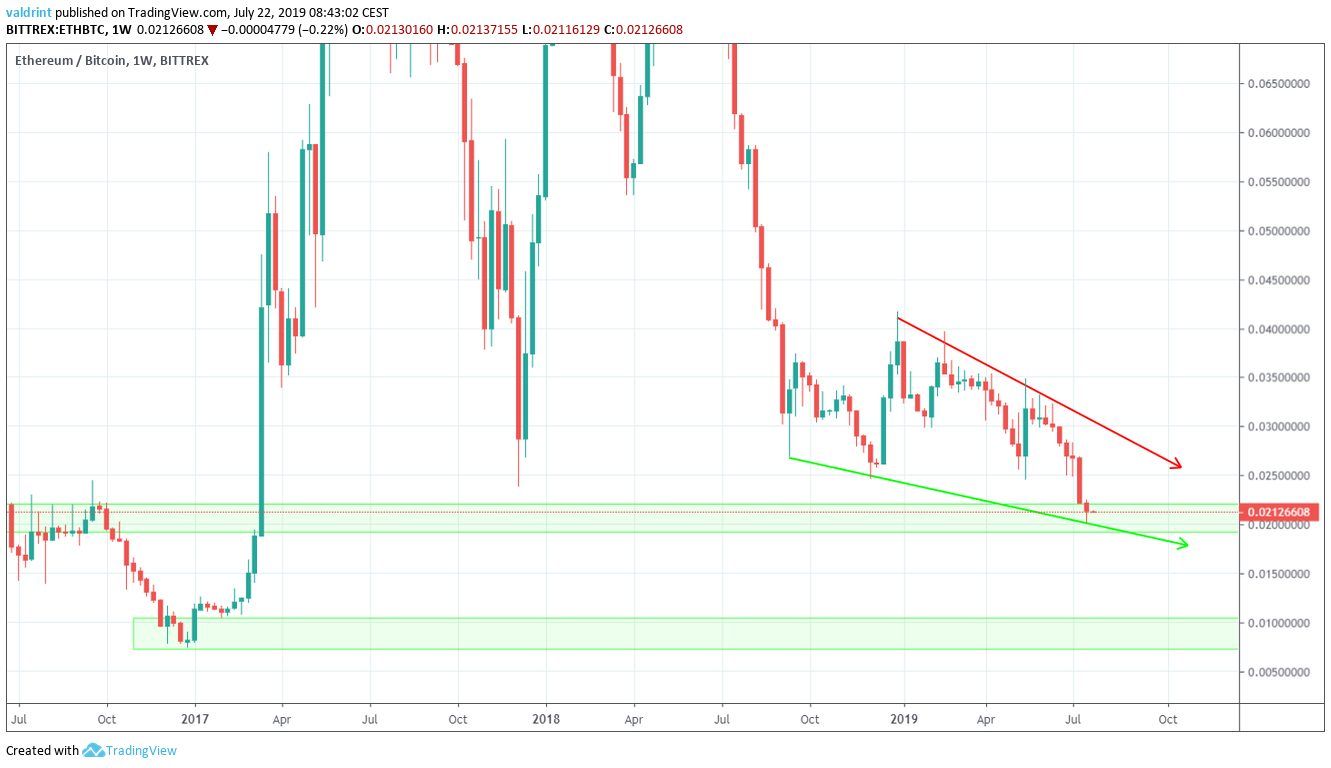
First, we can see that the Ethereum price has been trading inside a descending wedge since July 2018.
Furthermore, the support line of the wedge coincides with a significant support area at ₿0.020.
A look at the RSI and the MACD suggests that a breakout from this pattern will soon occur.
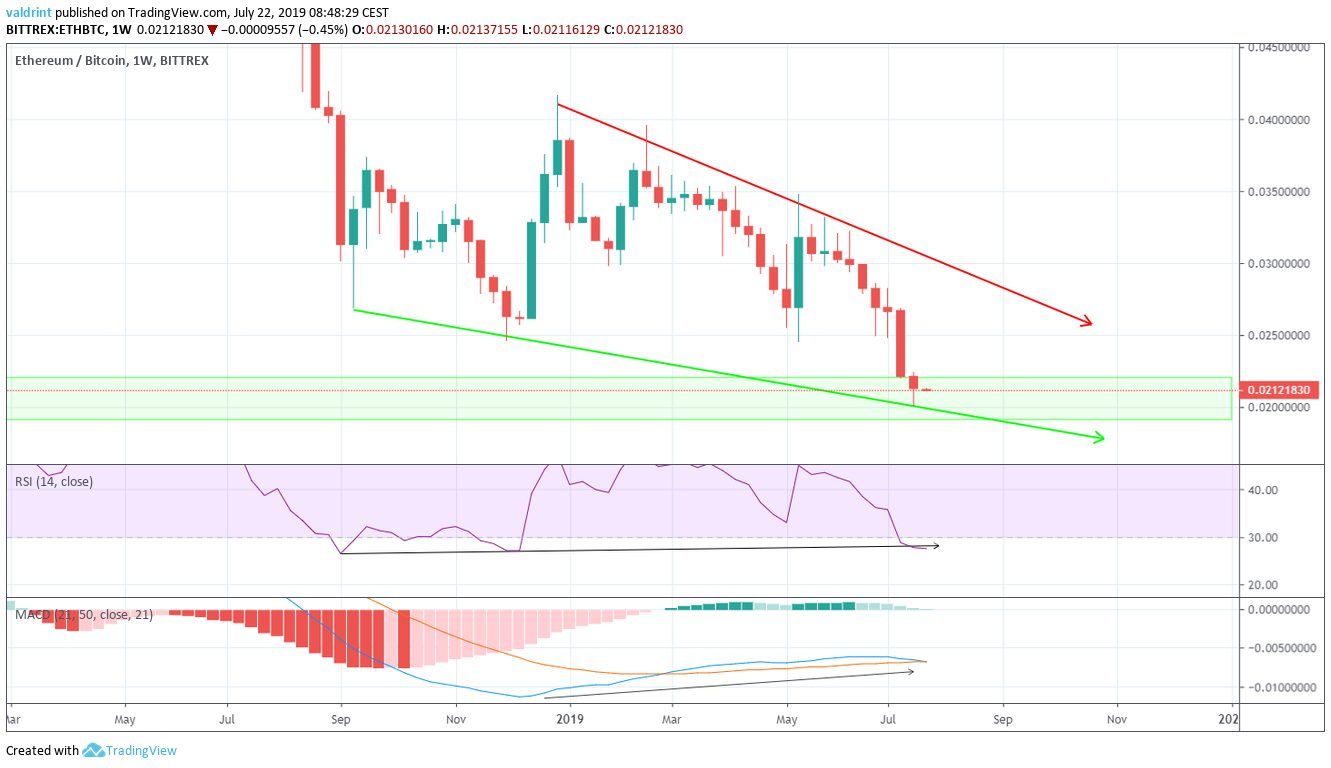
Both indicators have been generating bullish divergence.
The fact that the divergence is present in both indicators and inside a bullish pattern increases its significance.
Finally, the ETH price position makes it an ample position for the initiation of a reversal.
Short-Term Reversal
A look at the six-hour time-frame shows a more recent divergence that has been developing.
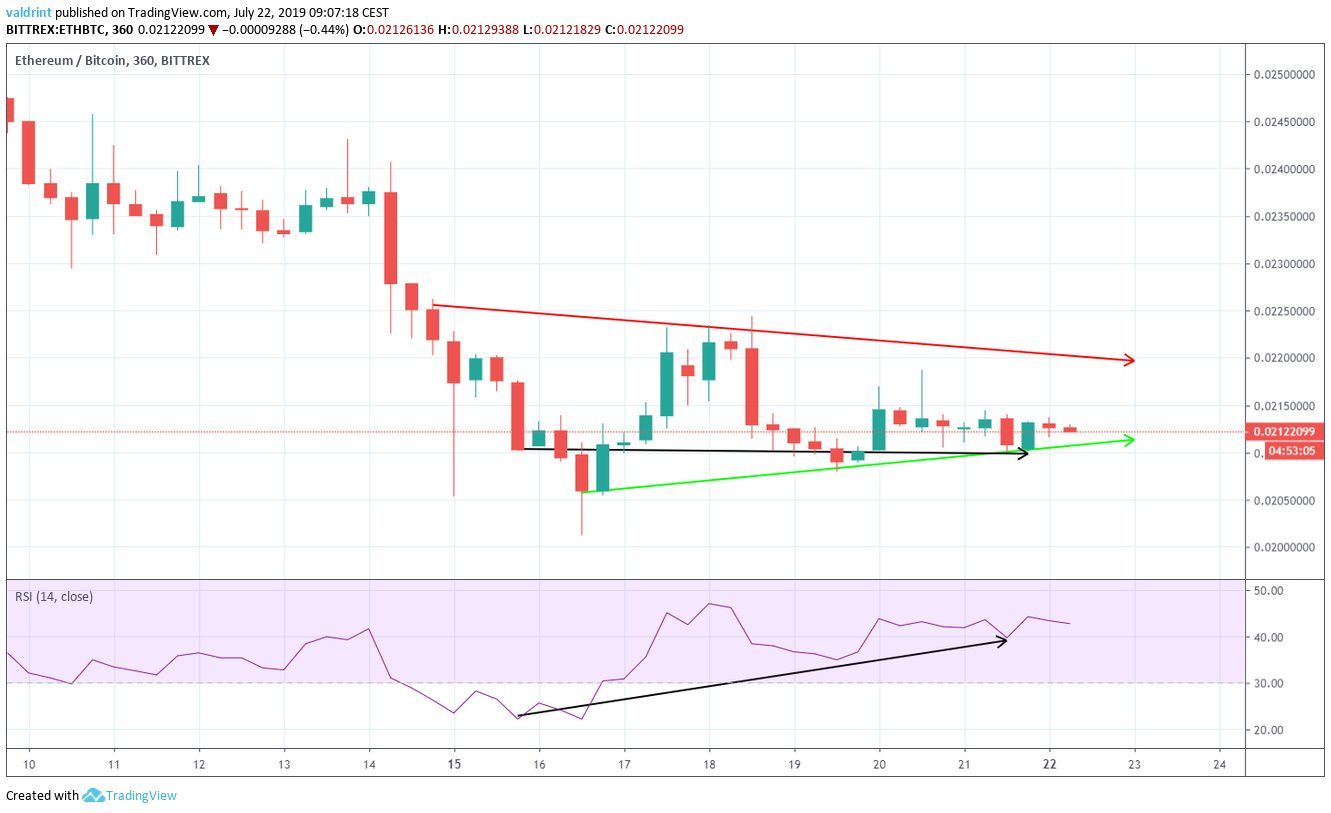
This divergence has been present since the beginning of the support line of the triangle.
In a vacuum, it would not be sufficient in predicting a breakout from the symmetrical triangle.
However, combined with the long-term analysis, it makes it likely that an upward move will soon be initiated.
If so, one resistance area is outlined below:
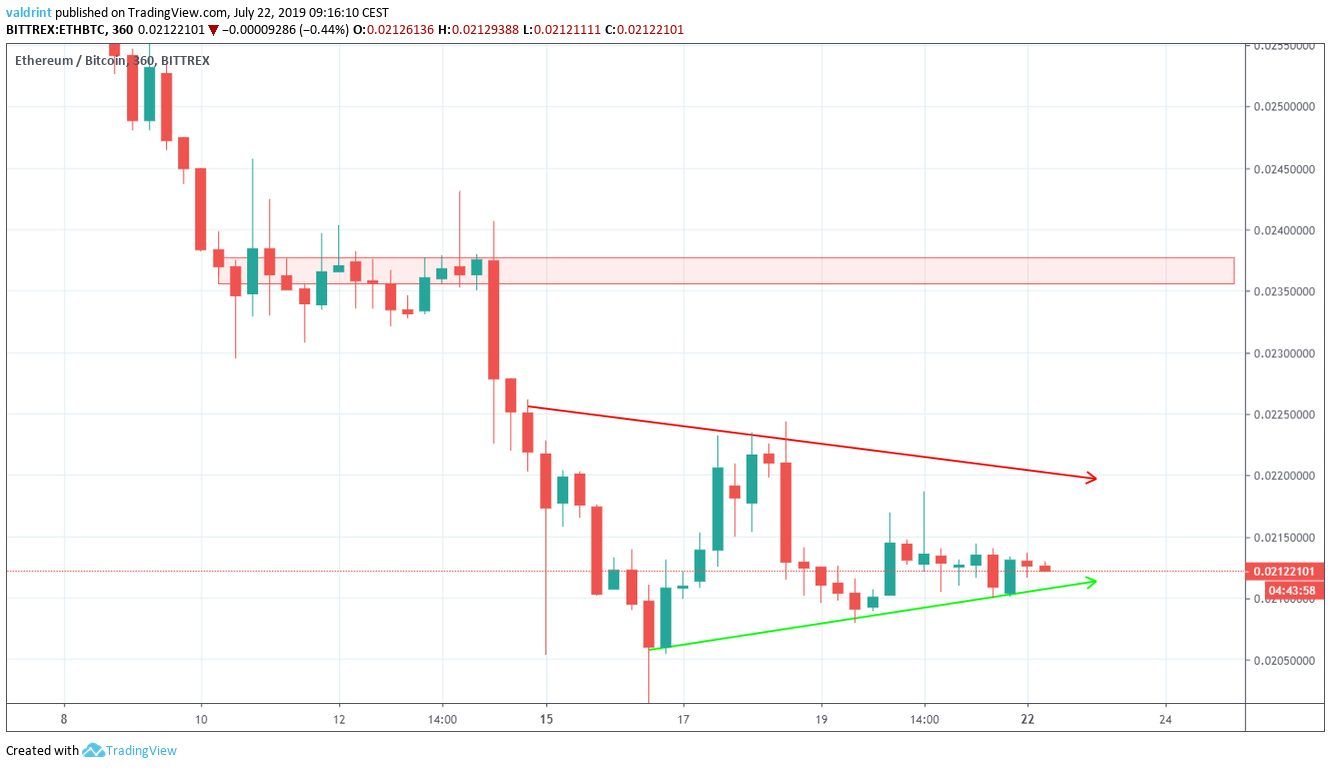
The resistance area is found near 0.0235.
According to our analysis, it is likely that the price will reach this area.
Summary
The Ethereum price is trading inside a symmetrical triangle and a long-term descending wedge.
We believe that the ETH price will break out from the symmetrical triangle and reach the resistance area outlined above.
Do you think the Ethereum price will break out from the triangle? Let us know in the comments below.
