

Ethereum began an upward move in May 2017. Since then, it has alternated between rapid increases and gradual decreases. The ETH price has made a low near ₿0.025 on four different occasions. Additionally, it has not traded below this level since the upward move began in May 2017.
At the time of writing, it was trading at ₿0.026.
Will the ETH price break down? Below, we are going to look at ETH in different time-frames alongside technical indicators in order to answer this question.
For our previous analysis, click here.
If you would like to trade Ethereum (ETH) safely and securely on our partner exchange, follow this link to get all set up on XCOEX.

Ethereum Price: Trends and Highlights for July 5
- ETH/BTC is trading inside a significant support area.
- There is a long-term bullish divergence developing in the RSI and the MACD.
- The price is trading inside a descending channel.
- It has made a triple bottom pattern.
ETH Price: Long-Term Divergence
The Ethereum price is analyzed at weekly intervals from June 2018 to July 2019 alongside the RSI and the MACD
The price has reached the ₿0.025 support level on four occasions:
- September 2018
- December 2018
- May 2019
- July 2019
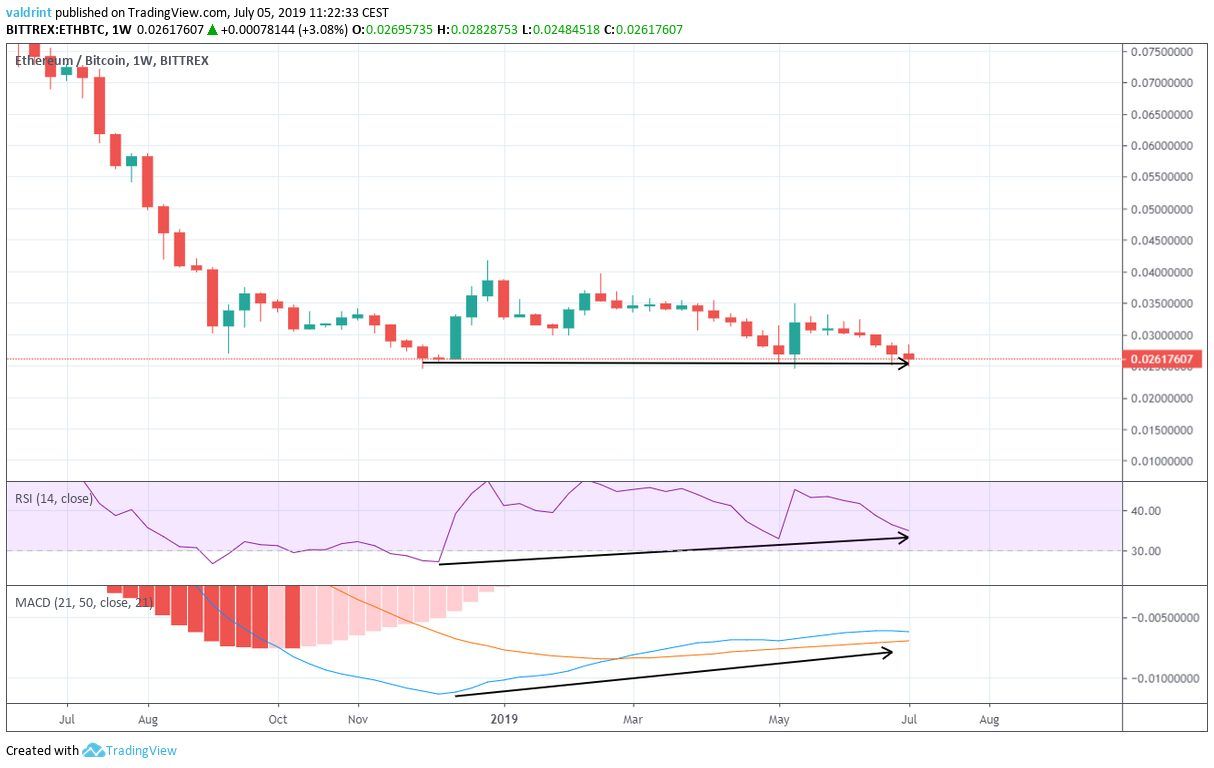 However, the RSI and the MACD reached a low on December 2018.
Since then, they both have been increasing.
This is known as bullish divergence and often precedes price increases.
This level of divergence inside a long-term time frame is not very common.
Therefore, the ensuing upward move could be quite notable.
However, the RSI and the MACD reached a low on December 2018.
Since then, they both have been increasing.
This is known as bullish divergence and often precedes price increases.
This level of divergence inside a long-term time frame is not very common.
Therefore, the ensuing upward move could be quite notable.
Descending Channel
Since the beginning of 2019, the Ethereum price has been trading inside the descending channel outlined below.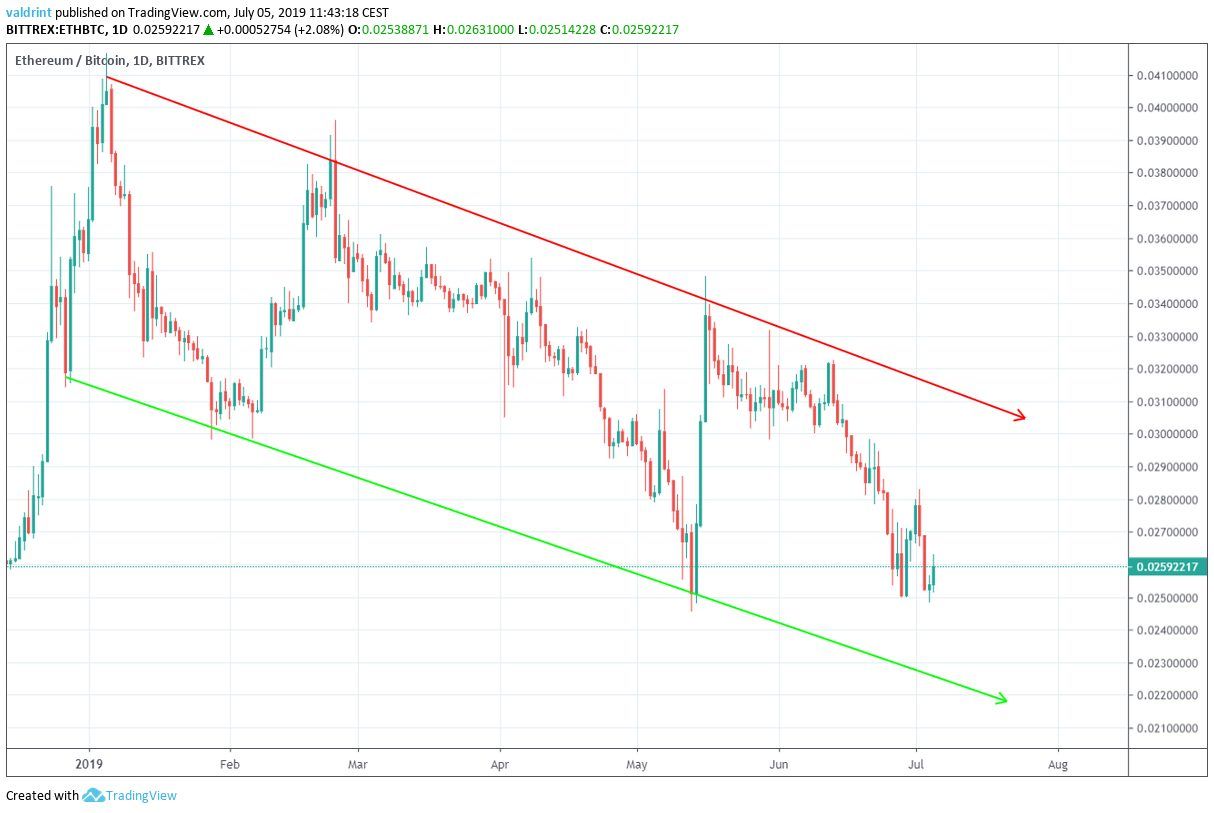 The movement inside the channel has been characterized by rapid increases and gradual decreases.
After touching the support line, the price has initiated an upward move towards the resistance line.
This occurred most recently on May 13.
At the time of writing, the ETH price was trading in the middle of the channel.
The movement inside the channel has been characterized by rapid increases and gradual decreases.
After touching the support line, the price has initiated an upward move towards the resistance line.
This occurred most recently on May 13.
At the time of writing, the ETH price was trading in the middle of the channel.
Triple Bottom
While inside the channel, the price has apparently made a triple bottom, which is considered a bullish reversal pattern.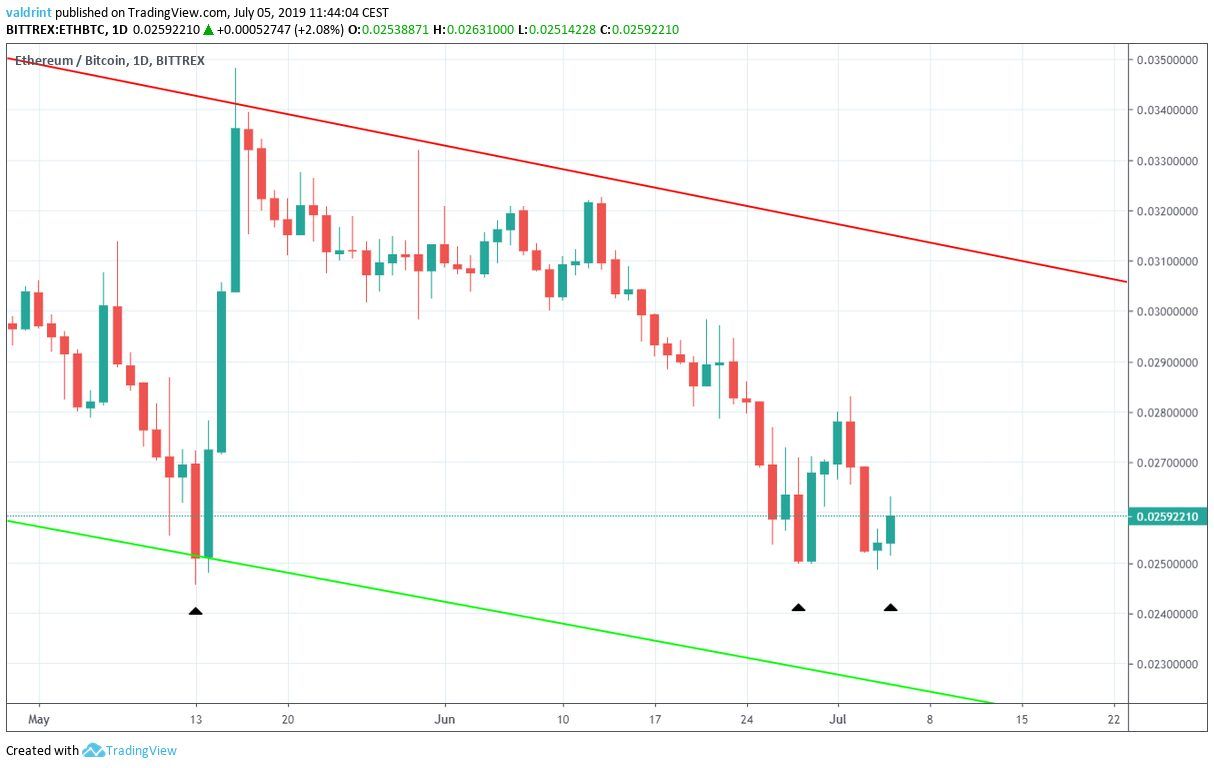 ETH made a low of ₿0.025 on May 13, 25 and July 4.
An upward move that reached the resistance line began soon after a low was reached on May 13.
The same thing transpired on May 25, but the ensuing upward move was significantly weaker.
In order to determine whether another upward move will follow, we will use the RSI.
ETH made a low of ₿0.025 on May 13, 25 and July 4.
An upward move that reached the resistance line began soon after a low was reached on May 13.
The same thing transpired on May 25, but the ensuing upward move was significantly weaker.
In order to determine whether another upward move will follow, we will use the RSI.
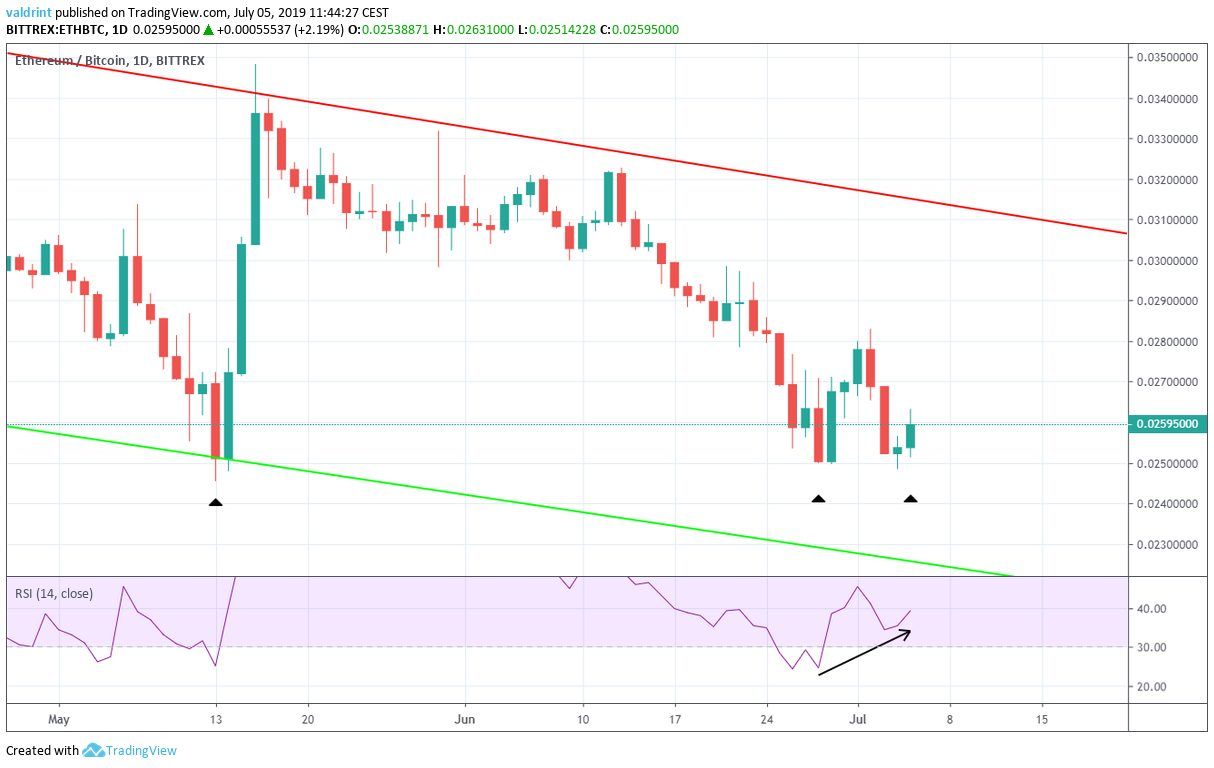 Since May 25, a bullish divergence has been developing in the RSI.
Combined with the analysis from the previous section, this makes us believe that the ETH price will not drop to the support line.
Rather, it is likely to initiate an upward move from the current level.
Since May 25, a bullish divergence has been developing in the RSI.
Combined with the analysis from the previous section, this makes us believe that the ETH price will not drop to the support line.
Rather, it is likely to initiate an upward move from the current level.
Alternative Scenario
However, the most recent price movement since May 13 also has similarities to the Cup and Handle, which is considered a bearish pattern.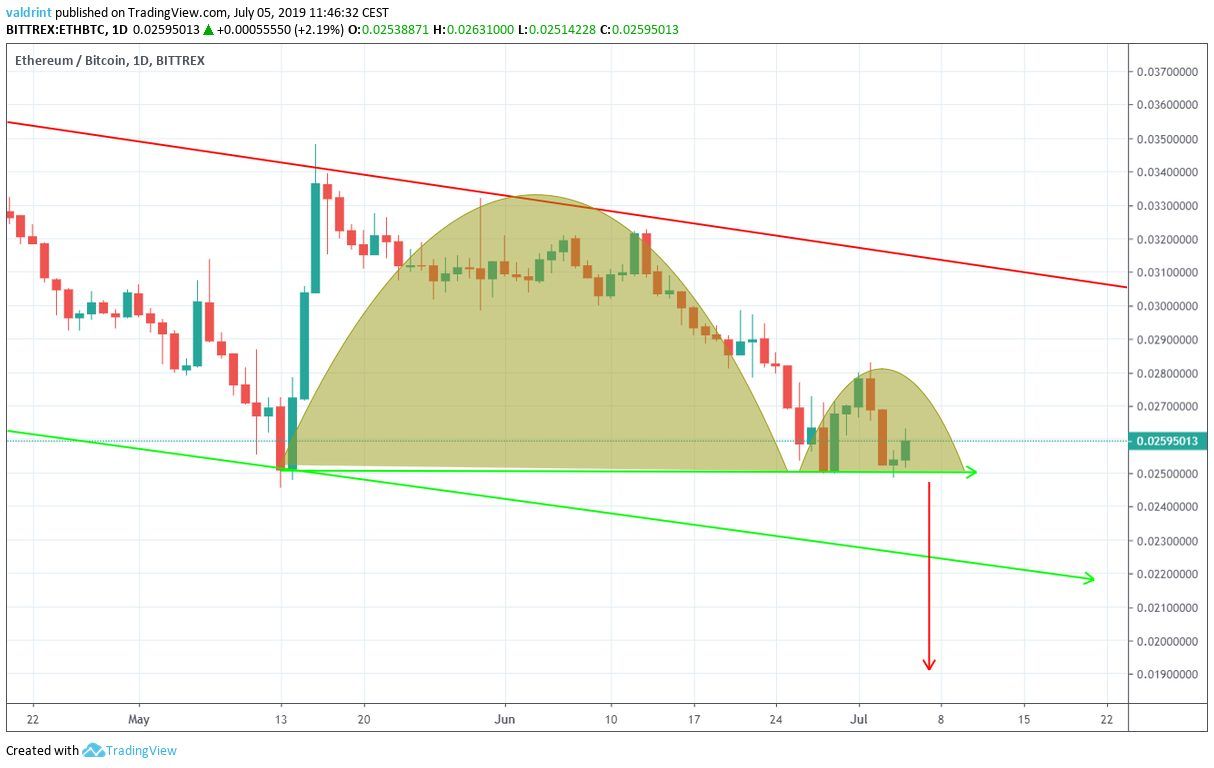 However, we do not believe this is likely for the following reasons:
- A breakdown would cause the price to decrease rapidly, invalidating both the support area and the descending channel.
- The long-term bullish divergence.
- The short-term bullish divergence.
Summary
The Ethereum price is currently trading inside a very significant support area. The readings from the momentum indicators and recent price movement make us believe that it will soon initiate an upward move. Do you think the Ethereum price will soon begin an upward move? Let us know in the comments below.Disclaimer: This article is not trading advice and should not be construed as such. Always consult a trained financial professional before investing in cryptocurrencies, as the market is particularly volatile. Images are courtesy of Shutterstock, TradingView.
Top crypto platforms in the US
Disclaimer
In line with the Trust Project guidelines, this price analysis article is for informational purposes only and should not be considered financial or investment advice. BeInCrypto is committed to accurate, unbiased reporting, but market conditions are subject to change without notice. Always conduct your own research and consult with a professional before making any financial decisions. Please note that our Terms and Conditions, Privacy Policy, and Disclaimers have been updated.

Valdrin Tahiri
Valdrin discovered cryptocurrencies while he was getting his MSc in Financial Markets from the Barcelona School of Economics. Shortly after graduating, he began writing for several different cryptocurrency related websites as a freelancer before eventually taking on the role of BeInCrypto's Senior Analyst.
(I do not have a discord and will not contact you first there. Beware of scammers)
READ FULL BIO
Sponsored
Sponsored