
On January 5, 2019, the Ethereum price reached a high of ₿0.0419. A gradual decrease ensued. Since then, the price has created several lower highs and lows.
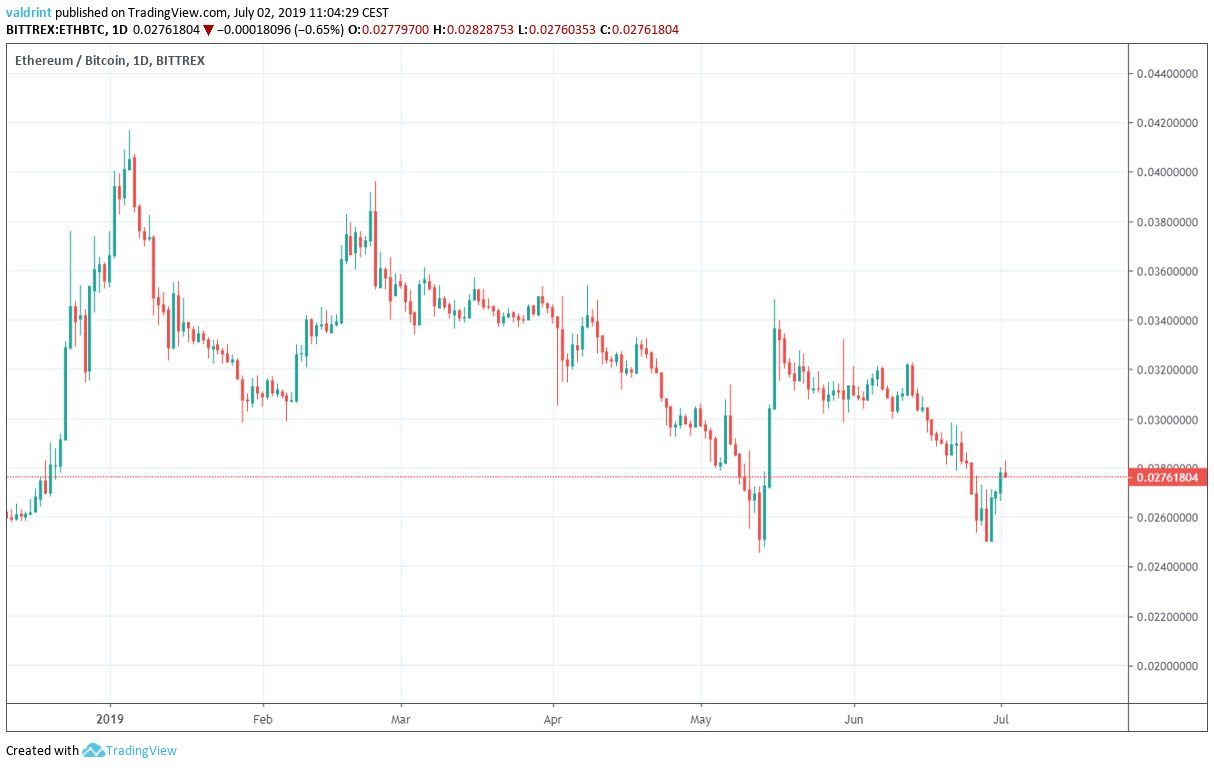
At the time of writing, the ETH price was trading near ₿0.027.
Where will it go next? Keep reading below and find out.
For our previous analysis, click here.
If you are interested in trading Ethereum on our partner exchange, follow this link to get signed up on XCOEX.
Ethereum Price: Trends and Highlights for June 2
- ETH/BTC is trading inside a descending channel.
- It is following a short-term ascending support line.
- Daily moving averages have made several bearish crosses.
- The ETH price is in a long-term support area.
- A significant bullish divergence has been created in the RSI and the MACD.
Ethereum Price in a Descending Channel
On January 5, 2019, the Ethereum price reached a high of ₿0.0419. A gradual decrease ensued, which is still continuing at the time of writing.
During this period, the price has been trading inside the ascending channel outlined below.
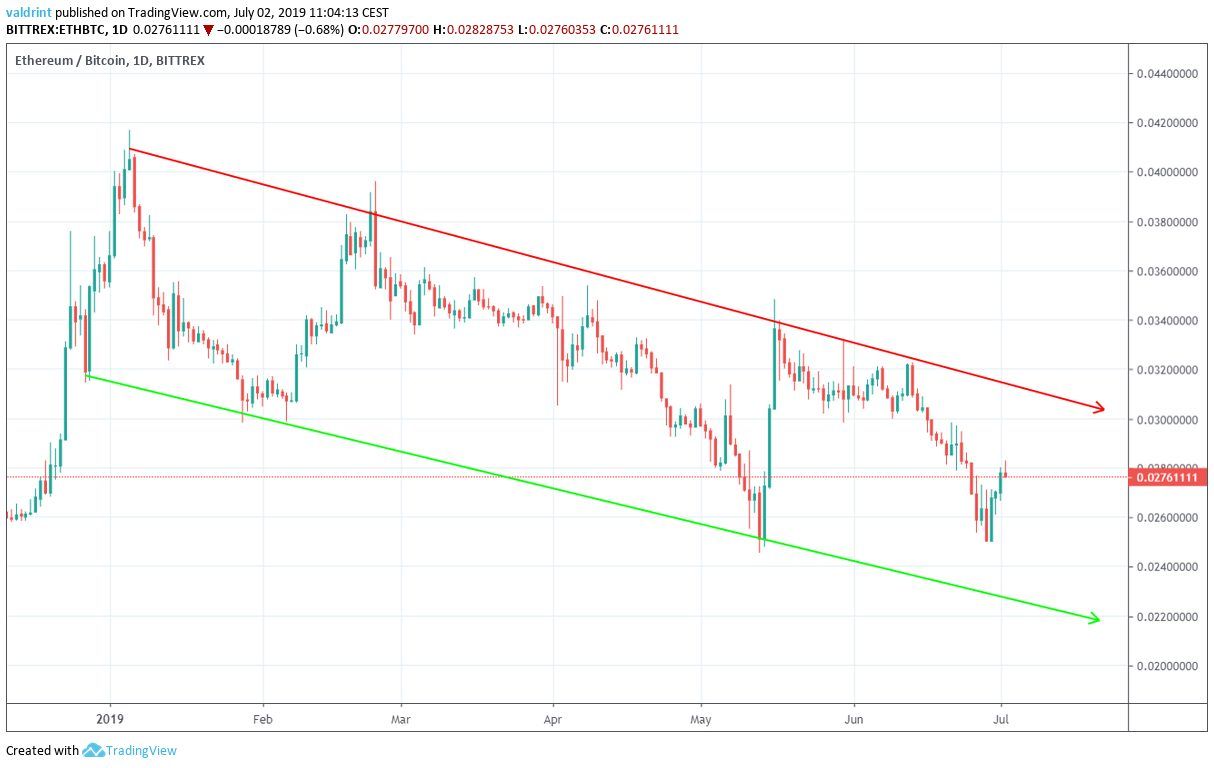
At the time of writing, it was trading in the middle of the channel, after several unsuccessful attempts at a breakout in May/June.
The resistance line is currently near ₿0.030.
In the short-term, the ETH price recently broke out from an ascending triangle.
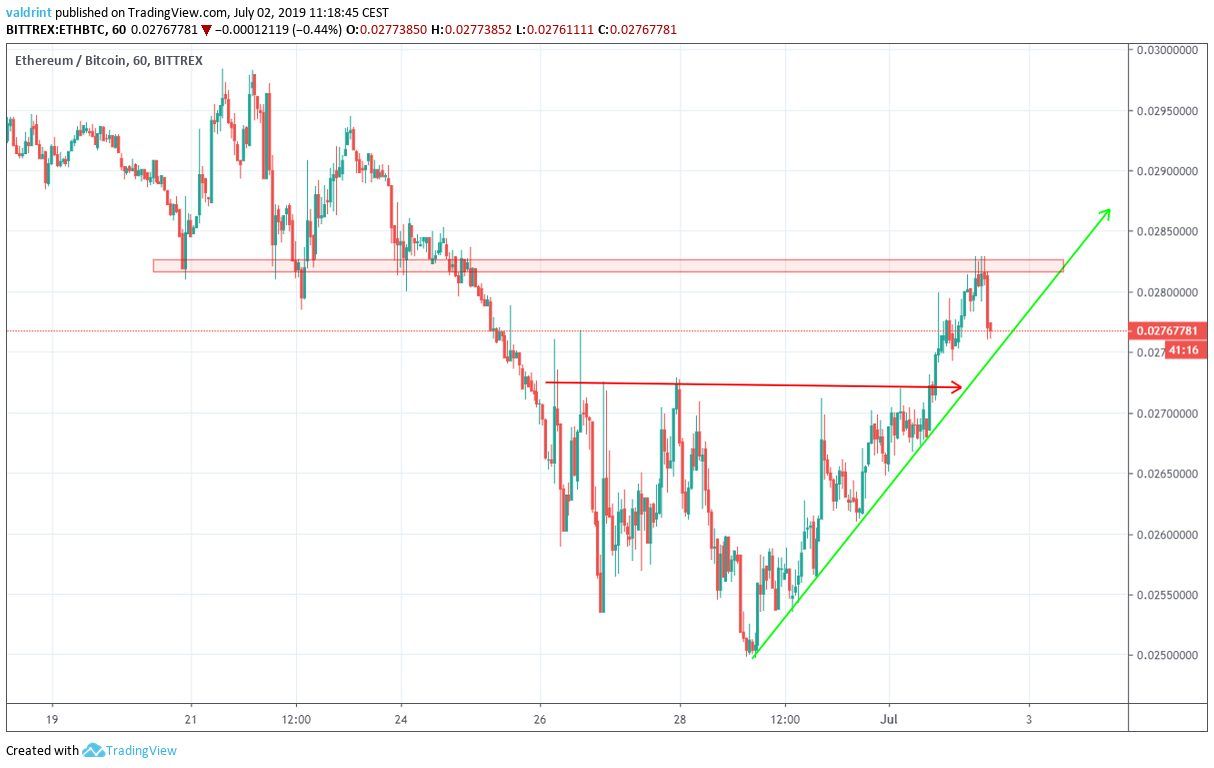
It is currently following a very steep resistance line, and has met resistance slightly above ₿0.028.
To conclude, while the ETH price is currently heading for the resistance line of the channel, there is still significant resistance left to clear before it gets there.
Technical Indicators
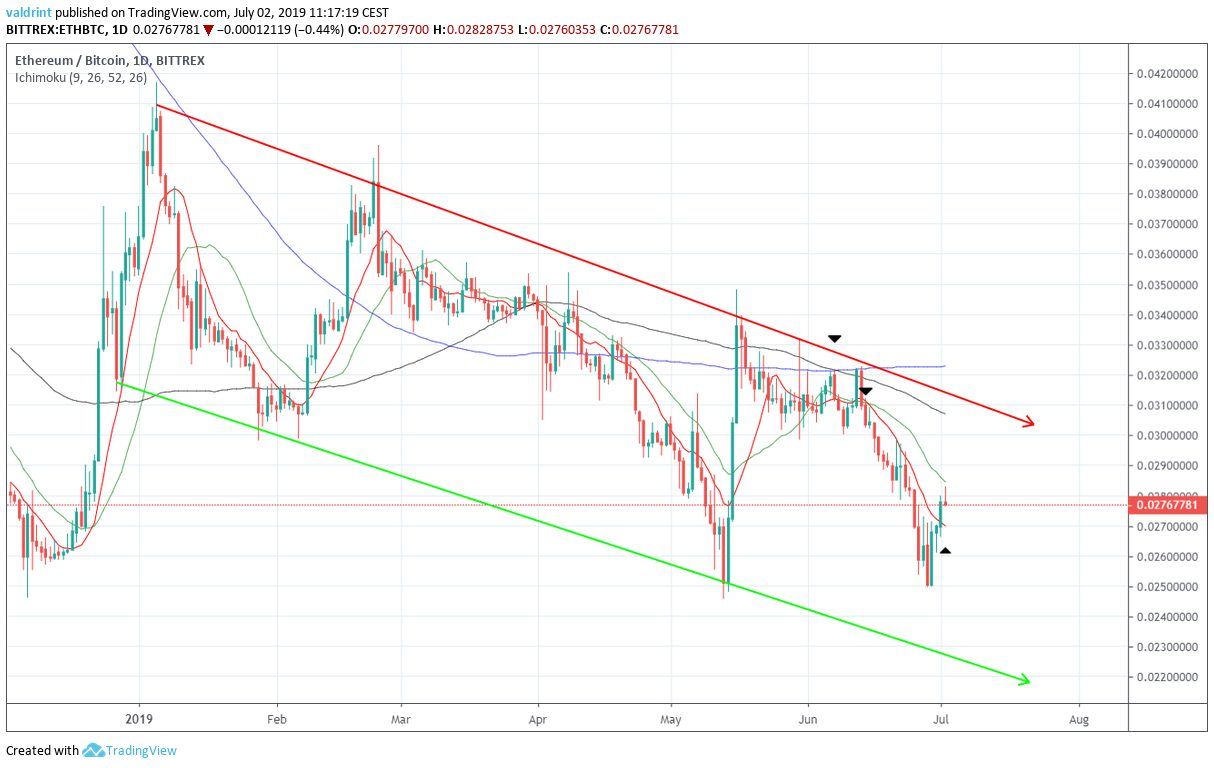
On June 5, a bearish cross occurred between the 100- and 200- period moving averages.
The 10- and 20-period MAs followed suit shortly after.
This means that the Ethereum price is likely in a downtrend.
In a more positive note, the recent increase took the price above the 10-period MA. However, it was unsuccessful in increasing above the 20-period one.
Long-Term
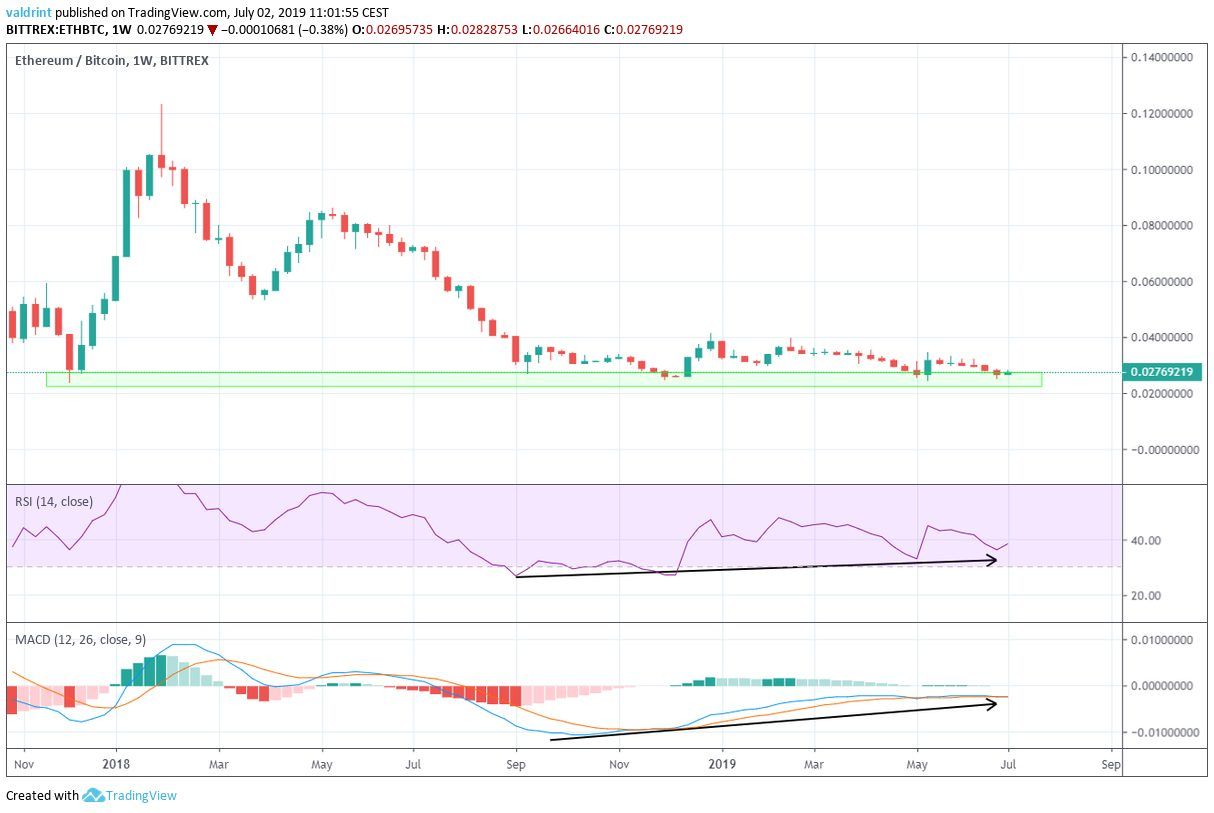
The ETH price has visited this level four other times.
Every time, the RSI and the MACD have generated a higher high. This is known as bullish divergence and often precedes price increases.
The divergence is significant in value, occurring in both indicators and in a weekly time-frame, which is not a common occurrence.
Furthermore, it is appearing at a significant support level.
This makes it an ideal place for the beginning of another upward move.
Summary
The price of Ethereum has fallen to a major support level. This level has not been broken in almost two years.
Furthermore, long-term technical indicators show that there is potential for the beginning of an upward move.
In a shorter term time-frame, the Ethereum price is trading inside a descending channel and has done so since the beginning of 2019.
Do you think the price of Ethereum will begin an upward move? Let us know in the comments below.
Disclaimer: This article is not trading advice and should not be construed as such. Always consult a trained financial professional before investing in cryptocurrencies, as the market is particularly volatile.
Images are courtesy of Shutterstock, TradingView.
