
Ethereum (ETH) price is showing a rare technical signal last seen six months ago — right before it rallied more than 80%. The token is trading near $4,020, down about 1.8% in the past 24 hours, 8.7% over the week, and nearly 10% in 30 days, marking a clear downtrend.
But fresh on-chain data and a familiar momentum pattern suggest that this decline may be losing strength.
Bullish Divergence Reappears as Exchange Outflows Surge
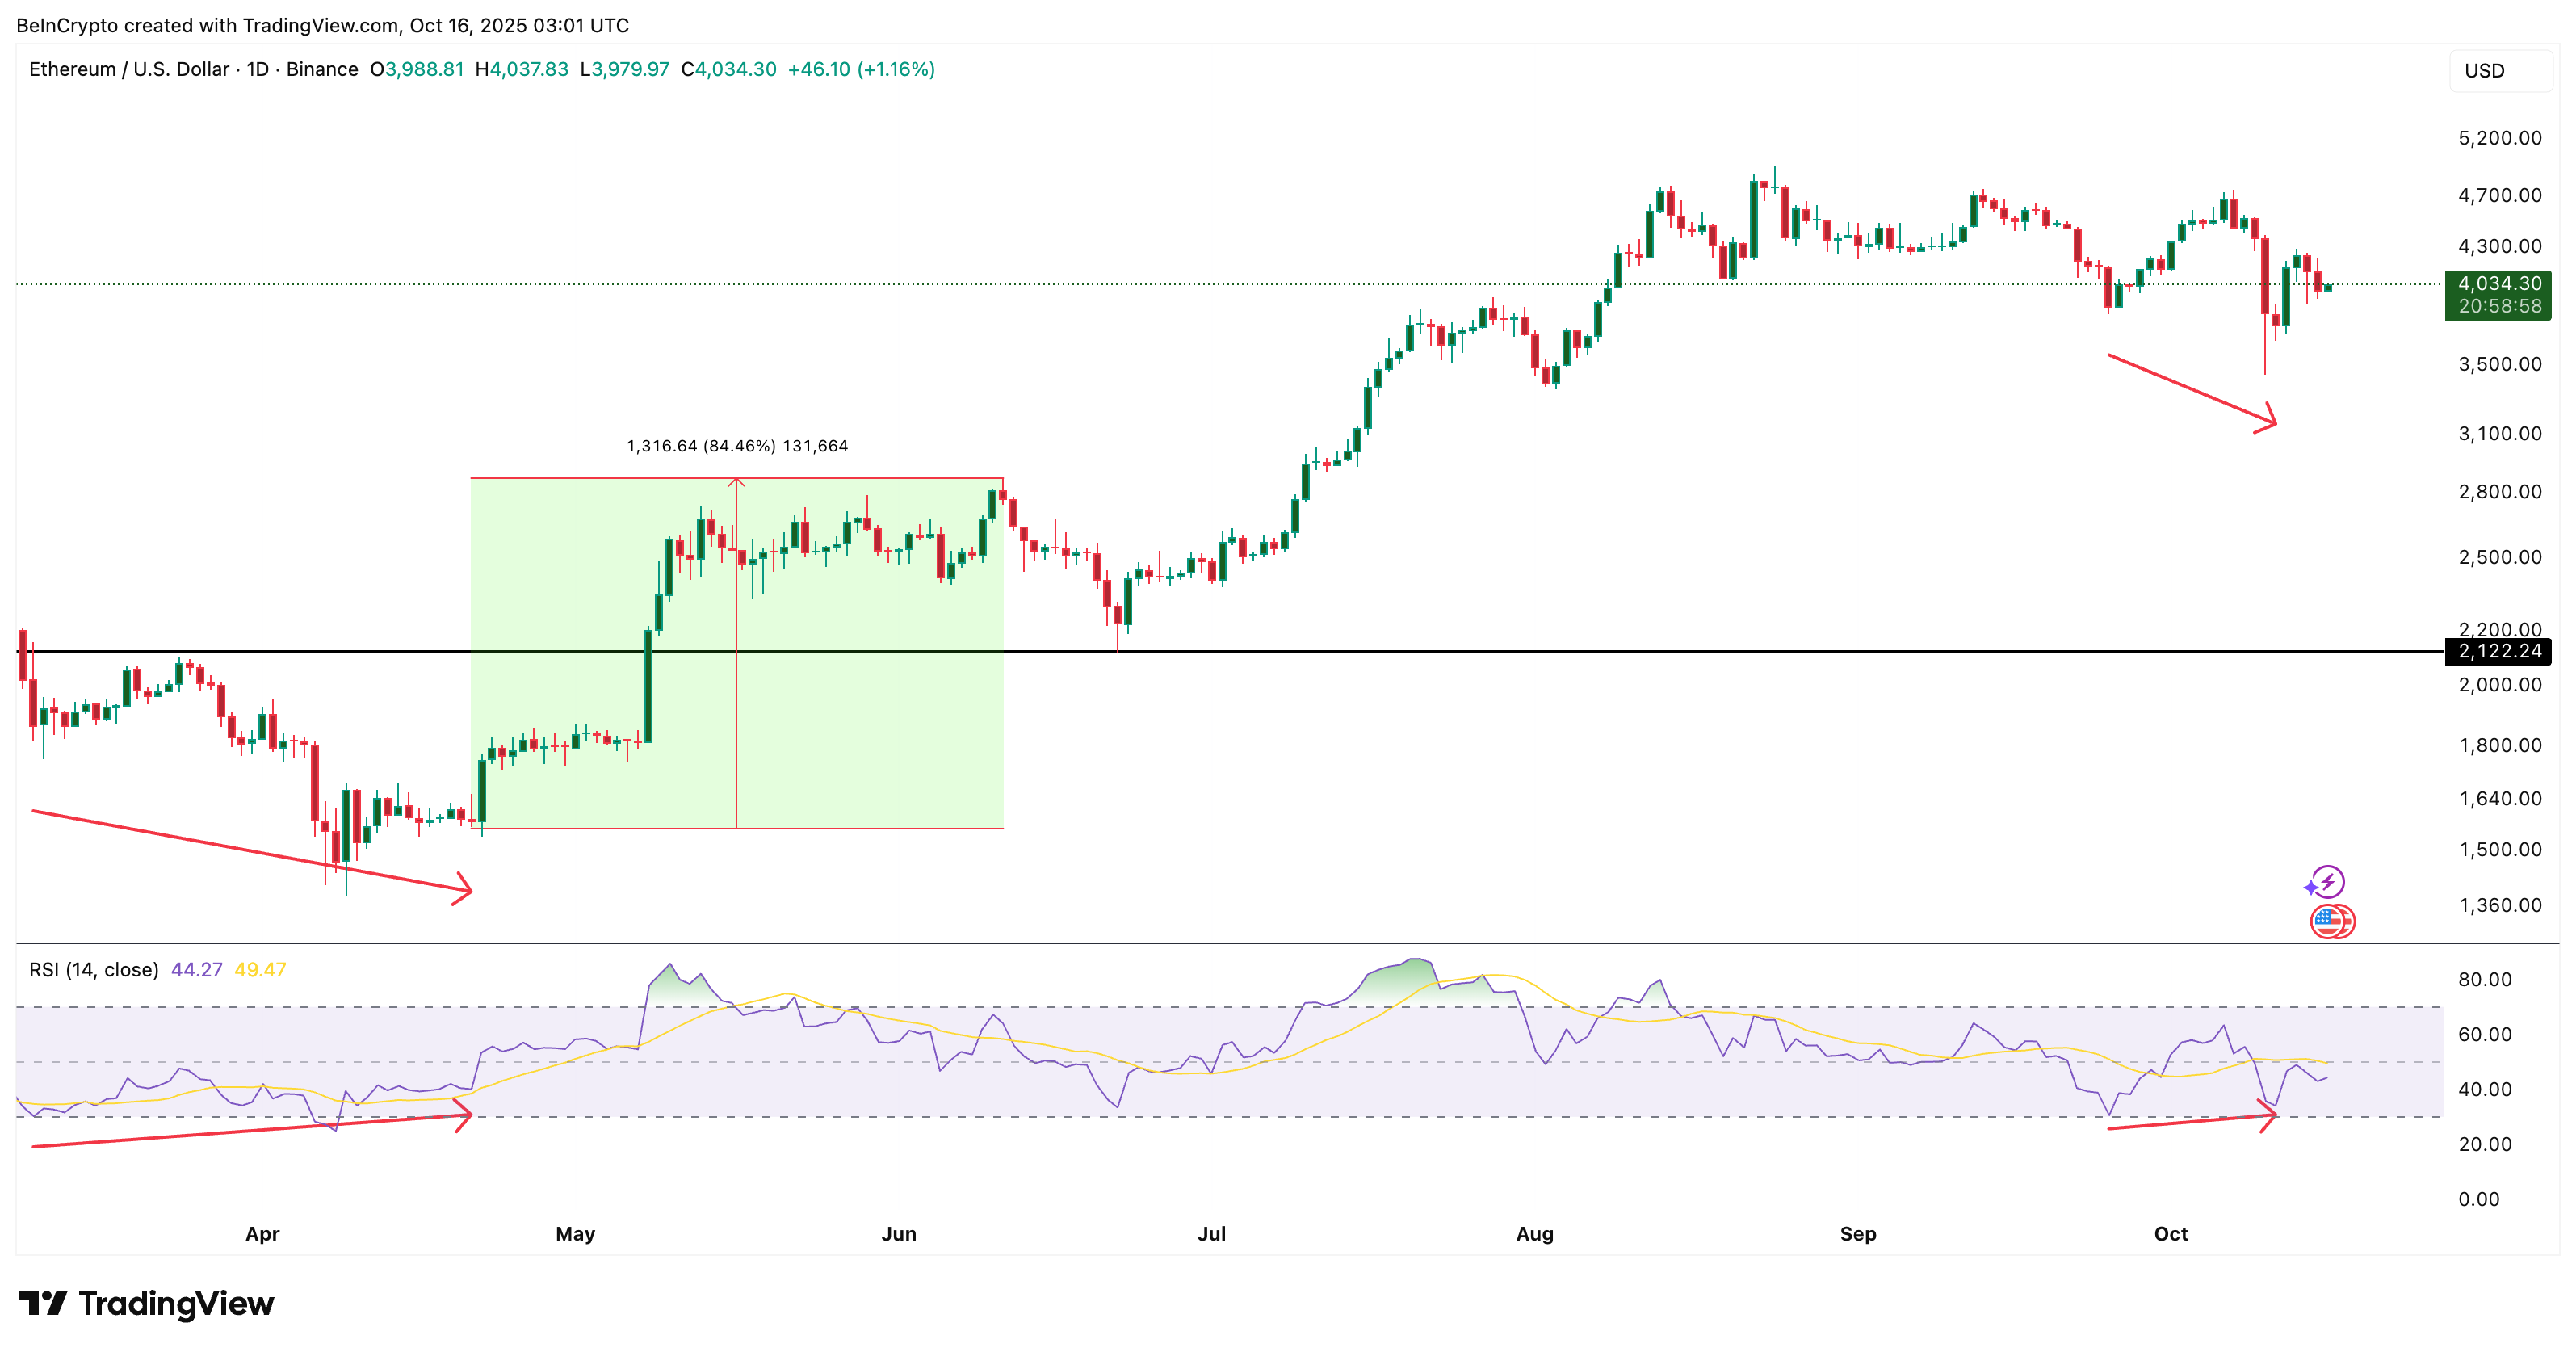
The Relative Strength Index (RSI), which measures how fast and how strong price movements are, is showing a bullish divergence. This happens when prices make lower lows but the RSI makes higher lows — a sign that selling pressure is weakening.
A bullish divergence often hints at a possible trend reversal, which means a downtrend could be nearing its end. The last time Ethereum clearly showed this pattern was between March 10 and April 21, when it rose 84.46% Before that reversal, Ethereum was in a similar decline. The setup repeating now could signal that the current downtrend is close to flipping again.
Want more token insights like this? Sign up for Editor Harsh Notariya’s Daily Crypto Newsletter here.
Ethereum whales — wallets holding large amounts of ETH — appear to be preparing early for this. On-chain data shows these addresses increased their holdings from 100.36 million ETH on October 14 to 100.51 million ETH two days later. That’s an addition of roughly 150,000 ETH, equal to about $603 million at current ETH prices.
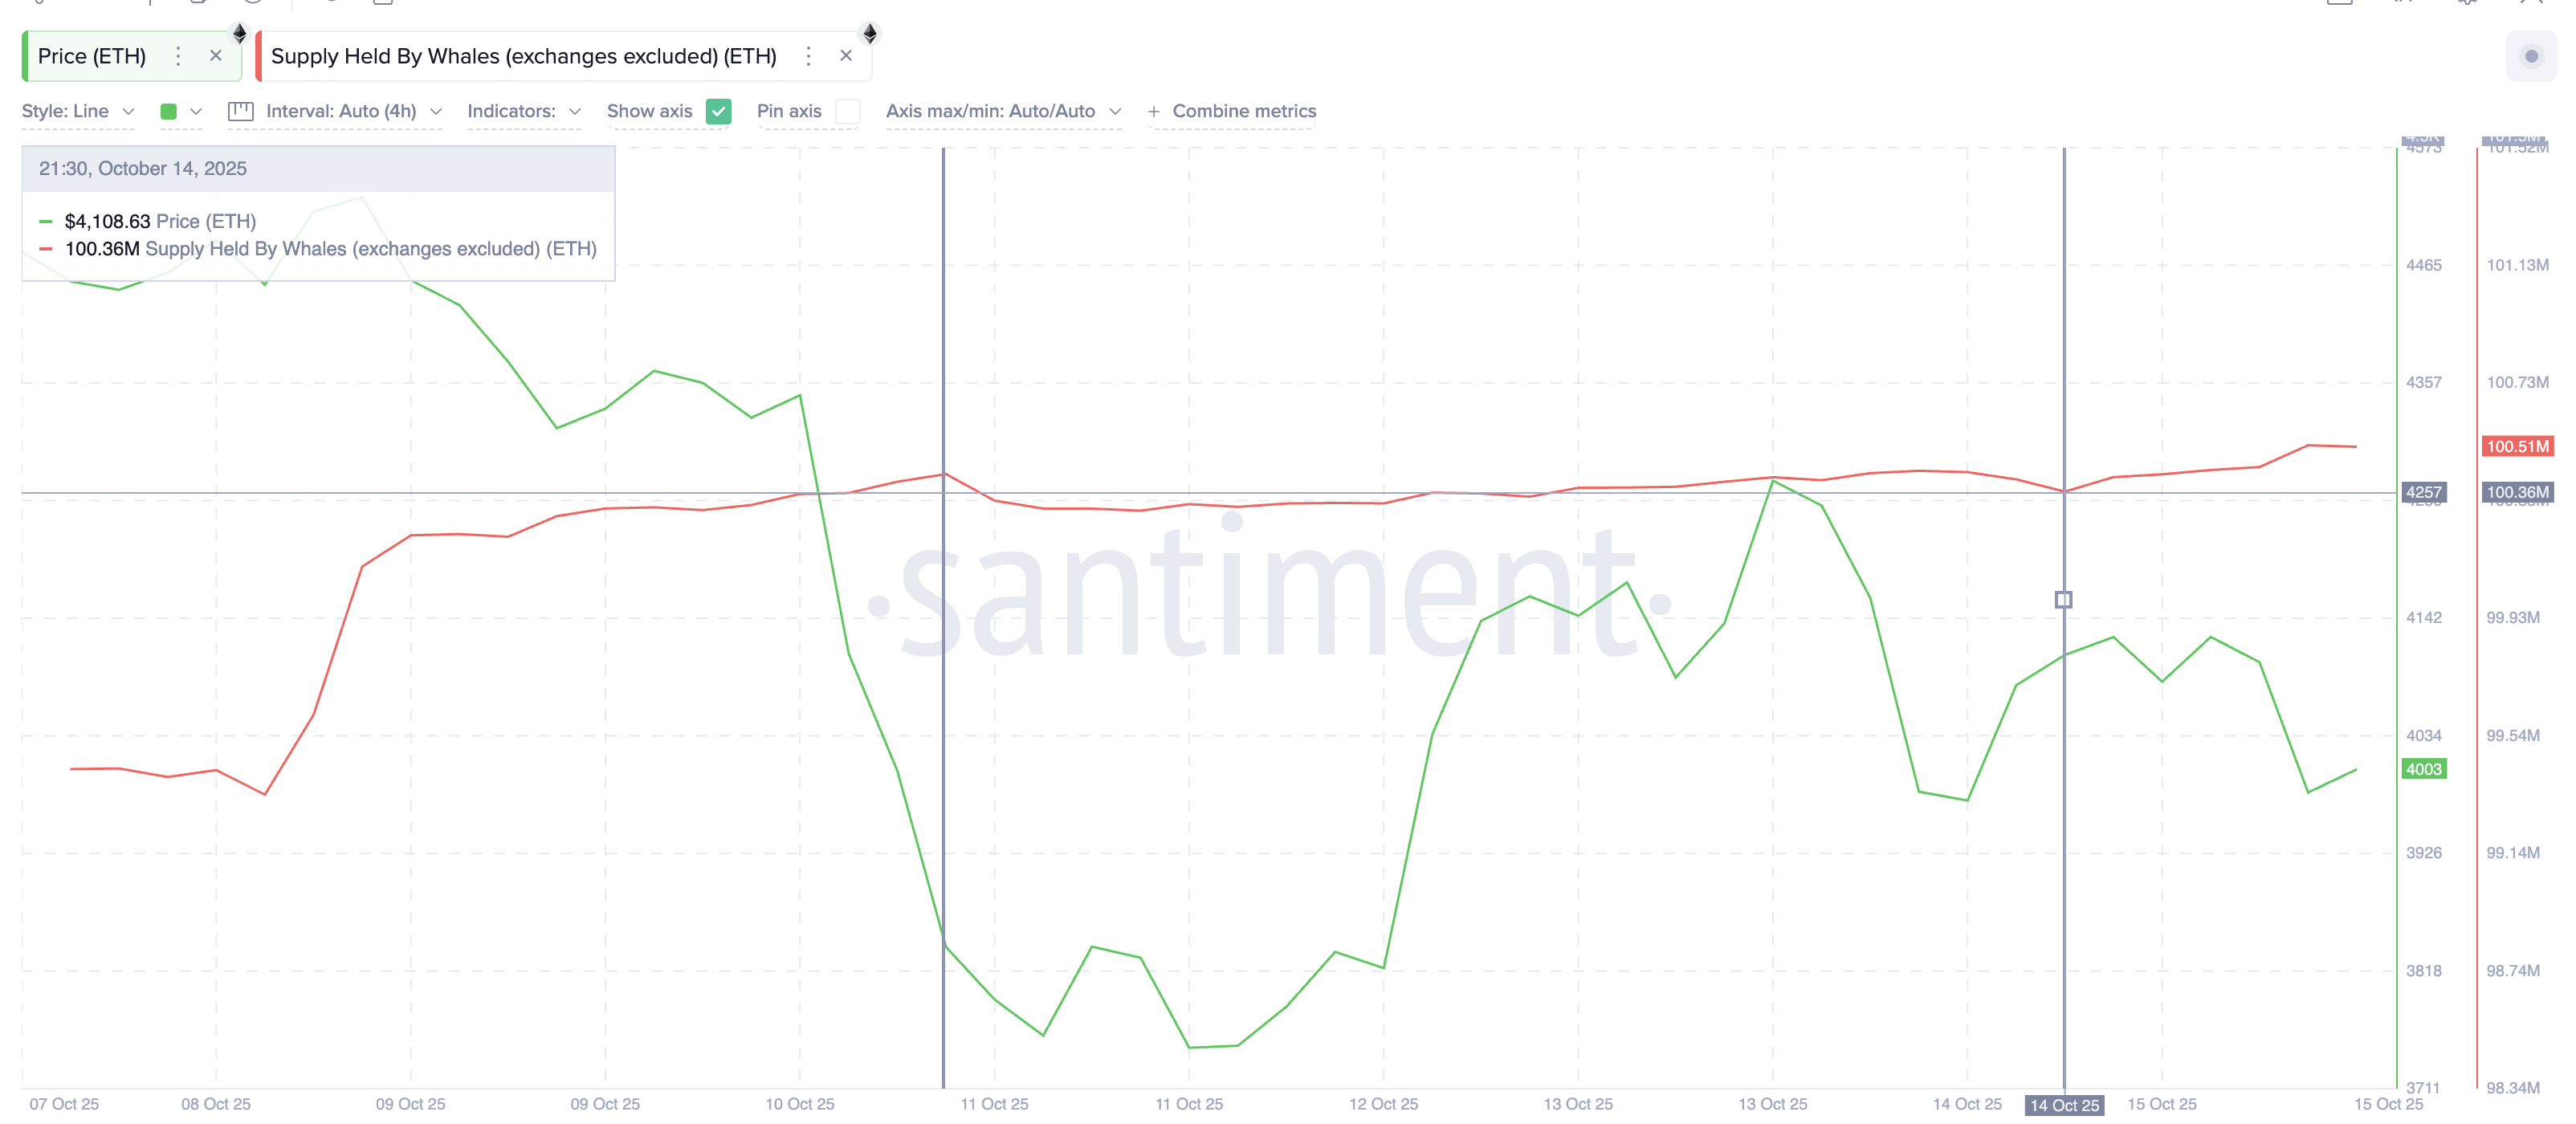
While the pace is slow, this accumulation hints that big players are rebuilding positions as the market still recovers.
At the same time, the Exchange Net Position Change, which tracks how much ETH is moving into or out of exchanges, has deepened from –1.55 million ETH on October 10 to –1.94 million ETH on October 15.
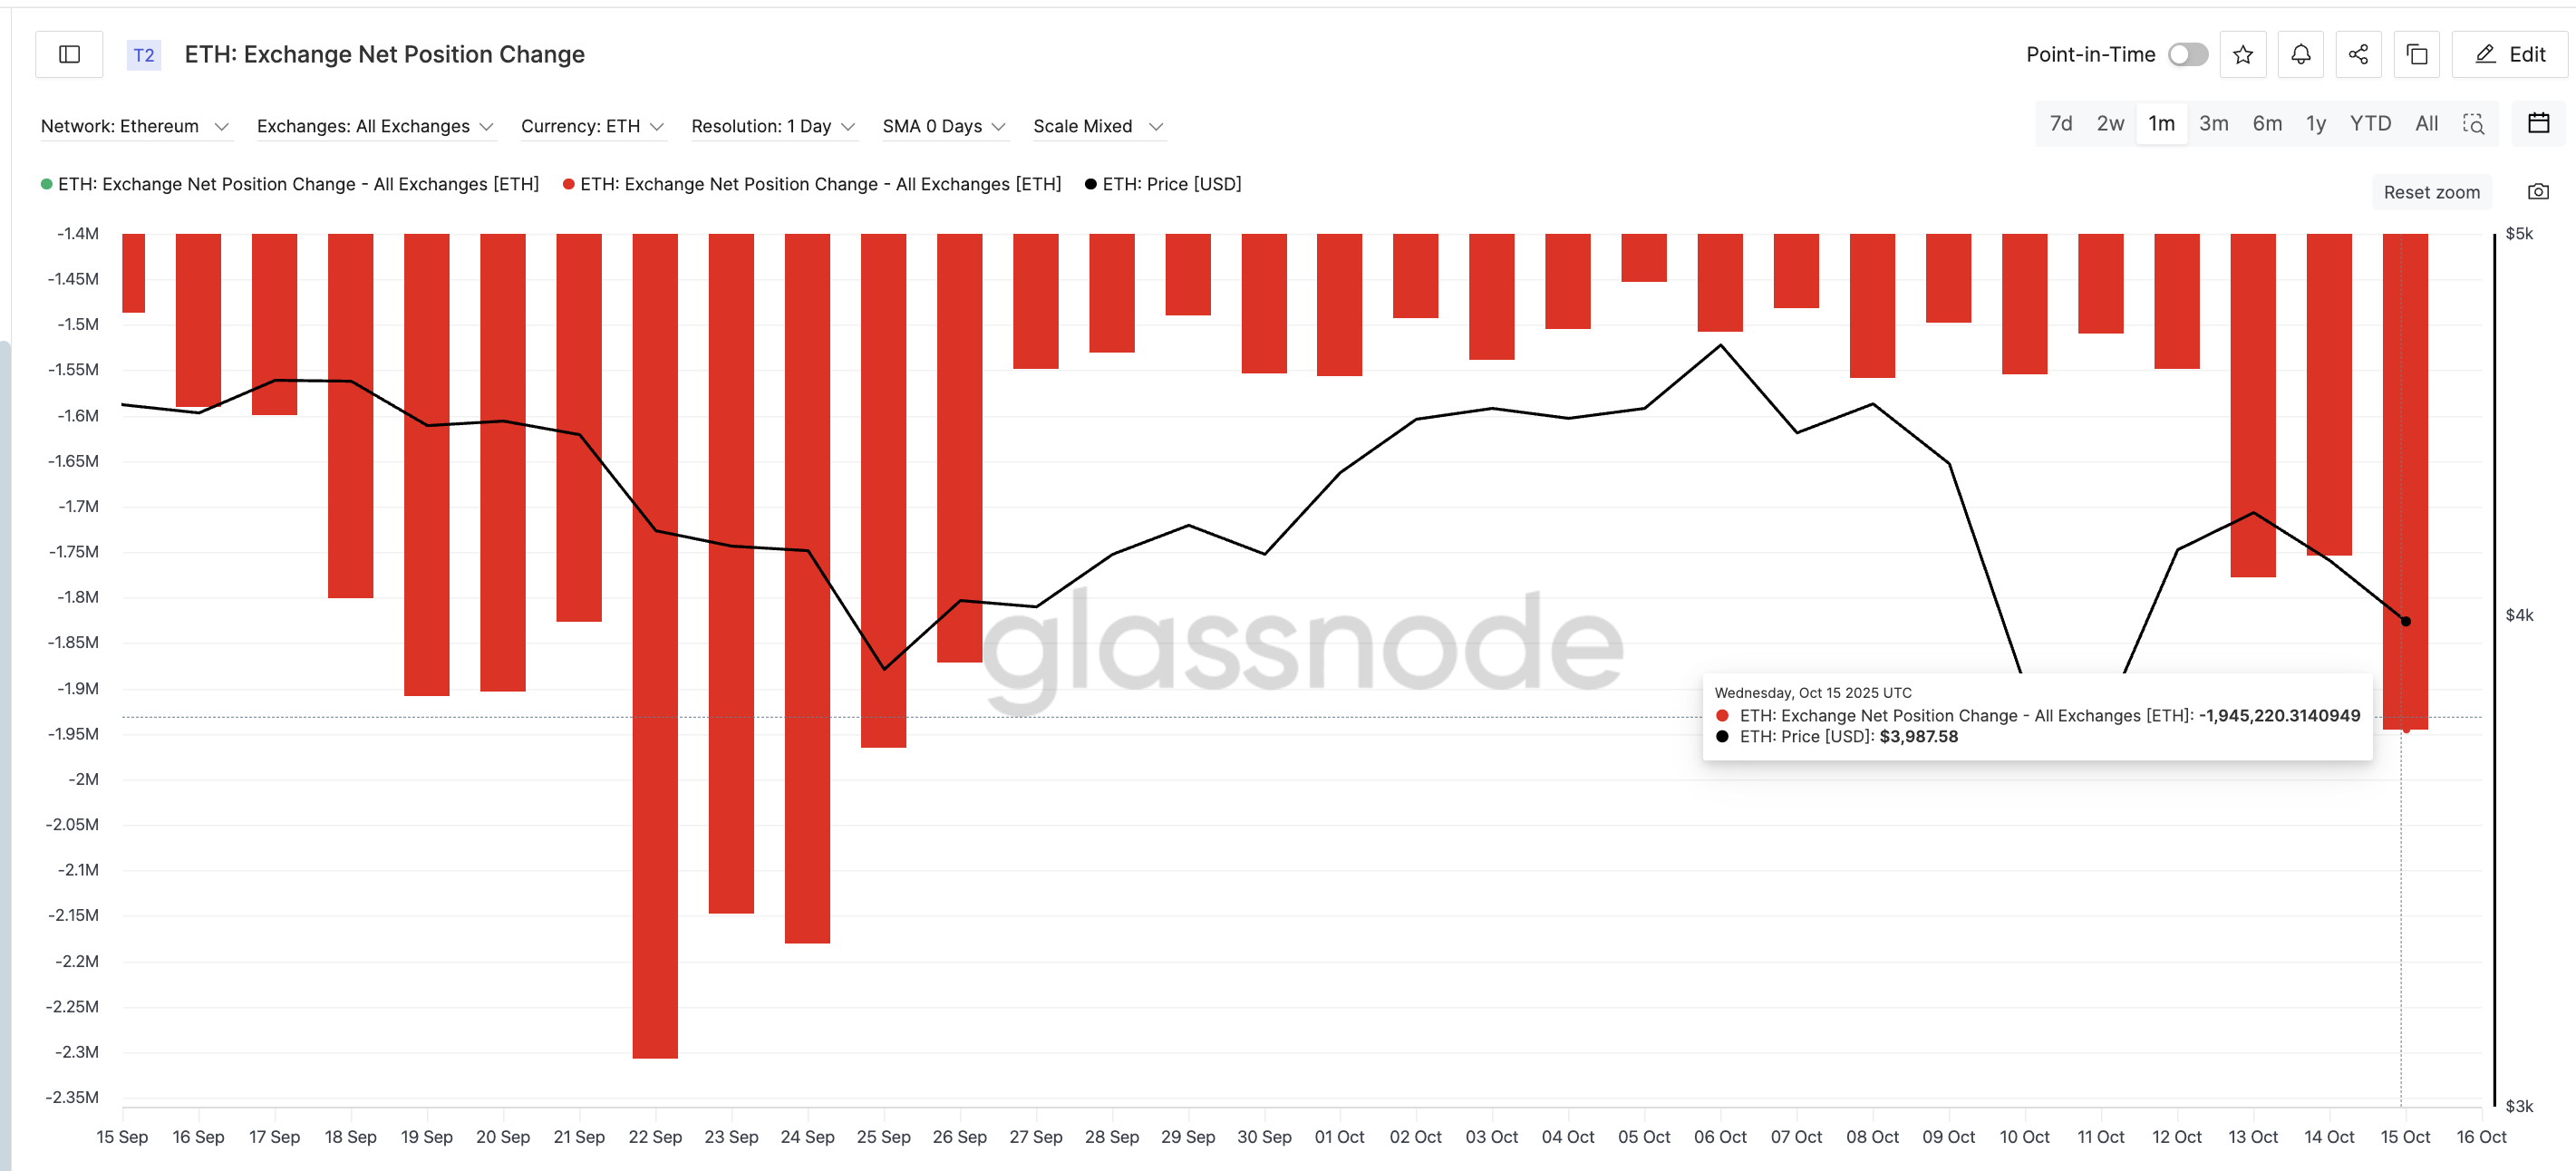
The negative number means more coins are leaving exchanges than entering — a sign of surging buying pressure as investors shift holdings into long-term storage. This 25% jump in outflows marks the highest level since September 25. Along with whale accumulation trends, this could be in anticipation of a possible Ethereum price jump.
Ethereum Price Faces a Critical Test Near $4,076
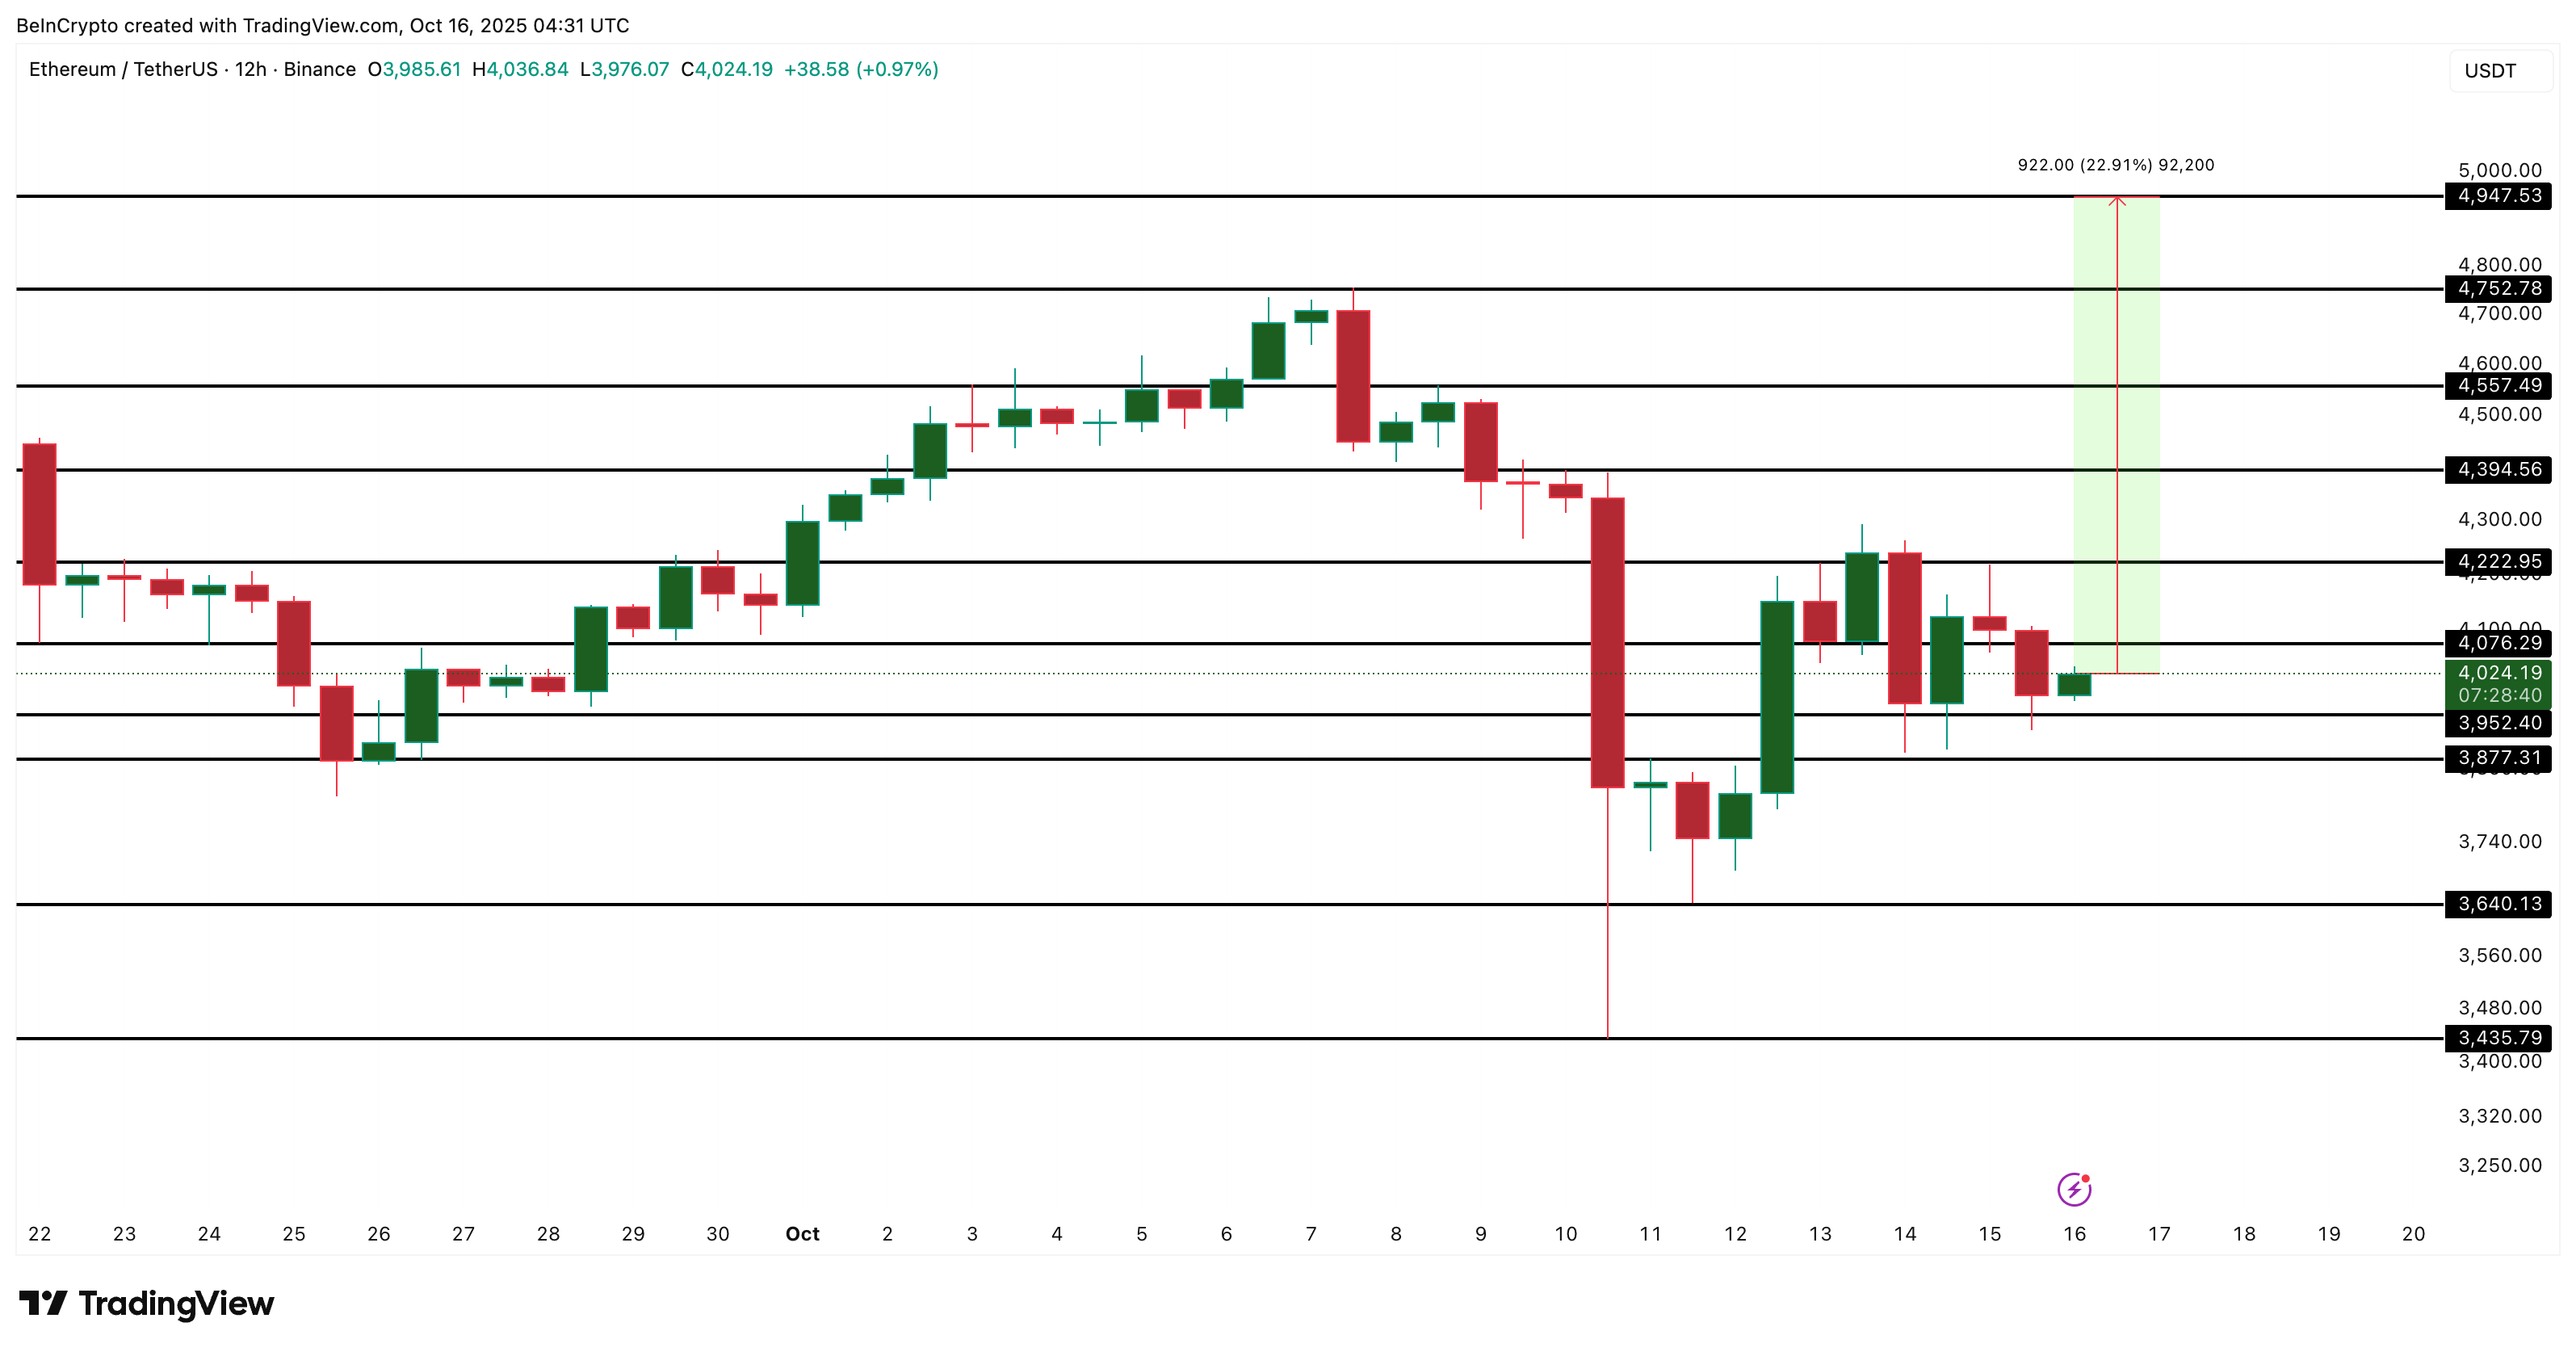
Technically, Ethereum faces immediate resistance around $4,076, with higher targets at $4,222 and $4,557 if the breakout holds. A clean 12-hour close above $4,076 could confirm the strength of the bullish signal. That would also open the path toward $4,752 and $4,947 (all-time high zone).
On the downside, Ethereum has key support near $3,952 and $3,877. Losing these levels could drag the price toward $3,640, invalidating the bullish trend.
Overall, Ethereum’s setup now combines three bullish elements. These include a strong momentum signal (RSI divergence), whale accumulation, and a sharp rise in exchange outflows.
If this structure holds and the price breaks past $4,076 and $4,222, ETH could once again be repeating the same bullish recovery that started in March — one that turned a fading downtrend into a multi-week rally.
