
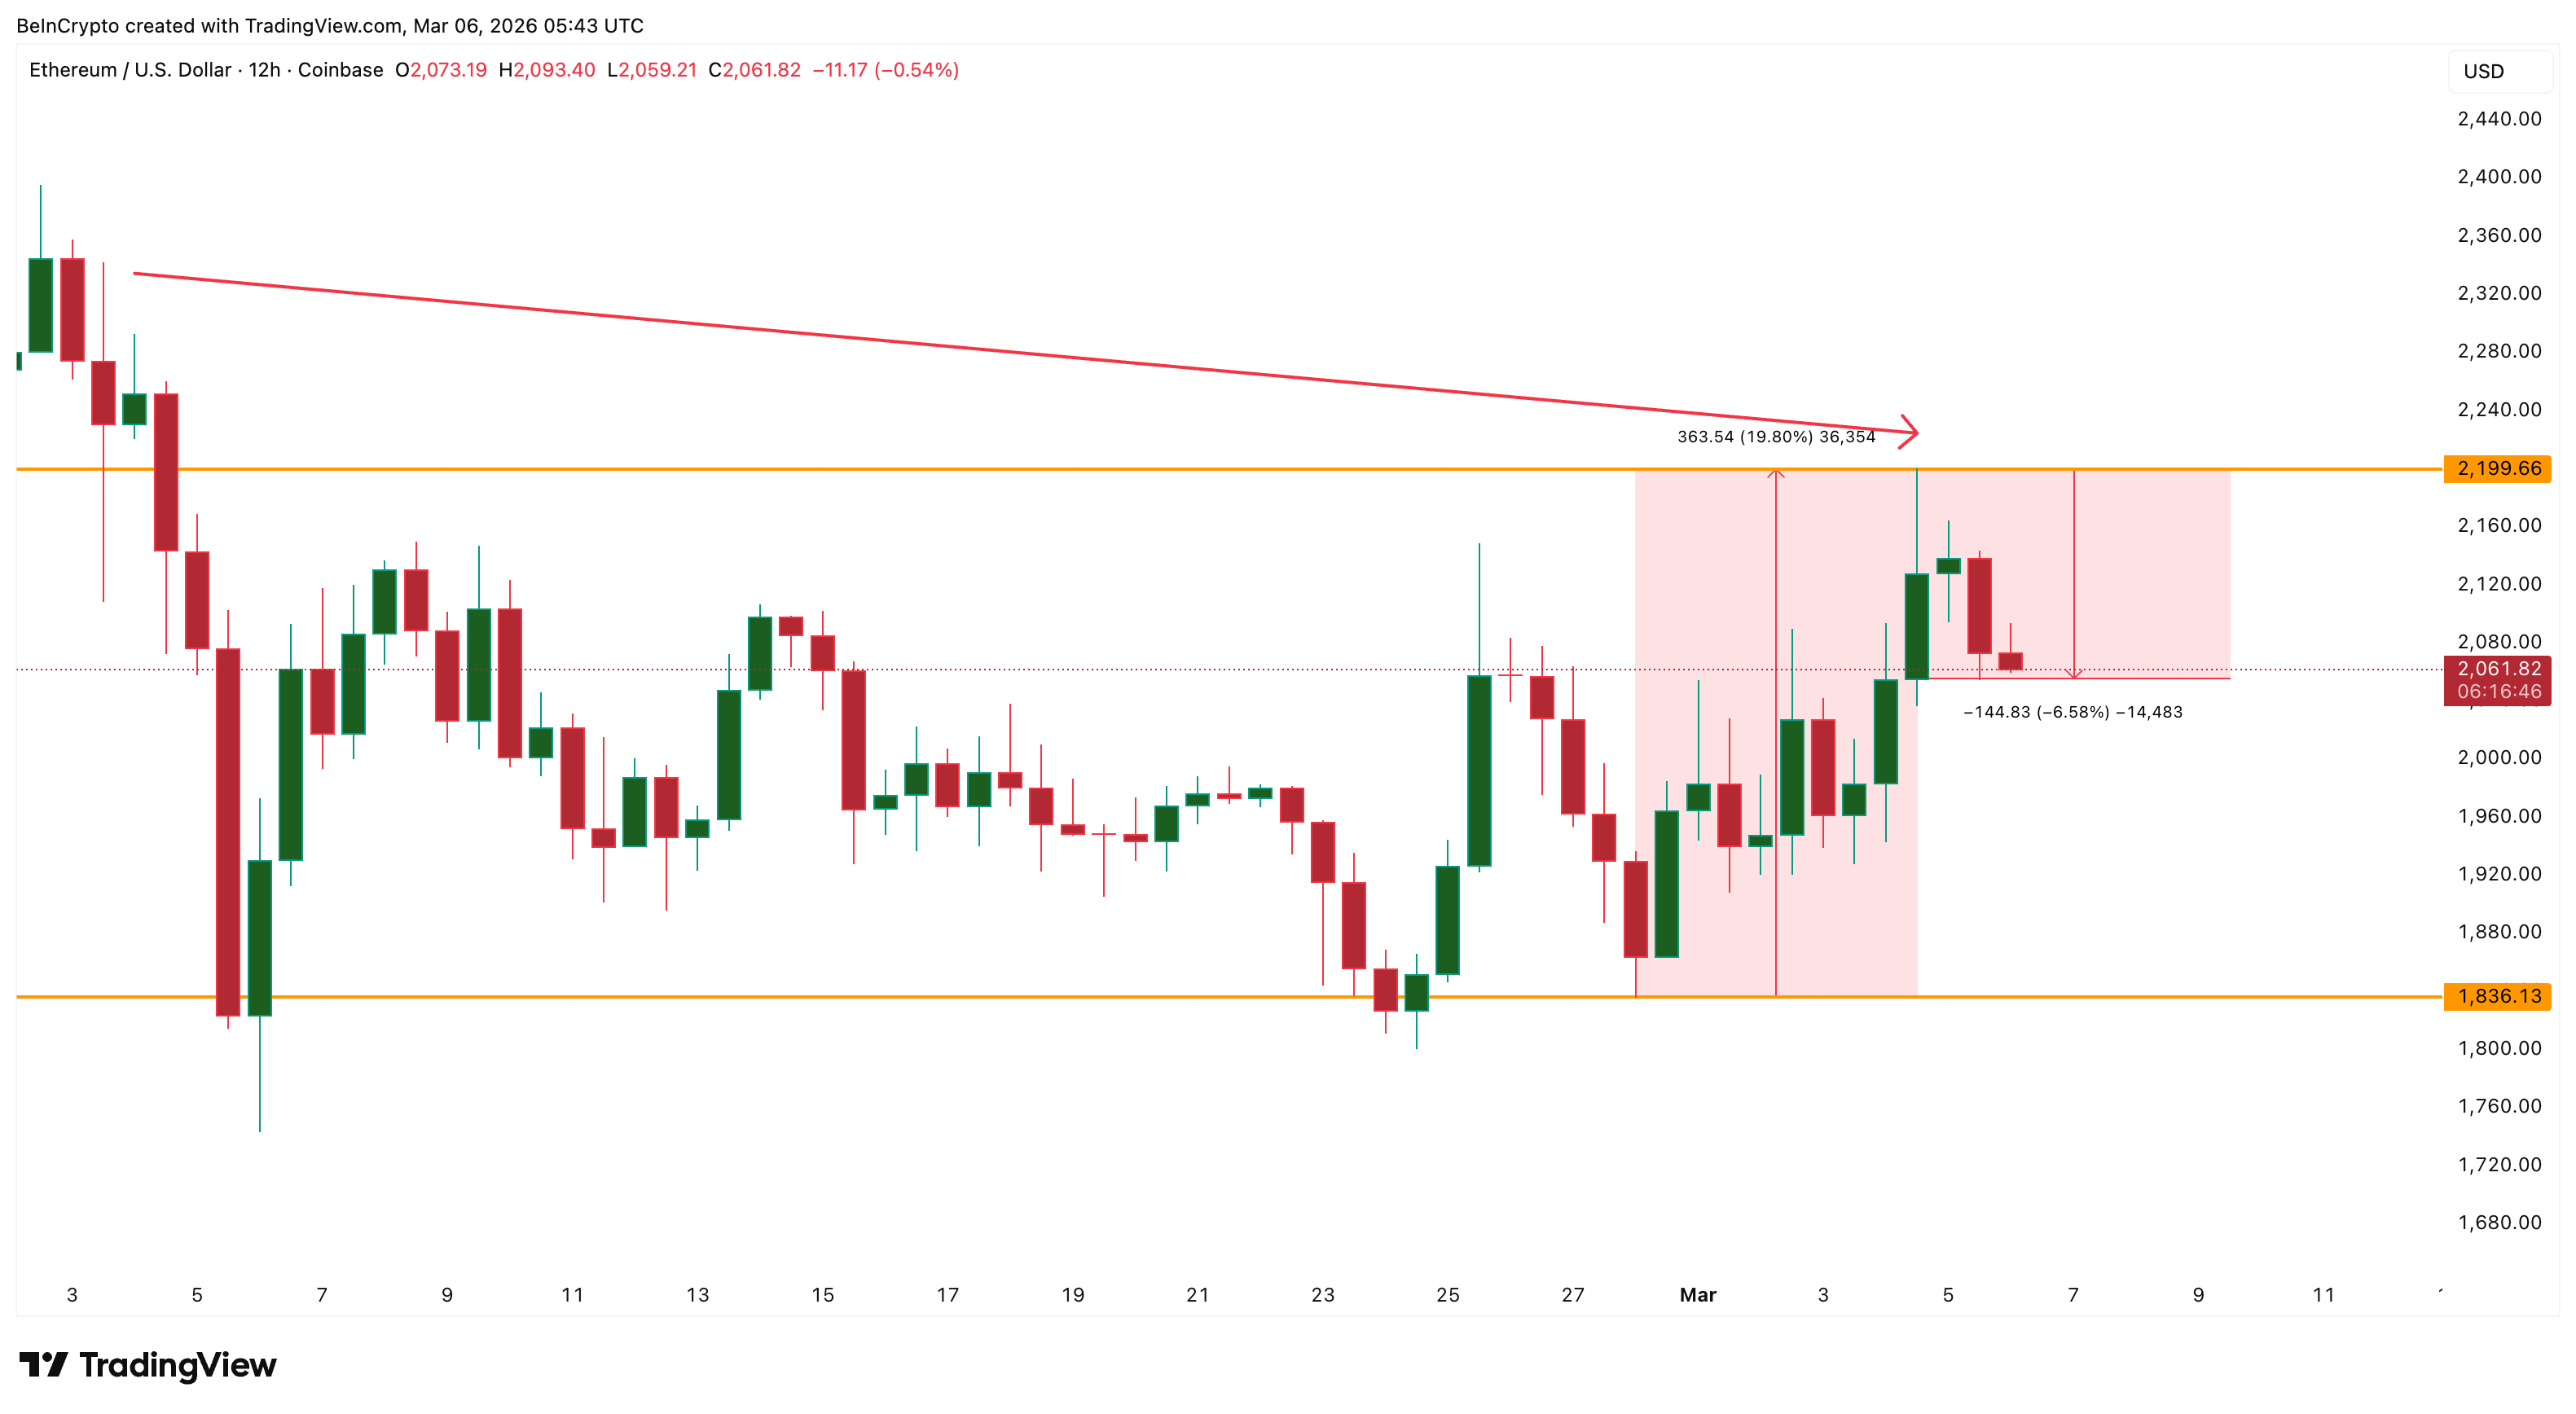
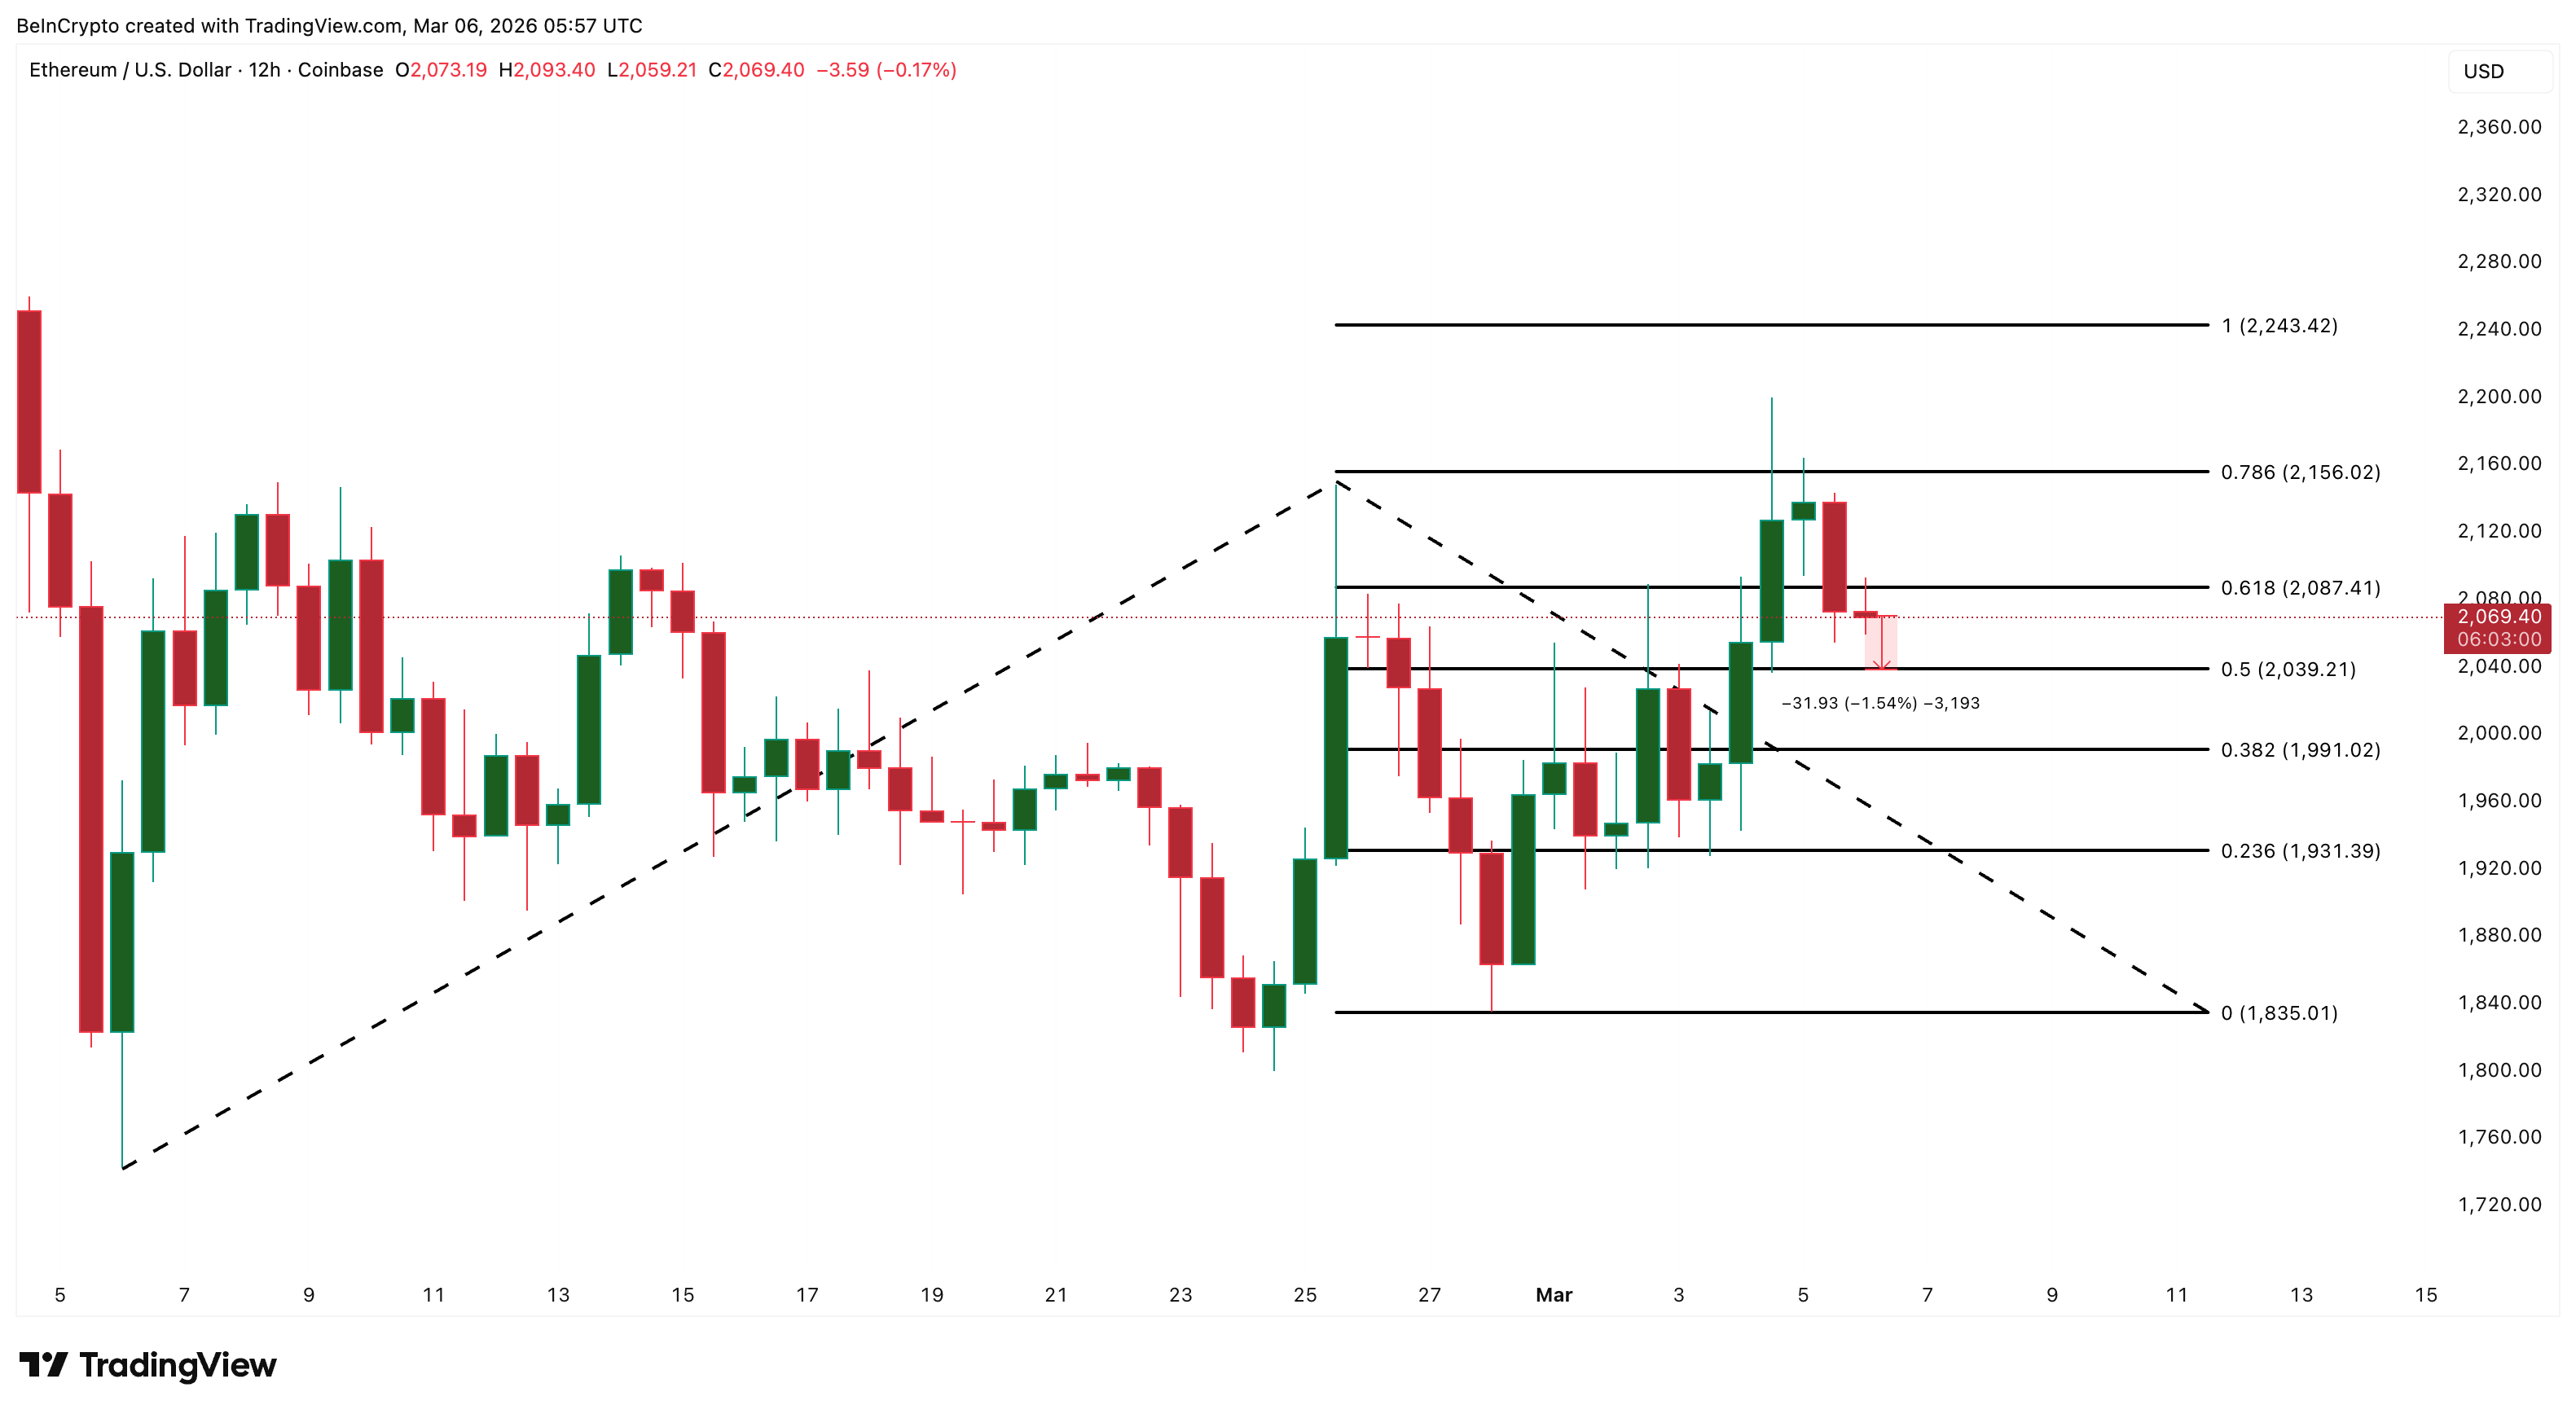
Ethereum price has stabilized after a volatile two-week move. The move saw the asset rally sharply before giving back part of those gains. ETH climbed nearly 20% from its February 28 low near $1,830 to almost $2,200. Yet, the rally has since cooled, leaving the asset trading close to $2,060 with only about 1% gains in the last 24 hours.
The pullback followed a bearish technical signal that historically precedes deeper declines. Yet despite that warning, several market participants appear to be positioning for the opposite outcome. Whale wallets are accumulating, long-term holders are increasing exposure, and derivatives traders remain heavily long. All three groups appear to be defending the same level: $2,030.
Hidden Bearish Divergence Tracker Signals Possible Ethereum Drop
The first warning sign comes from a hidden bearish divergence that appeared on Ethereum’s 12-hour chart. A hidden bearish divergence forms when price creates a lower high while the Relative Strength Index (RSI) forms a higher high. This pattern typically signals trend continuation to the downside, suggesting that sellers may still control the broader structure even after a rally.
Want more token insights like this? Sign up for Editor Harsh Notariya’s Daily Crypto Newsletter here.
The signal was detected by BeInCrypto’s exclusive Hidden Bear Div Tracker, an AI-powered dashboard designed to identify such divergences across crypto charts. The indicator is designed to detect hidden bearish divergences in the near-term trading timeframe.
Previous signals recorded by the tracker produced declines of over 5%, 9%, 14%, and 7%.
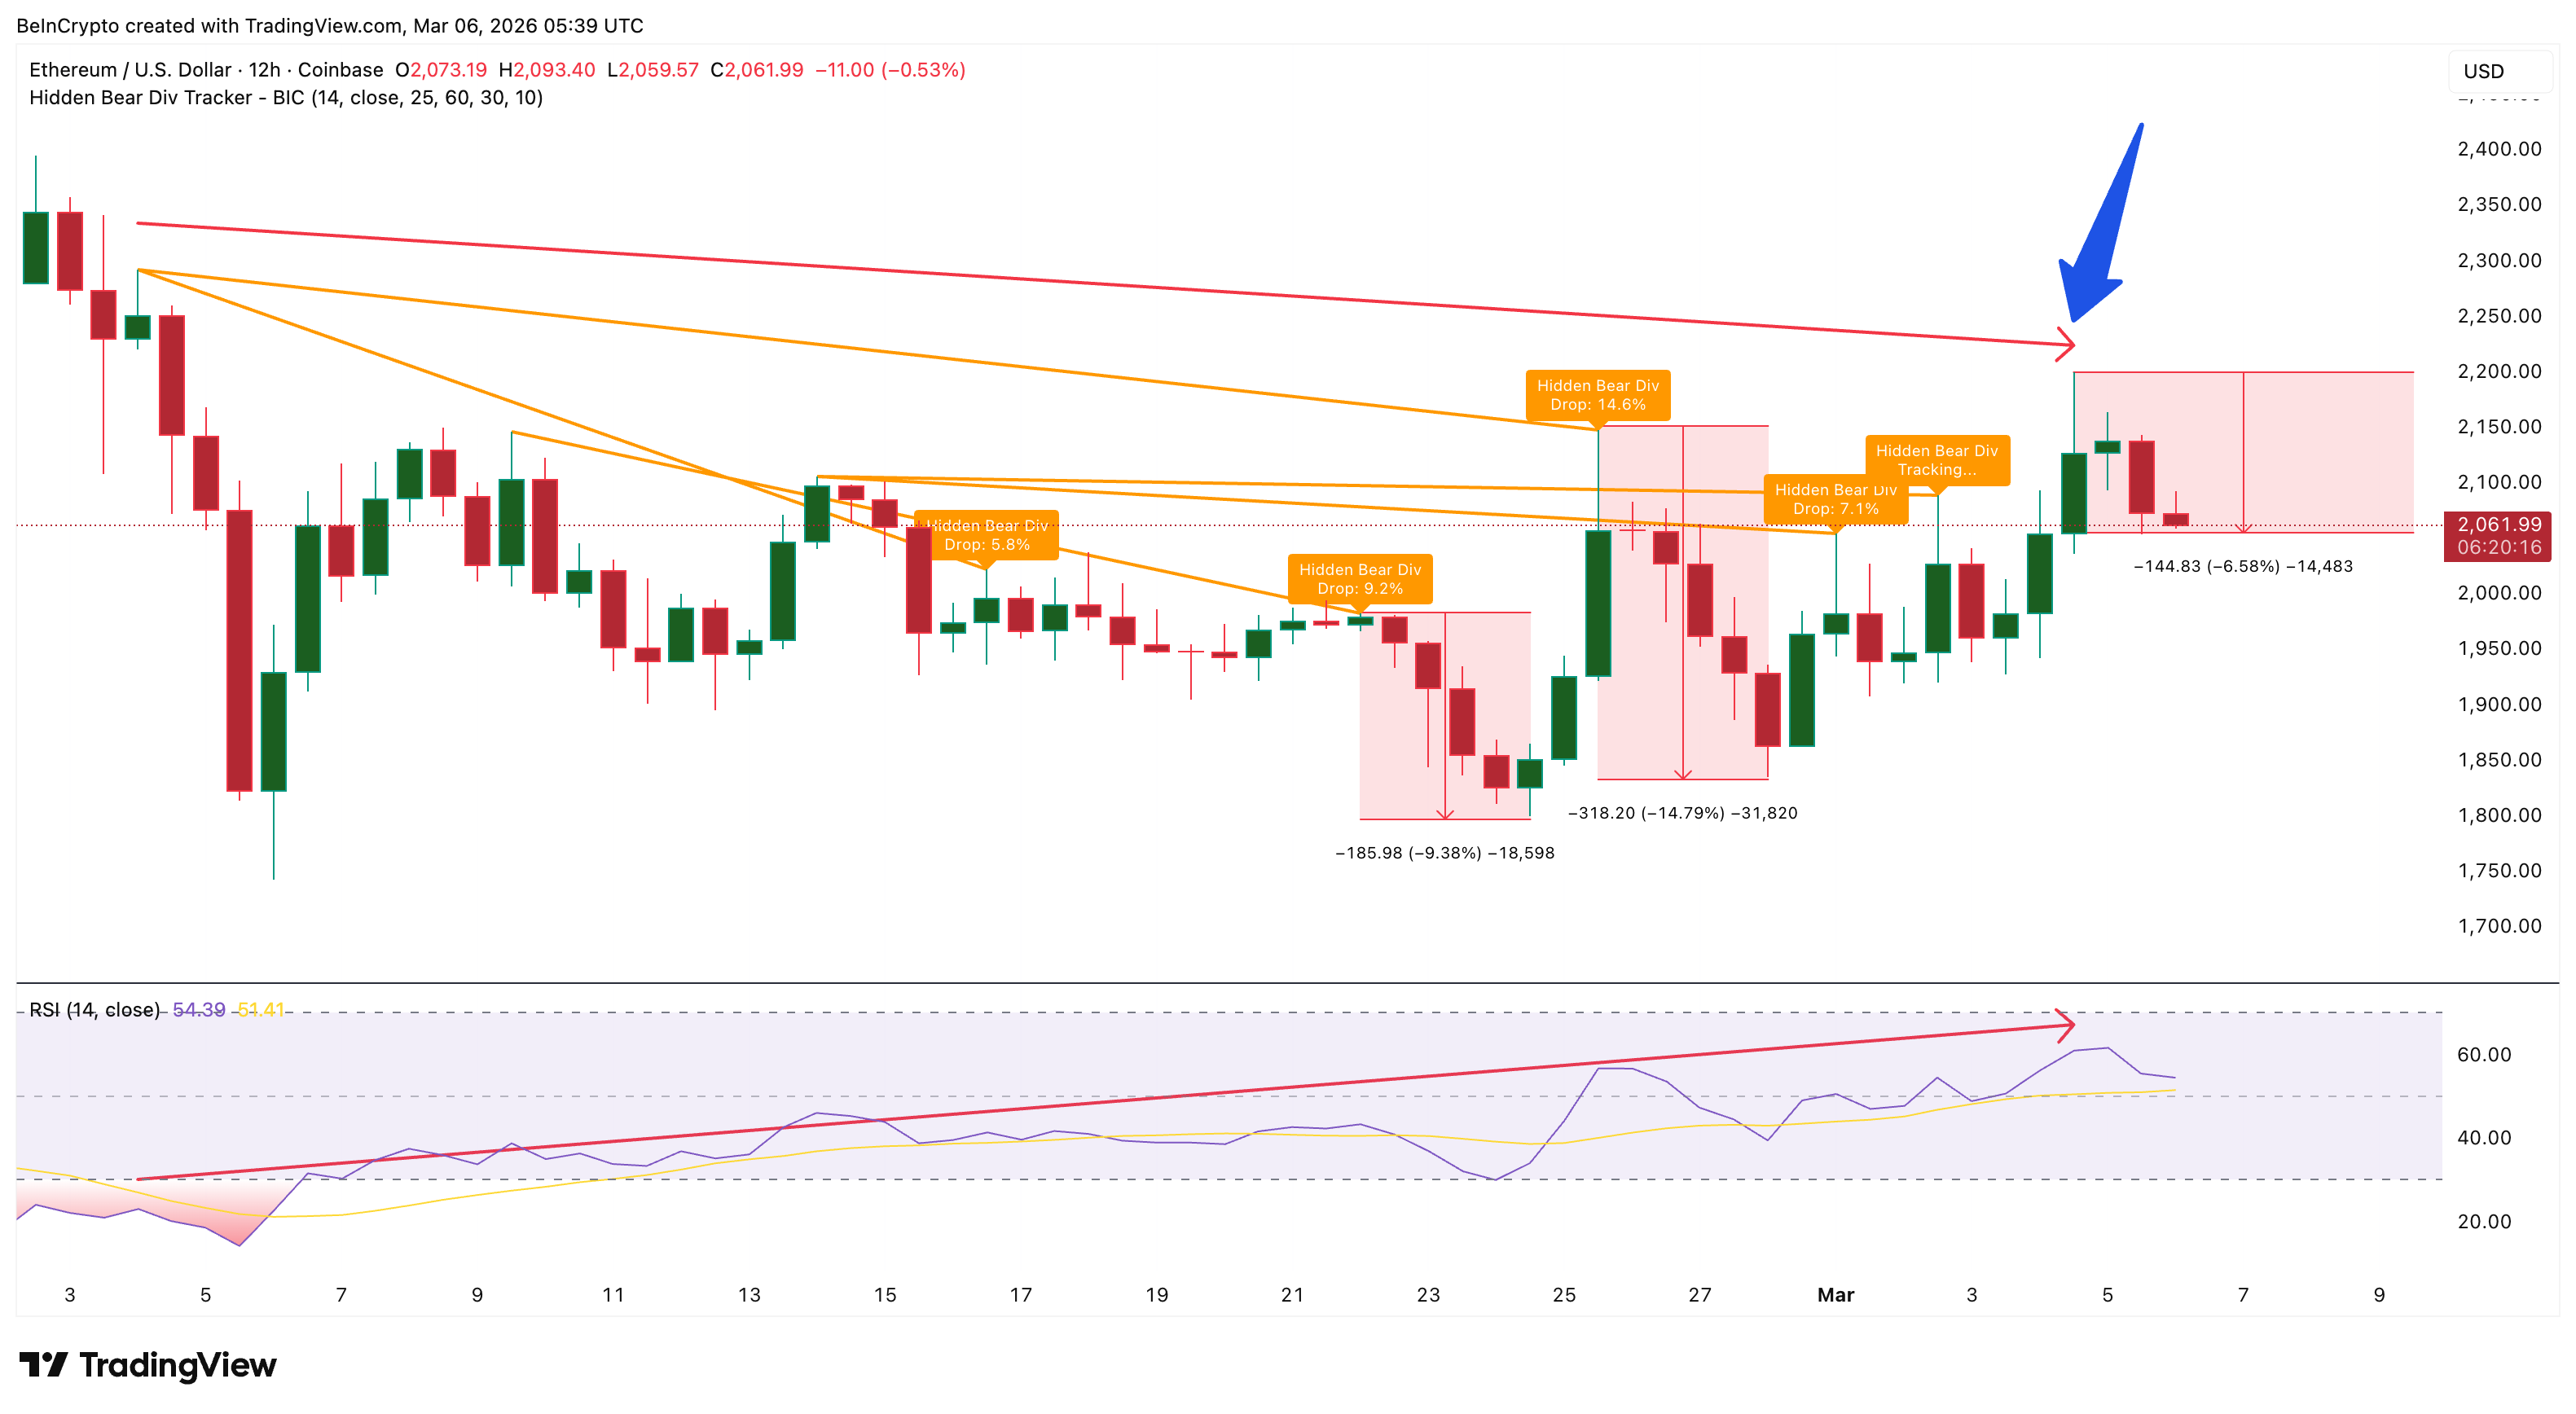
Since the divergence appeared — although the indicator has not yet tagged a full correction base — Ethereum has already declined about 6.58% from its recent high.
That drop places the move at the lower end of the historical range, which stretches to roughly 14%.
In other words, if historical patterns repeat, the current decline may not yet be complete. But another dataset suggests the downside could be limited.
The $2,030 Supply Cluster Is the Core of Market Optimism
On-chain data shows that $2,030 is one of Ethereum’s strongest cost-basis clusters. This helps explain why buyers continue to defend the level.
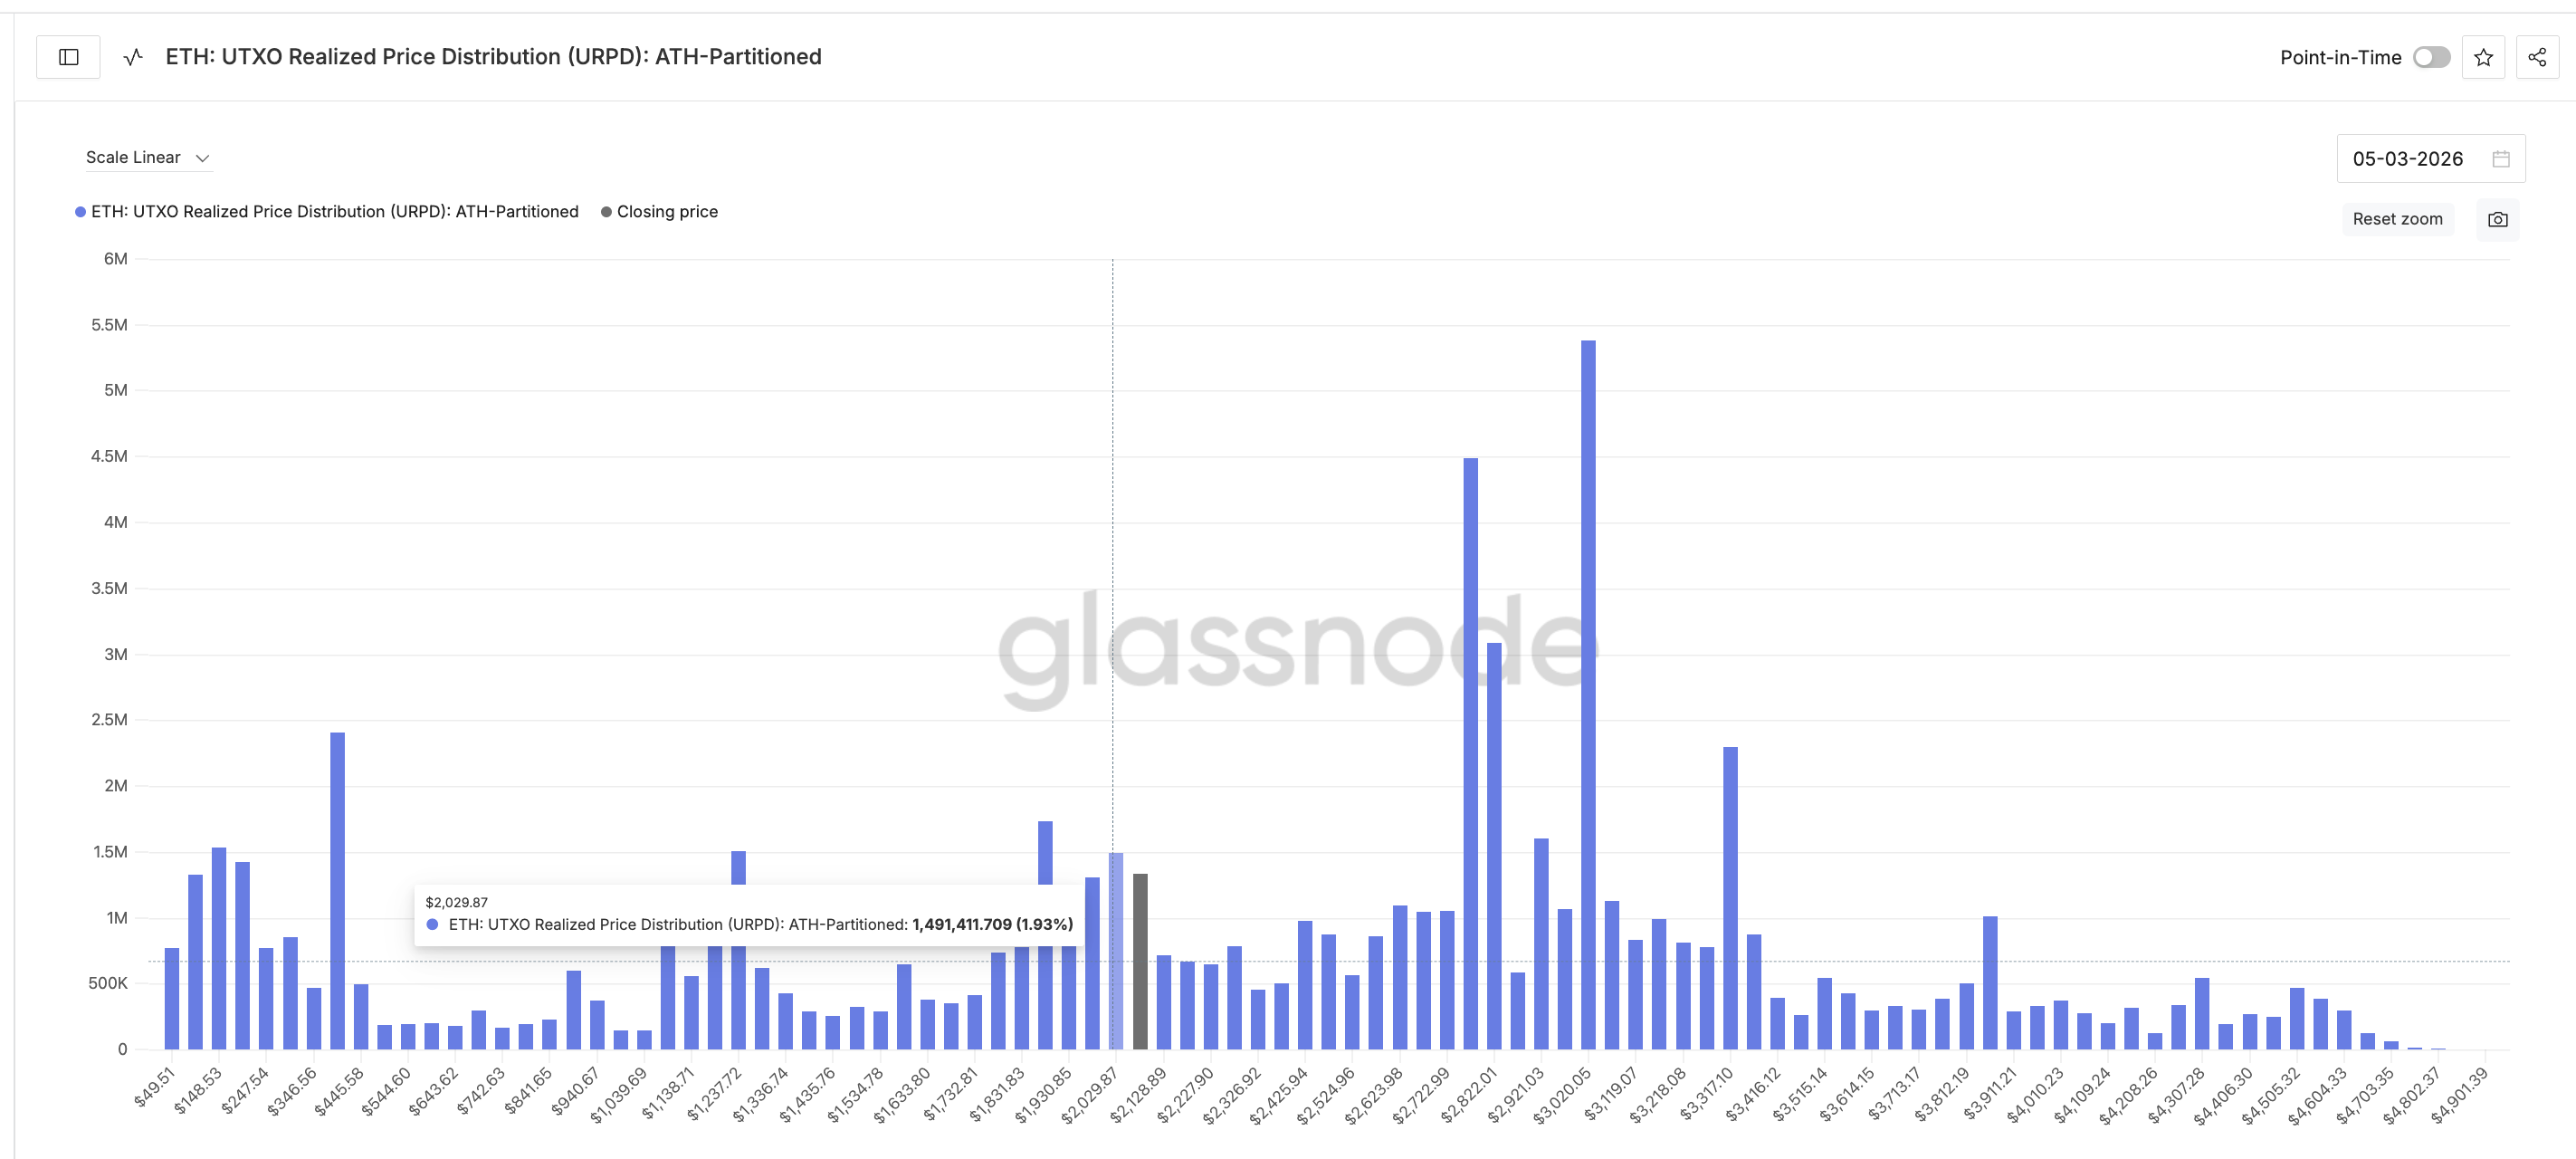
This insight comes from the UTXO Realized Price Distribution (URPD) model. While originally developed for UTXO-based blockchains, the method can also be applied to Ethereum to estimate where large portions of the circulating supply last moved on-chain.
These zones often behave as support or resistance. More so, as investors who bought near those prices tend to defend their cost basis. Current URPD data highlights several key clusters:
The strongest sits near $2,030, where roughly 1.93% of Ethereum’s supply was last transacted. Another cluster exists near $1,980 with about 1.68% of supply. However, an even larger zone appears near $1,880, holding roughly 2.24%. That could work like a strong support if price conviction remains.
Because Ethereum’s price remains above the $2,030 cluster, many market participants appear to believe that this cost-basis zone will hold as support. That belief is visible in how different groups are positioning.
Whales, Hodlers, and Derivatives Traders Are All Betting on $2,030
Despite the bearish divergence signal, three major market cohorts are showing bullish positioning around the same level.
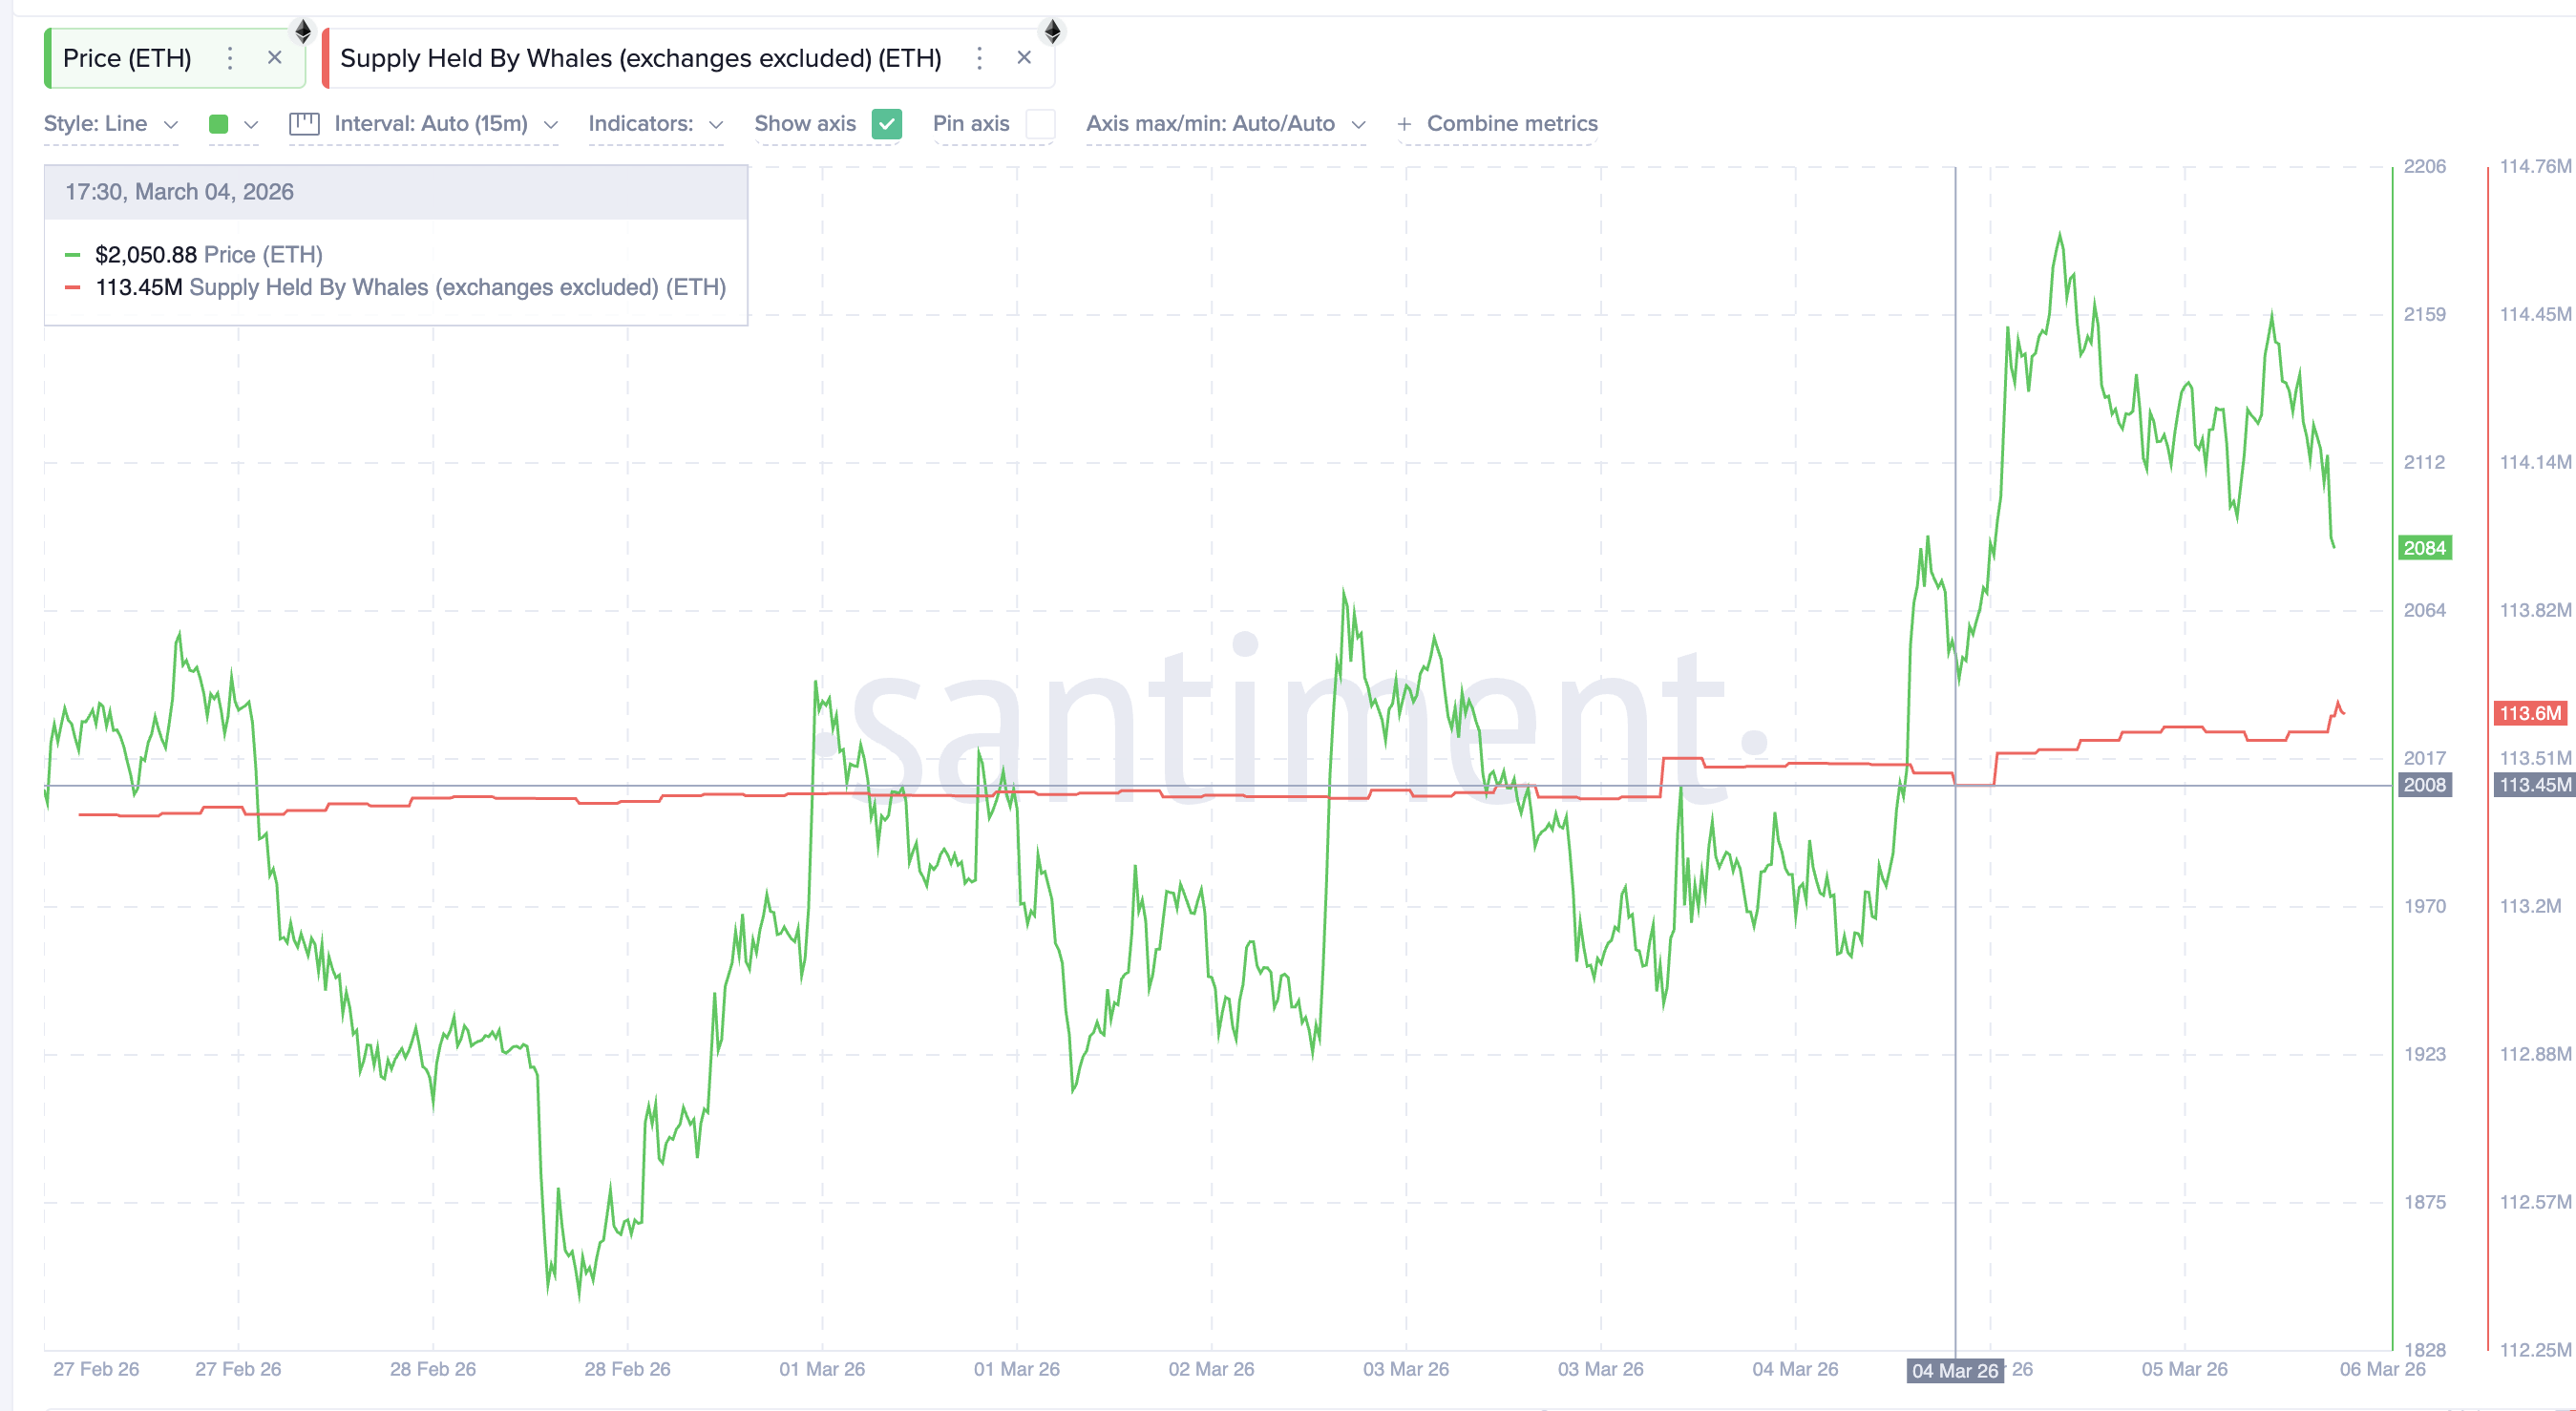
First, whales have increased their holdings during the pullback. Large Ethereum wallets raised their balances from 113.45 million ETH to roughly 113.6 million ETH on March 4 (when divergence flashed), suggesting accumulation near the support zone.
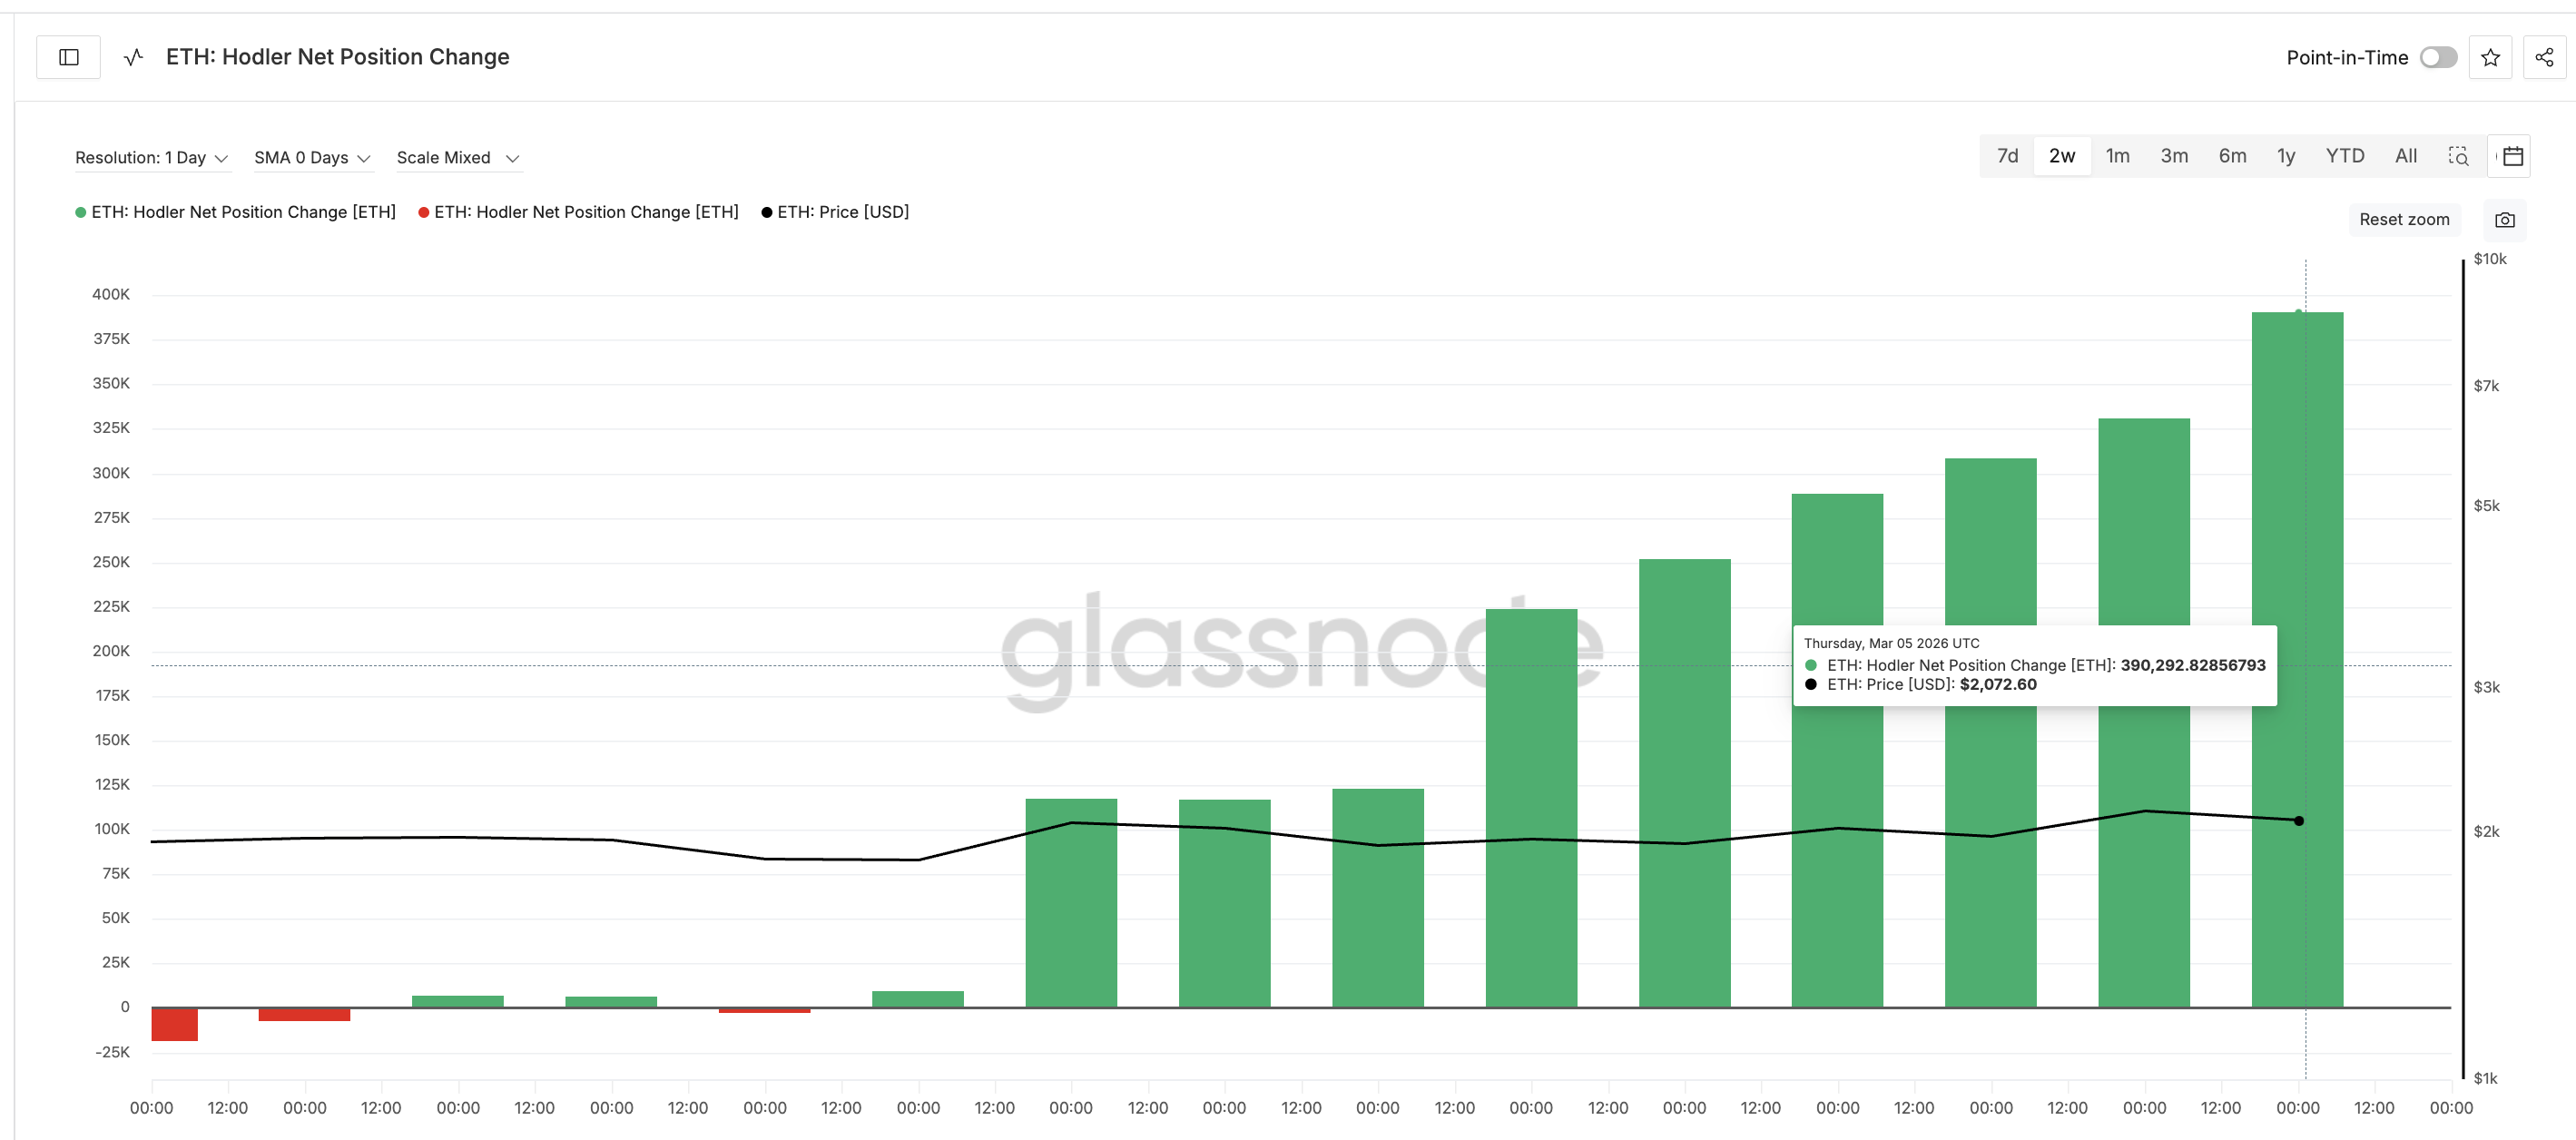
Second, long-term holders are also adding exposure. The Hodler Net Position Change, which measures the 30-day rolling accumulation of mid-to-long-term investors, has surged significantly. The metric rose over 4,000% from just 9,454 ETH on February 24 to around 390,292 ETH by March 5, showing sustained accumulation even after the bearish divergence appeared.
Finally, derivatives traders are heavily positioned on the long side. Data from the Binance ETH/USDT liquidation map shows roughly $1.07 billion in long leverage compared with only about $357 million in short positions.
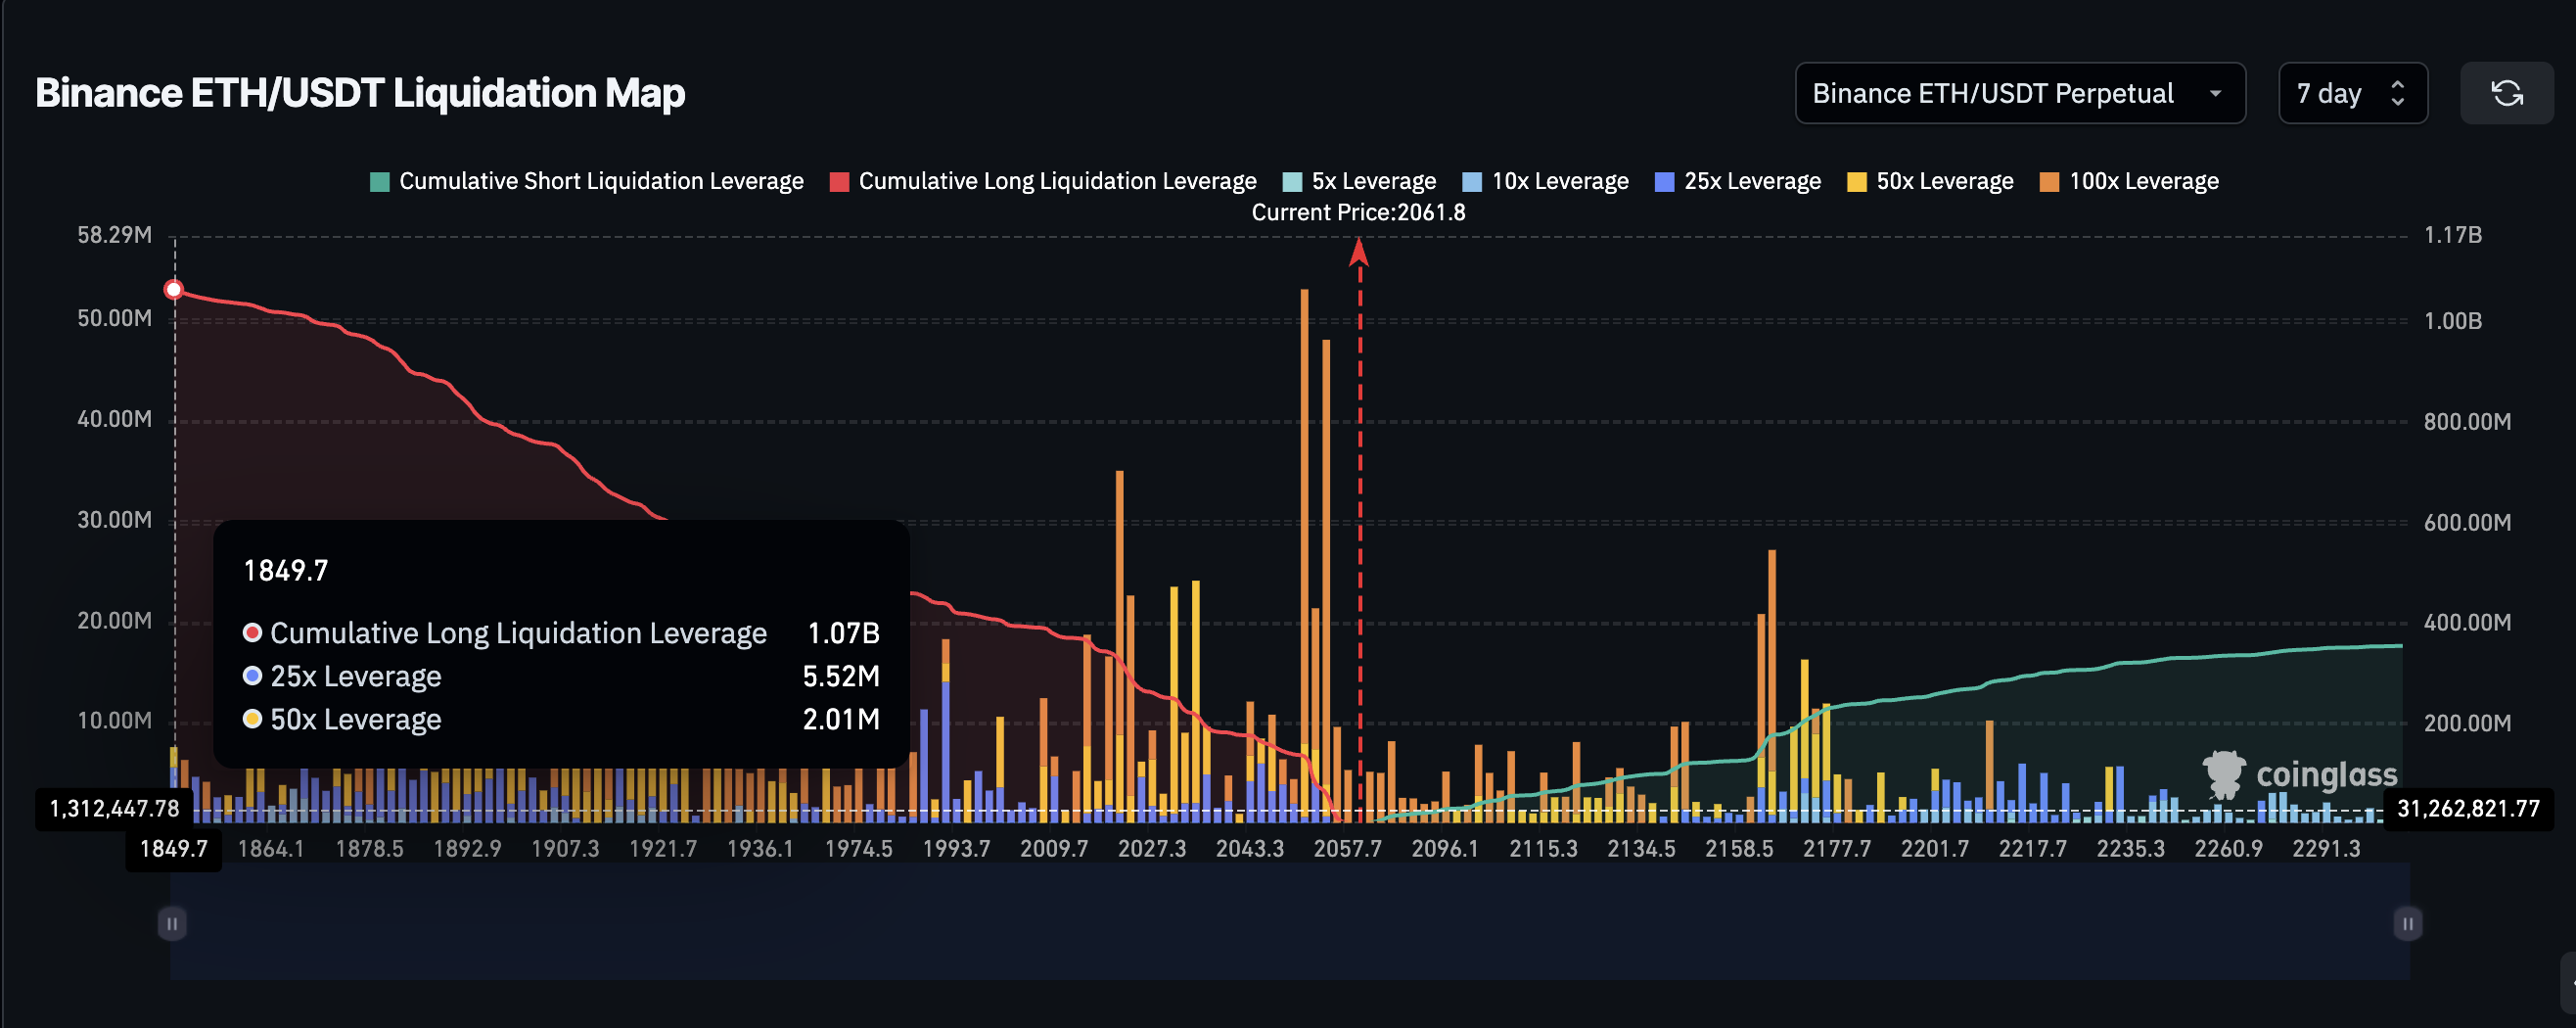
A sizable part of this leverage is sitting near the $2,030 region, meaning many traders are effectively defending the same level that whales and long-term holders appear to be buying. However, that positioning also creates a potential vulnerability.
Ethereum Price Levels: Why $2,030 Is the Deciding Level
The concentration of supply, accumulation, and leverage around $2,030 makes it one of the most important short-term levels for Ethereum.
Roughly $252 million worth of leveraged long positions sit near the $2,030 zone. Because liquidations occur when prices cross a level rather than when a candle closes, even a brief dip into this region could trigger forced selling.
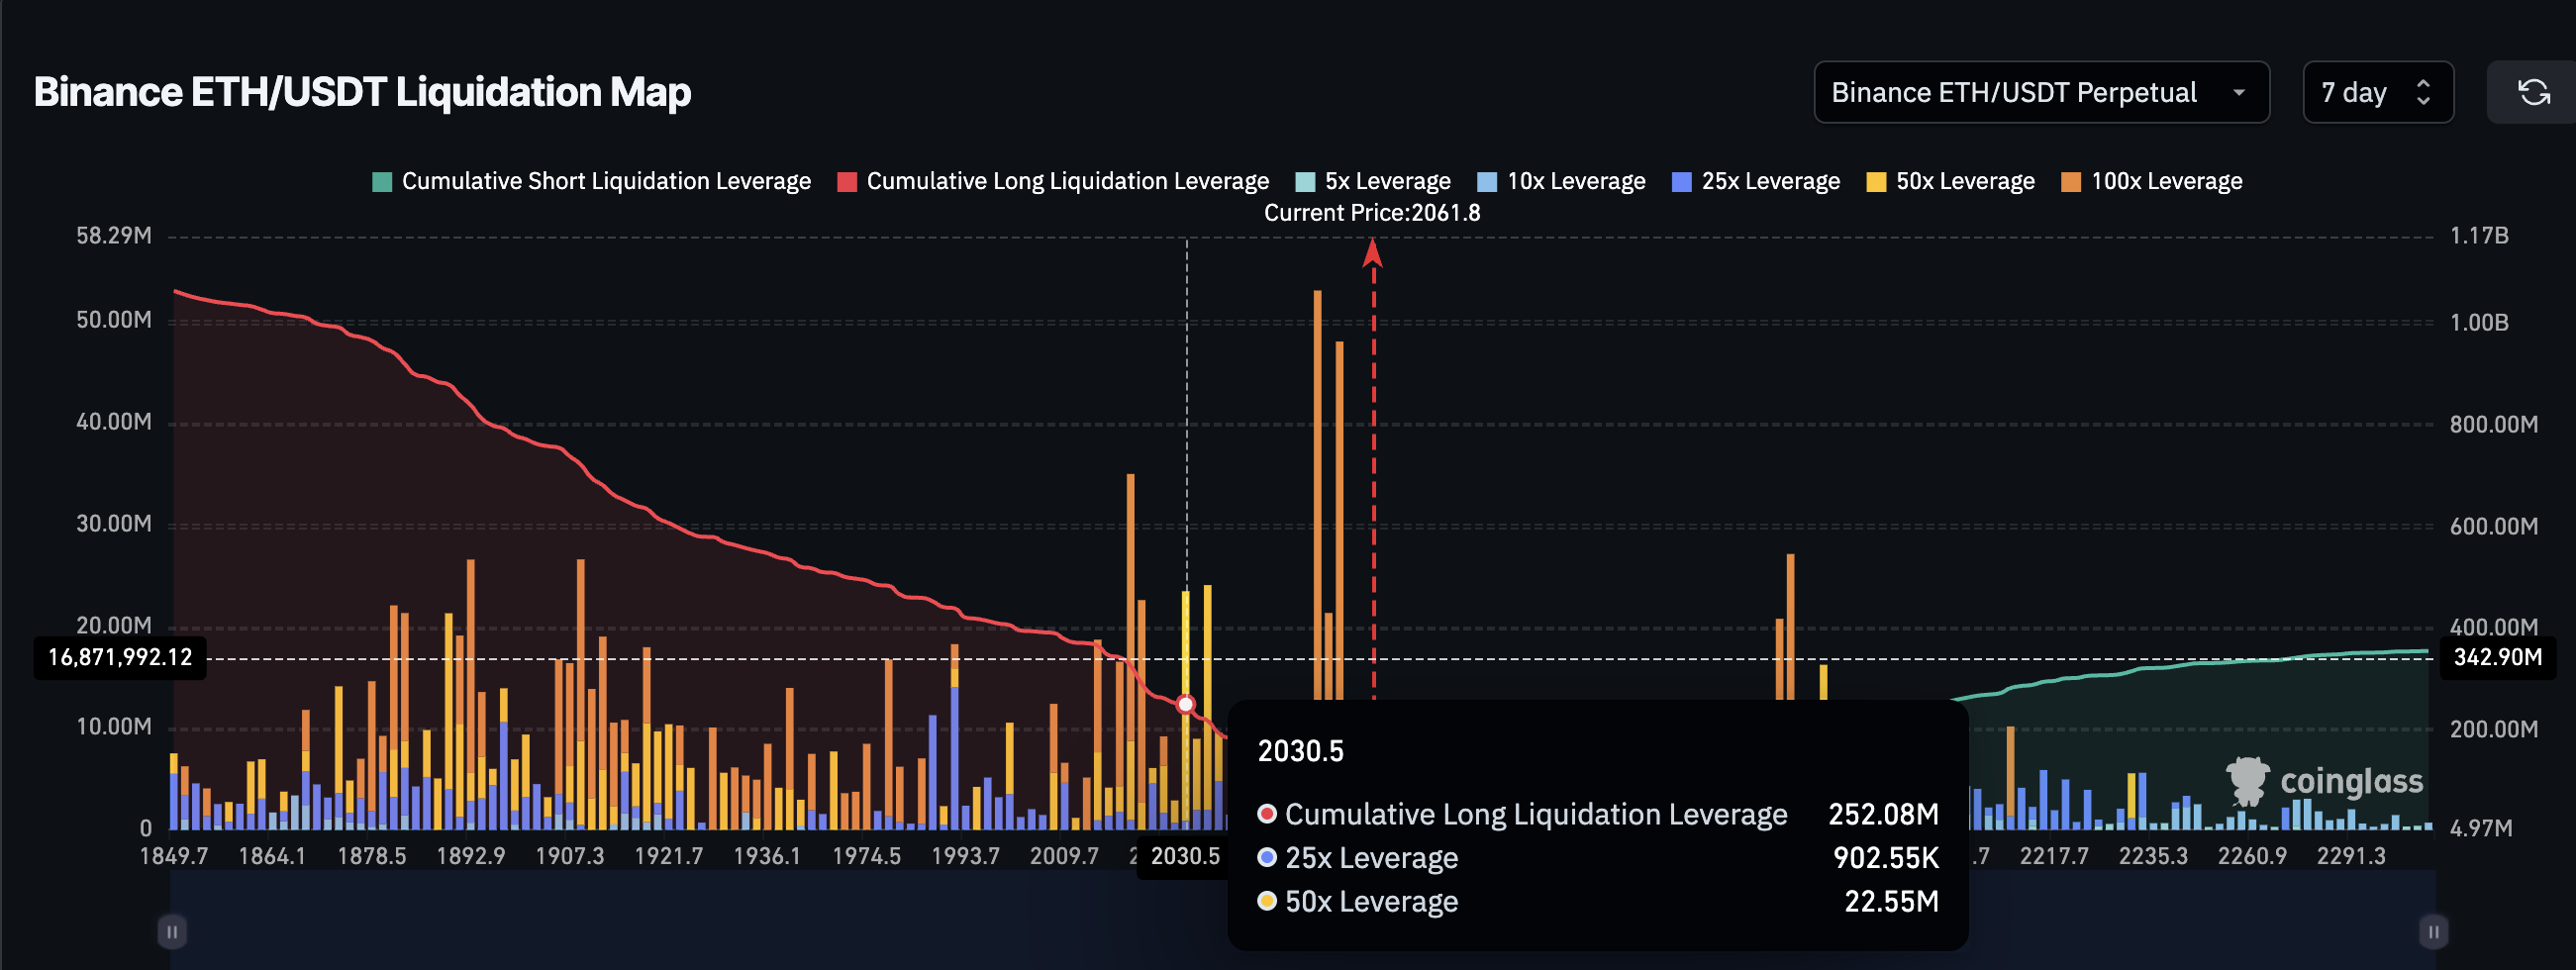
If Ethereum breaks below $2,030, cascading liquidations could accelerate a drop toward $1,990. That could push the price to the next strong cost-basis support near $1,880.
On the upside, Ethereum needs to reclaim $2,080 and then $2,150 to restore bullish momentum. Clearing those levels could open the path toward $2,240 and potentially revive the rally structure.
For now, Ethereum sits in a delicate balance. A bearish technical signal suggests further downside is possible. Yet whales, long-term holders, and leveraged traders appear to be betting that the $2,030 support cluster will hold. The next move may depend on whether that collective optimism proves correct.
