


Key Highlights For March 7, 2019
- The price of Ethereum (ETH) started an upward move on Mar 5.
- It has continued to make higher highs since.
- It is trading in a parallel channel.
- There is significant bearish divergence developing in the MACD and the RSI.
- There is resistance near $144 and $152.
- There is support near $136.
Higher Highs
The price of ETH on Bitfinex is analyzed on 30-minute intervals from Mar 5 to Mar 7.
The price of ETH started an upward move on Mar 5. It reached a high of $141. It has made successive higher highs since. Tracing these highs gives us an ascending resistance line.
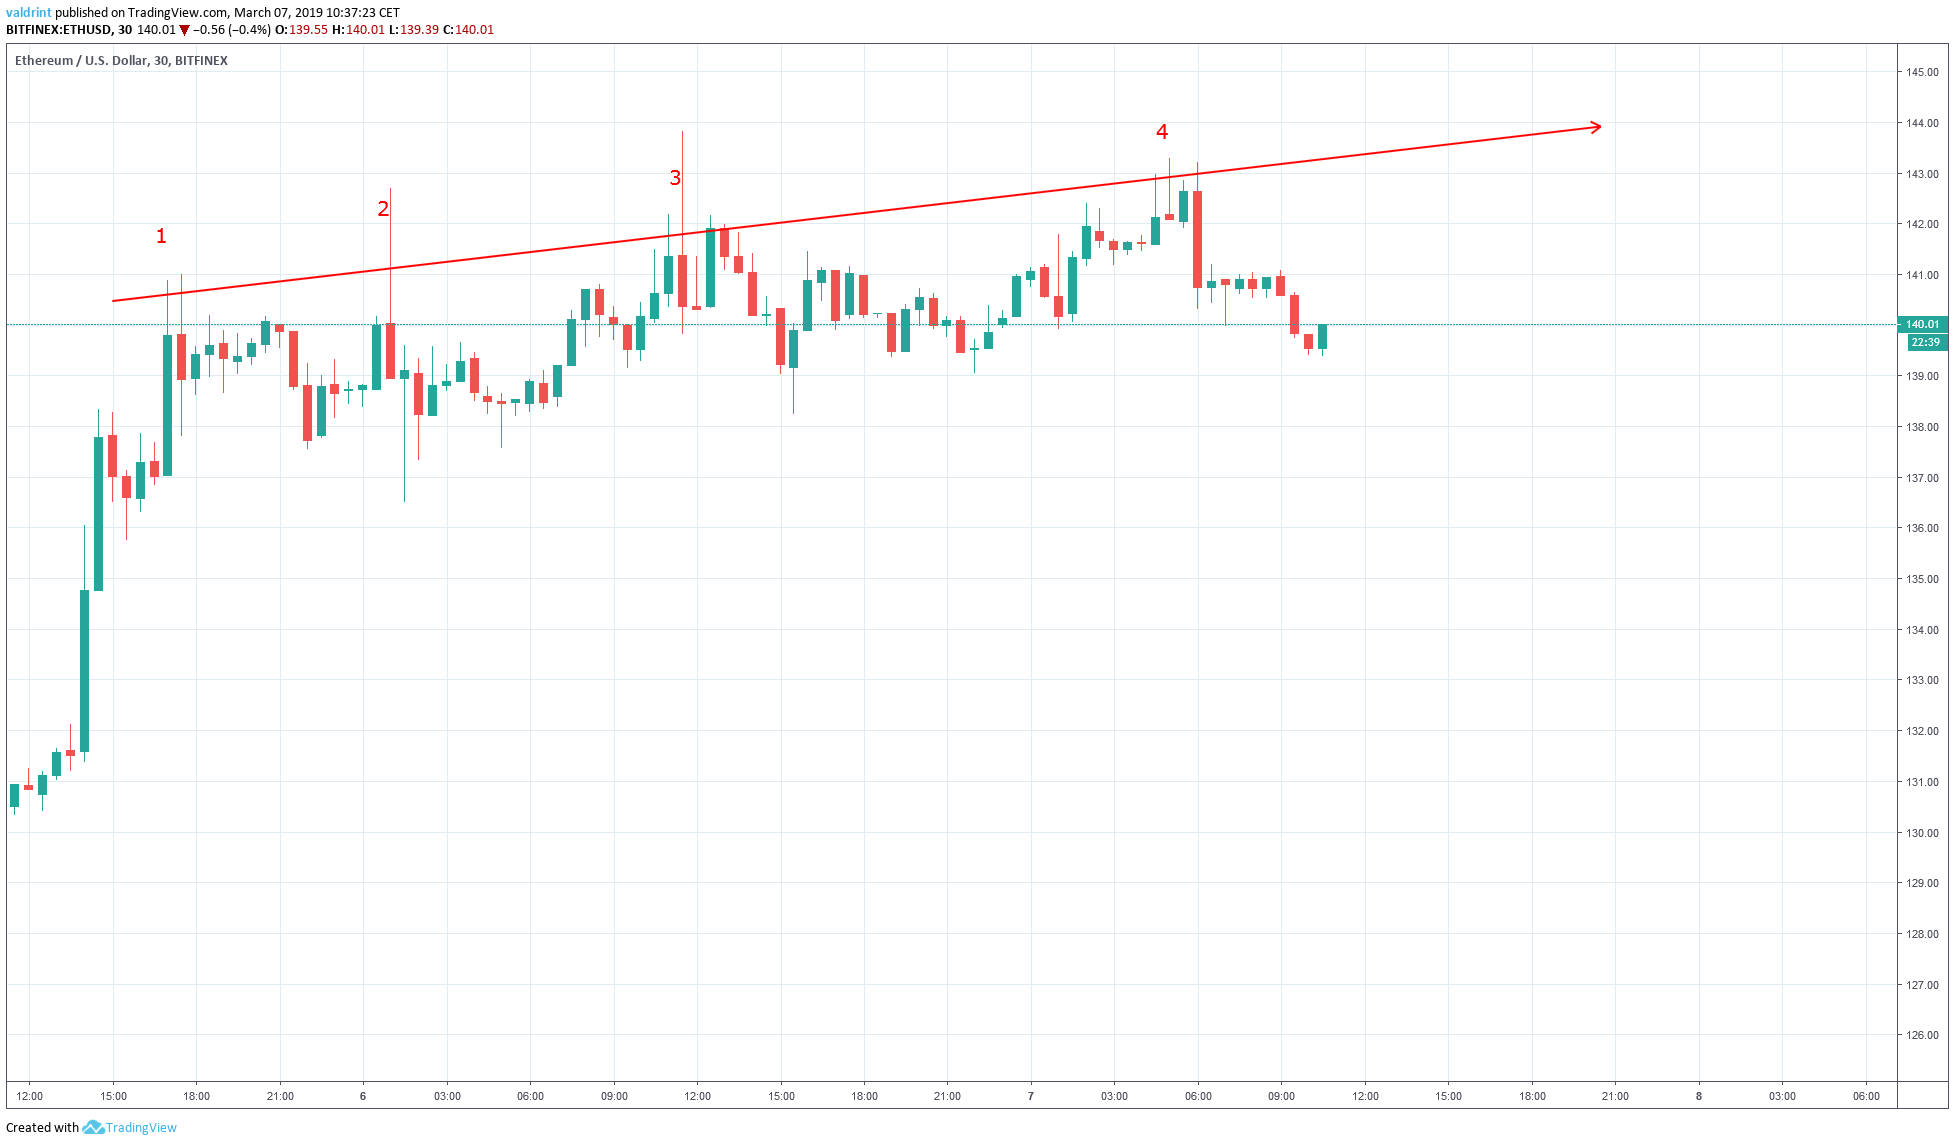
- March 5
- March 6 (twice)
- March 7
The resistance line can act as a ceiling to price. Theoretically, it should prevent it from breaking further upward. However, a breakout above it could lead to rapid price increases.
The breakout above the line by a wick in a volatile market is relatively unimportant as long as it is not succeeded by continued breakouts. In the case of ETH, 30-minute highs rarely broke above the resistance and were not supported by maintained gains.
Rapid price increases for Ethereum do not appear forthcoming—especially with recent price drops on Mar 7.
Parallel Channel
After the Mar 5 high, the price retraced to $135.76. It has created higher lows since. Tracing these lows creates the ascending support line.
The support line acts as a floor, preventing the price from breaking down below that level—just as the resistance line acts as a ceiling.
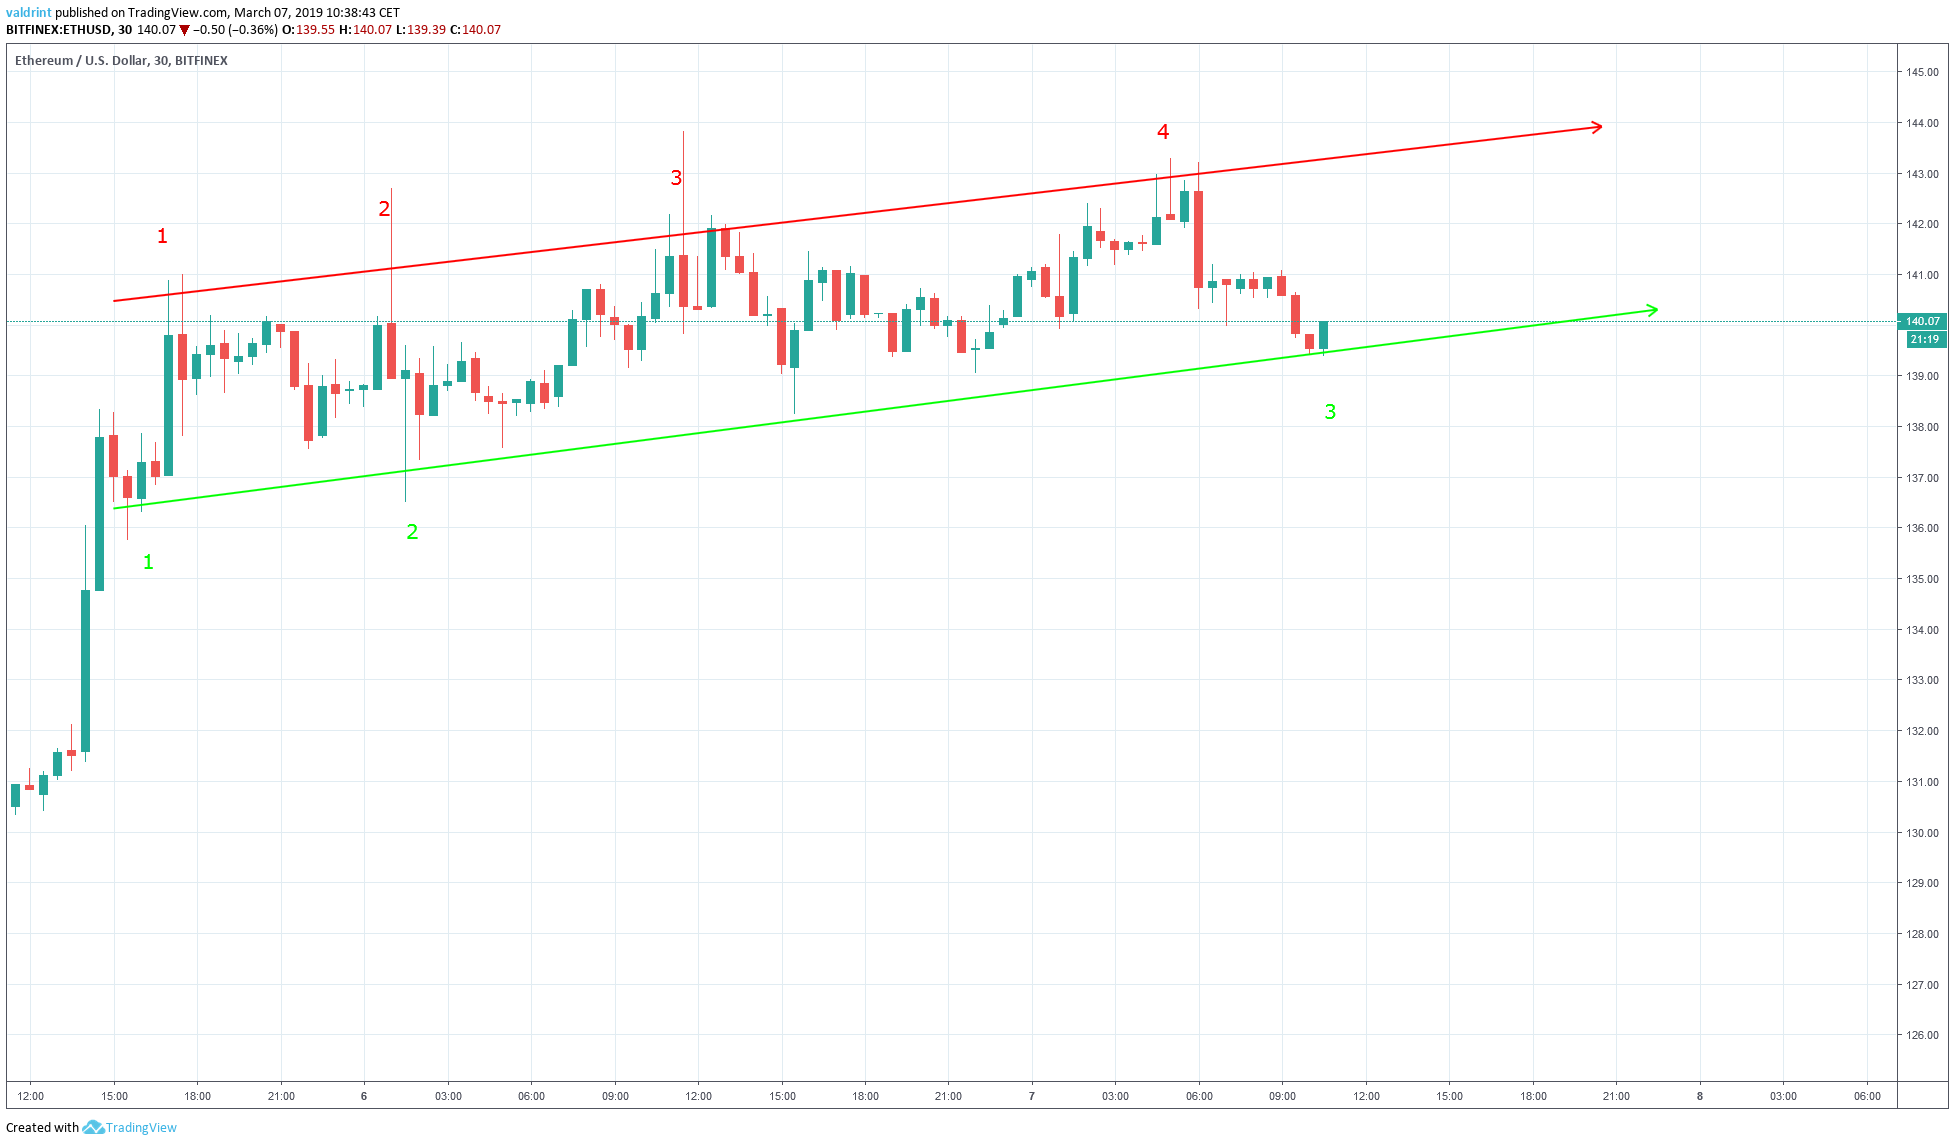
- Mar 5
- Mar 6
- Mar 7
The support and resistance lines combine to create a parallel channel. If the price moves outside this channel for a significant period of time, new resistance and support lines may develop.
Initially, the price decreased at a slower rate than predicted by the support line, but it reverted back to the mean on the 3rd touch.
Looking Out For a Breakdown
The moving average convergence divergence (MACD) is a trend indicator that shows the relationship between two moving averages (long and short-term) and the price. It is used to measure the strength of a move.
The relative strength index (RSI) is an indicator which calculates the size of the changes in price in order to determine oversold or overbought conditions in the market.
Combining MACD and RSI bullish/bearish divergence with support/resistance essentially predicts price fluctuations. If both indicators are in agreement, they can be used to further add validity to the divergence analysis.
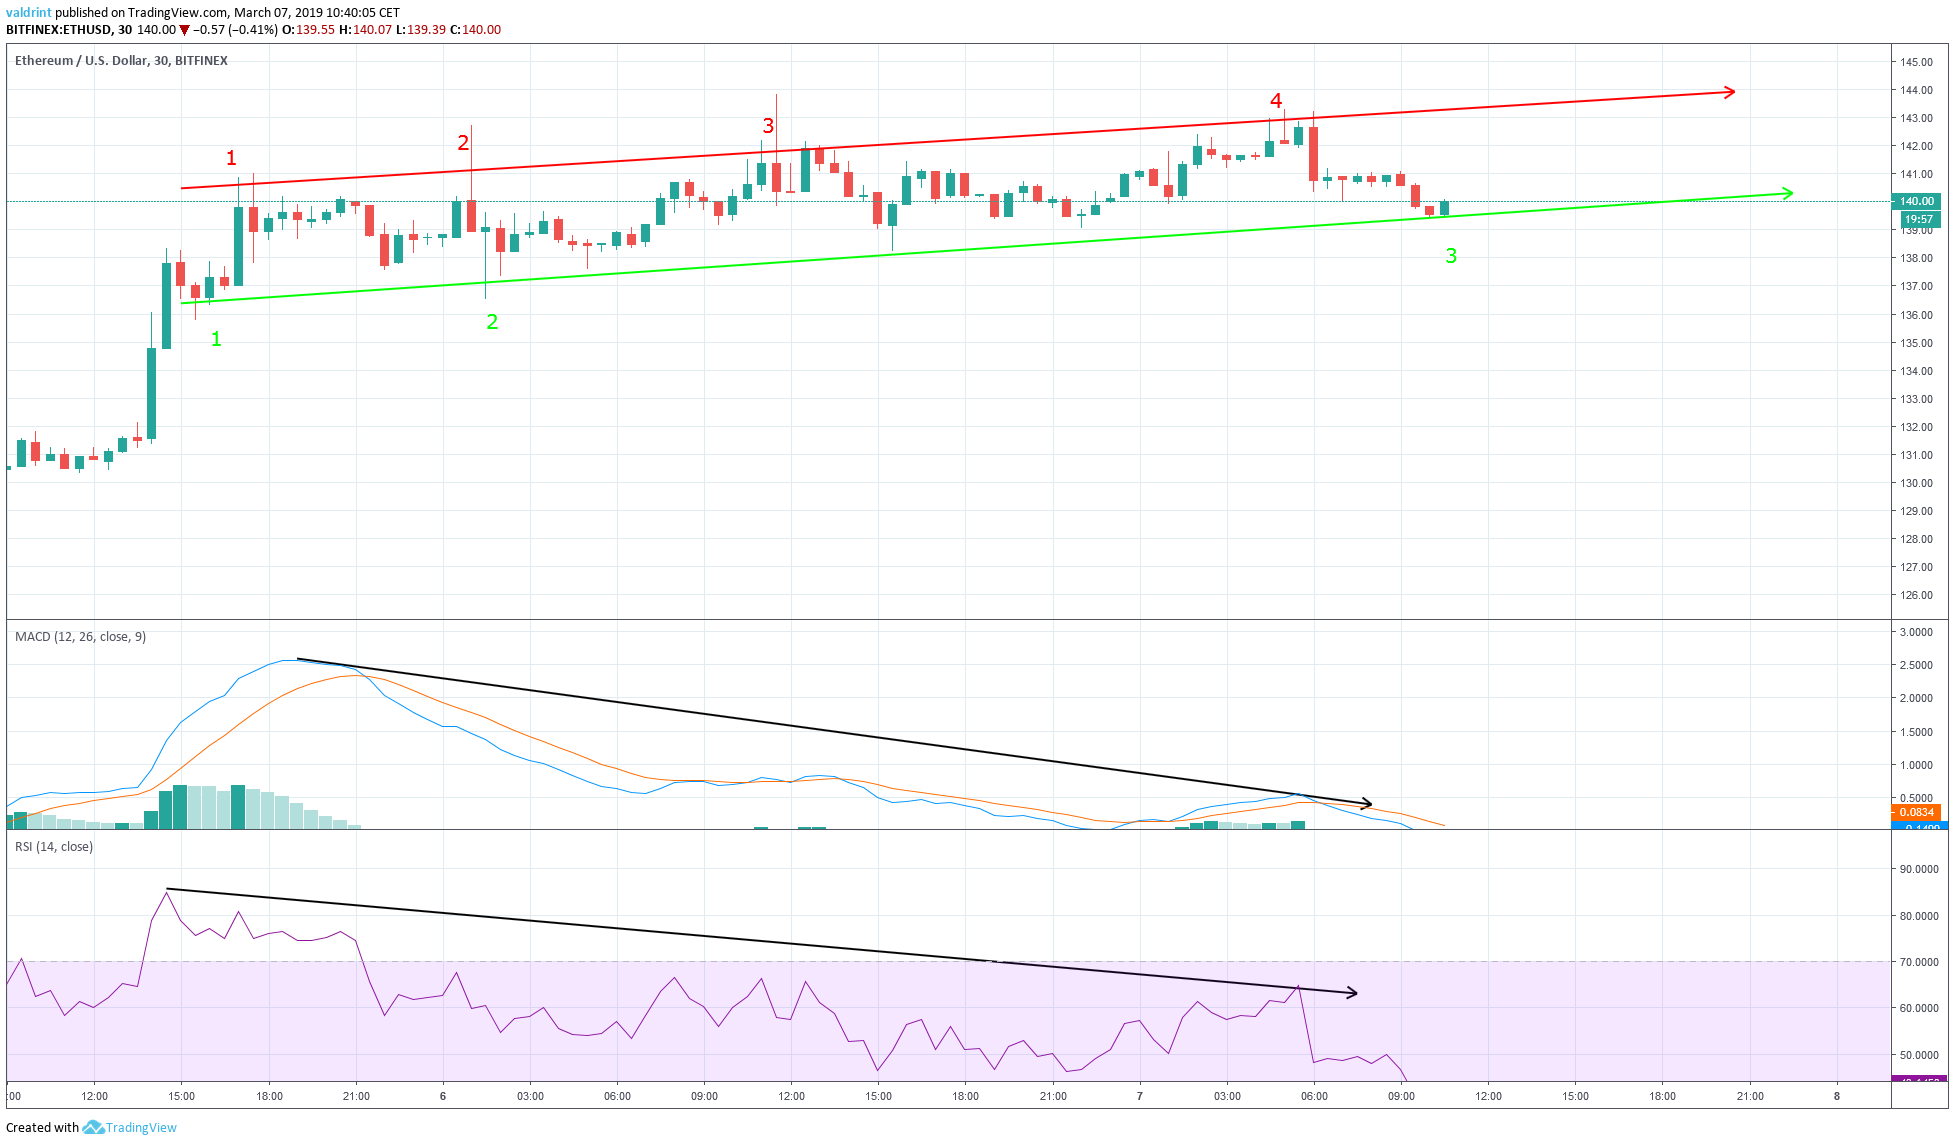
Since the Mar 5 upward move, the price has been making higher highs. During the same interval, the MACD and RSI reached a swing high on Mar 5, but have made lower highs since.
This is called bearish divergence. It often precedes drops in price. In the case of ETH, the divergence was significant in amount.
Price is currently decreasing, and the current divergence suggests that this might continue. Within the near future, Ethereum’s price may fall below current support—which could indicate maintained losses for an indeterminate period.
Future Movements
The price of ETH on Bitfinex was analyzed on 2-Hour intervals from Feb 15 to Mar 7.
Resistance and support areas are formed when the price reaches a certain level several times. They can act as a ceiling/floor that prevents the price from moving further in that direction.
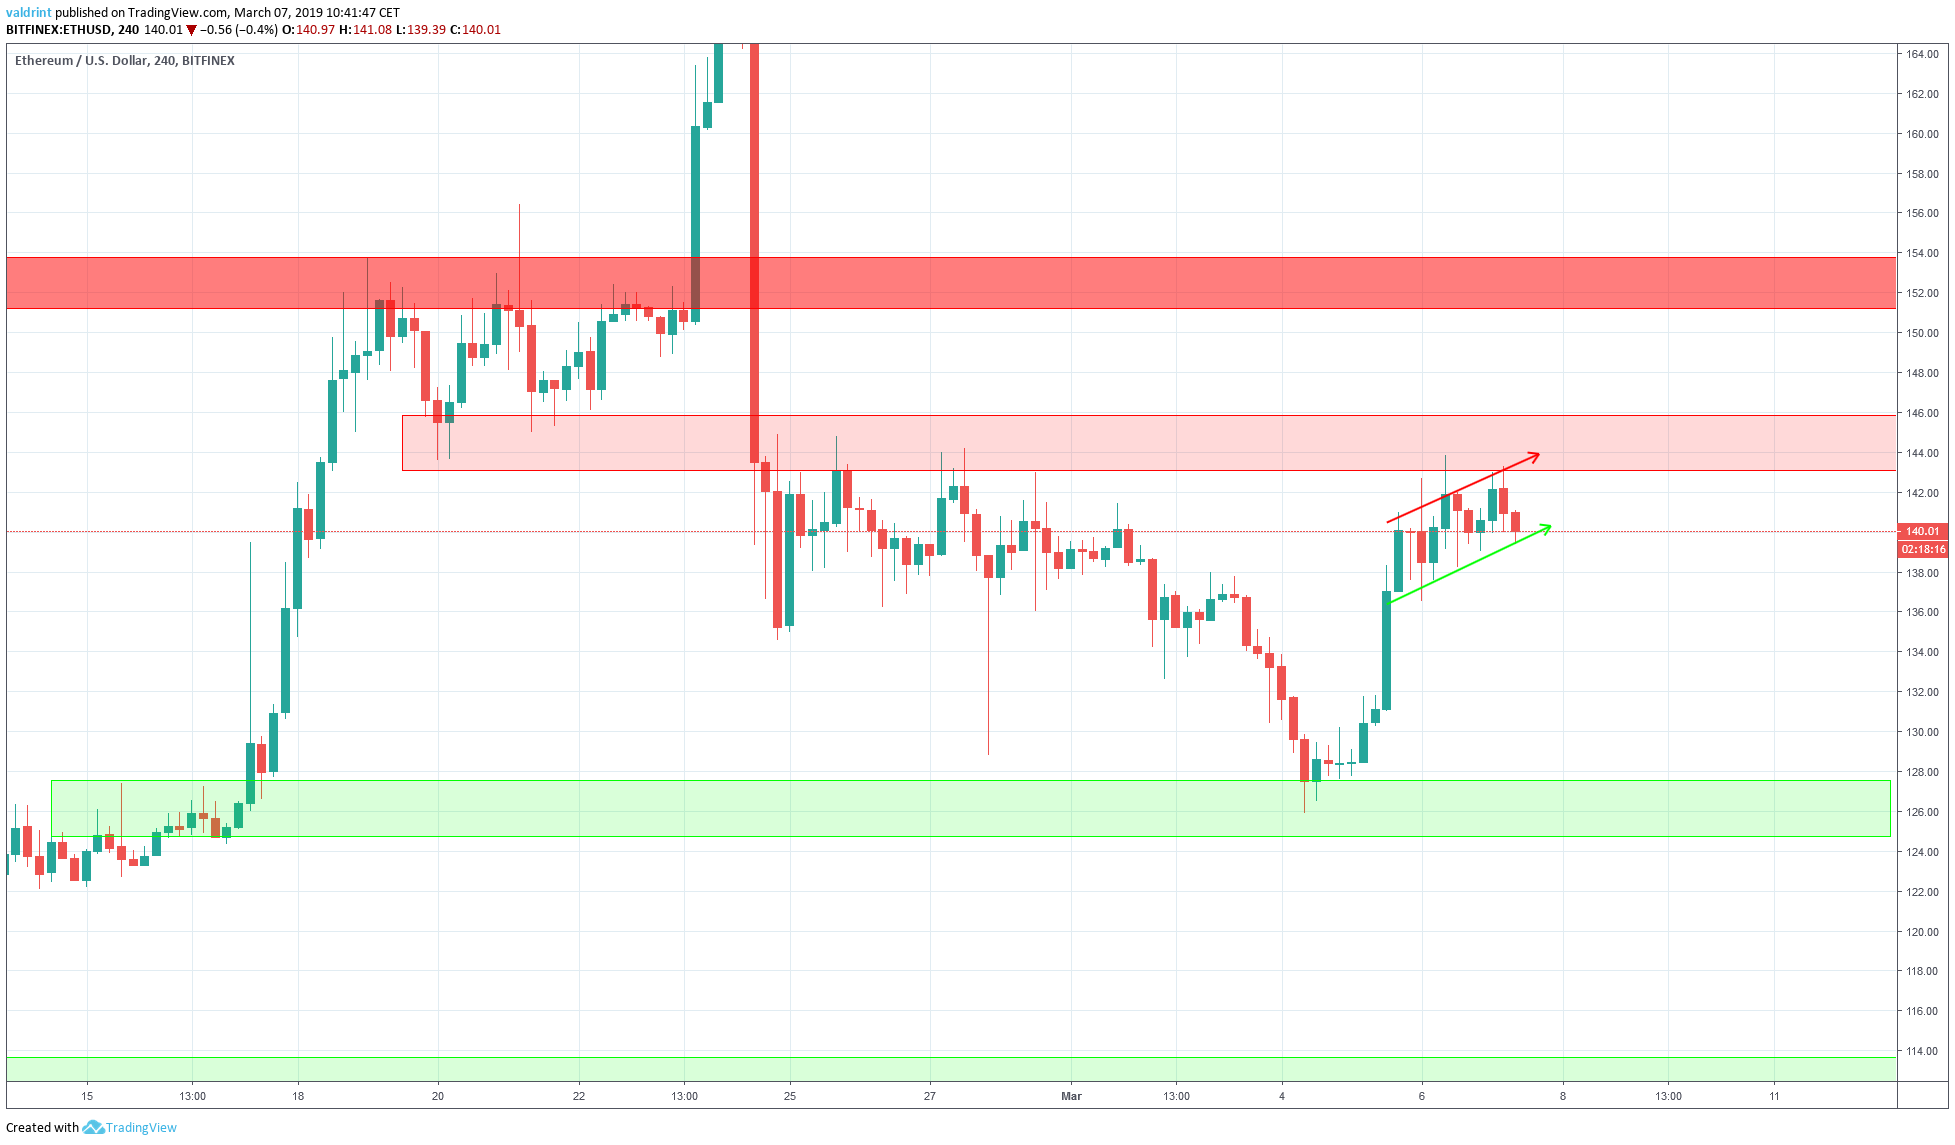
The closest support area corresponds with the resistance line of the channel, close to $144.
The next area of resistance can be found near $152. If the price were to break out of the channel, that would be a likely area of reversal.
The closest support area is found near $126. If price breaks down below the channel, that would be a likely area of reversal.
Based on this analysis, the price of ETH is more likely to breakdown from the channel. If it does, this prediction would be partially validated. If it reached $126, the prediction would be fully validated.
Do you think the price of ETH will breakout or breakdown from the channel? Let us know your thoughts in the comments below, and be sure to check out our in-depth Ethereum price predictions!
Disclaimer: This article is not trading advice and should not be construed as such. Always consult a trained financial professional before investing in cryptocurrencies, as the market is particularly volatile.


