


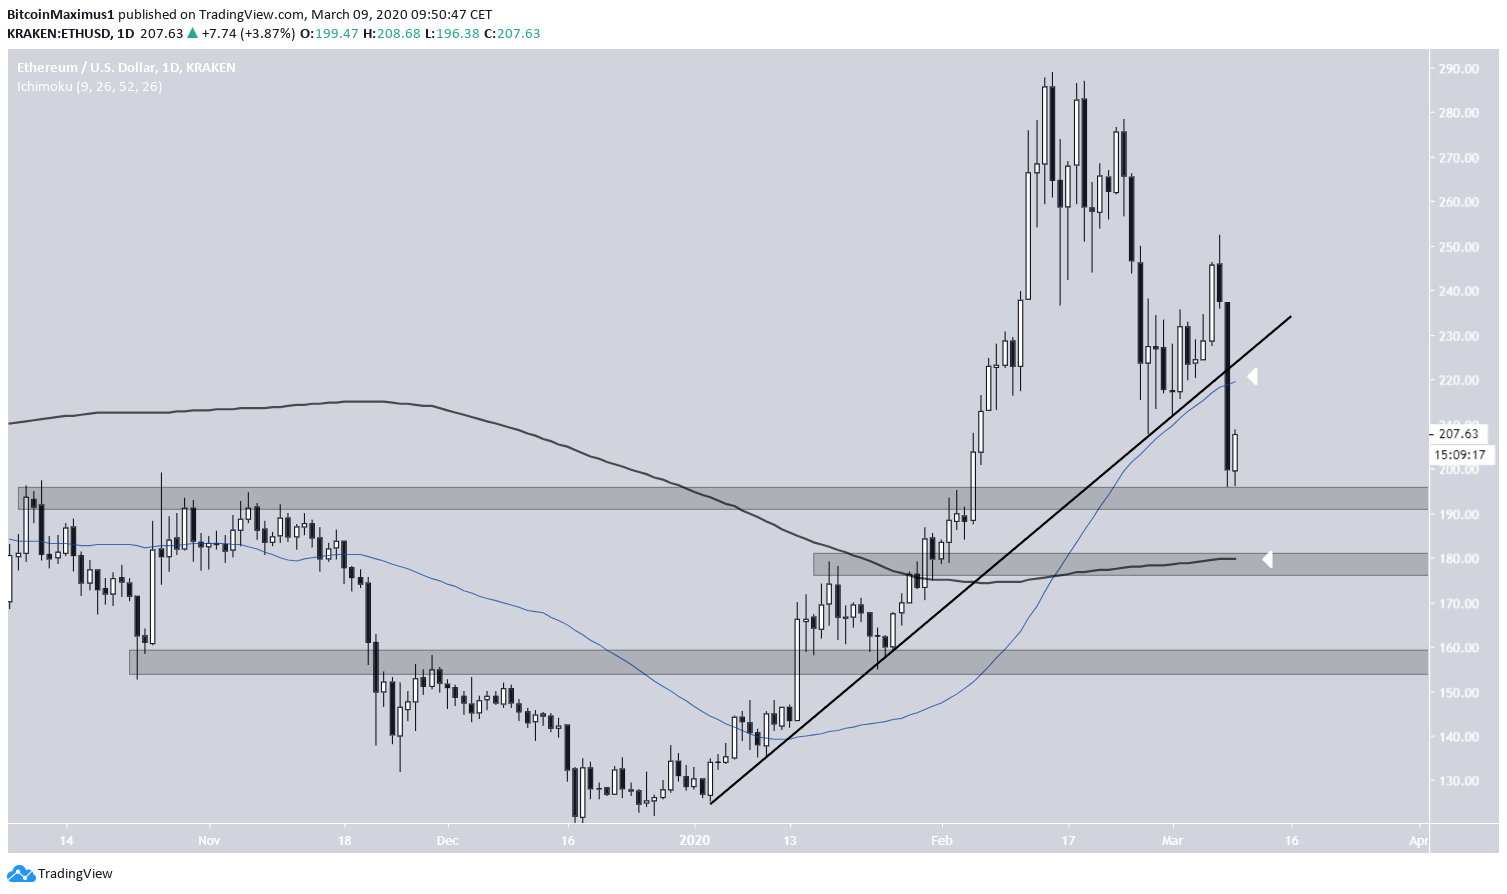
On March 8, the Ethereum price broke down below an ascending support line that had been in place for virtually the entirety of 2020. The decrease temporarily stopped once the price reached the first support area.
Ethereum (ETH) Price Highlights
- The price has broken down below a significant support line.
- There is support at $195, $180, and $155.
- The daily RSI is bearish.
- ETH/BTC is trading in a range between ₿0.025-₿0.027.
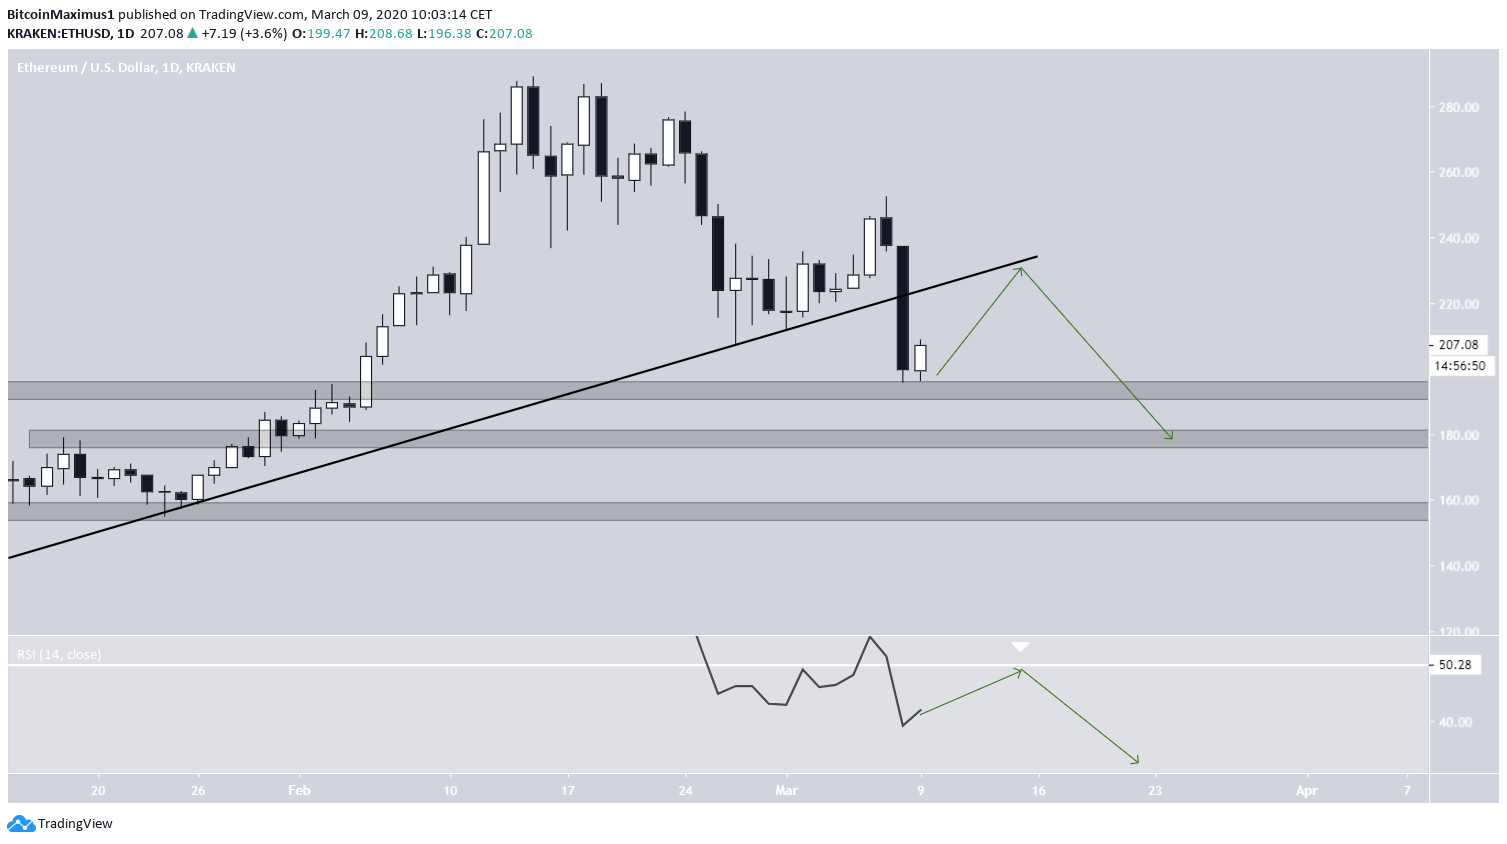
Full-time trader @CryptoMichNL outlined an Ethereum chart showing that the price has reached the minor support area at $195. As for the future movement, he is predicting a bounce towards $215-$220 before the price eventually settles between $170-$180.
This one couldn't break up either and provided a bearish retest.
Hit $195;https://t.co/Wcli20nJiQ
But think we'll see a bounce towards $215-220 before I'm aiming $170-180 as serious long zones. pic.twitter.com/t6yo3FOXPe
— Michaël van de Poppe (@CryptoMichNL) March 9, 2020
Support Areas
The Ethereum price had been following an ascending support line since Jan 3 but broke down from it on March 8. The breakdown was extremely significant since the price created a massive bearish engulfing candlestick and also fell below the 50-day moving average (MA).
There are three main support areas:
- $195 – which the price has reached.
- $180 – very important support area that coincides with the 200-day MA.
- $155 – the final support level prior to a 100% retracement.
While the first area could provide a short-term relief rally that serves to validate the previous ascending support line as resistance, it will not likely be sufficient in reversing the price.
As for the price and RSI movement, the most likely outline for the future movement seems a move to validate the support line near $220, followed by a decrease toward the second support area. The support line has been in place for quite a while, so it does not make sense for the decrease to be completed as soon as the price reaches the first support area.
As for the RSI, this movement would entail an increase to validate the 50-line from below, followed by another decrease. The fact that the RSI has dropped below 50 suggests that the current trend is bearish.
Ethereum/Bitcoin
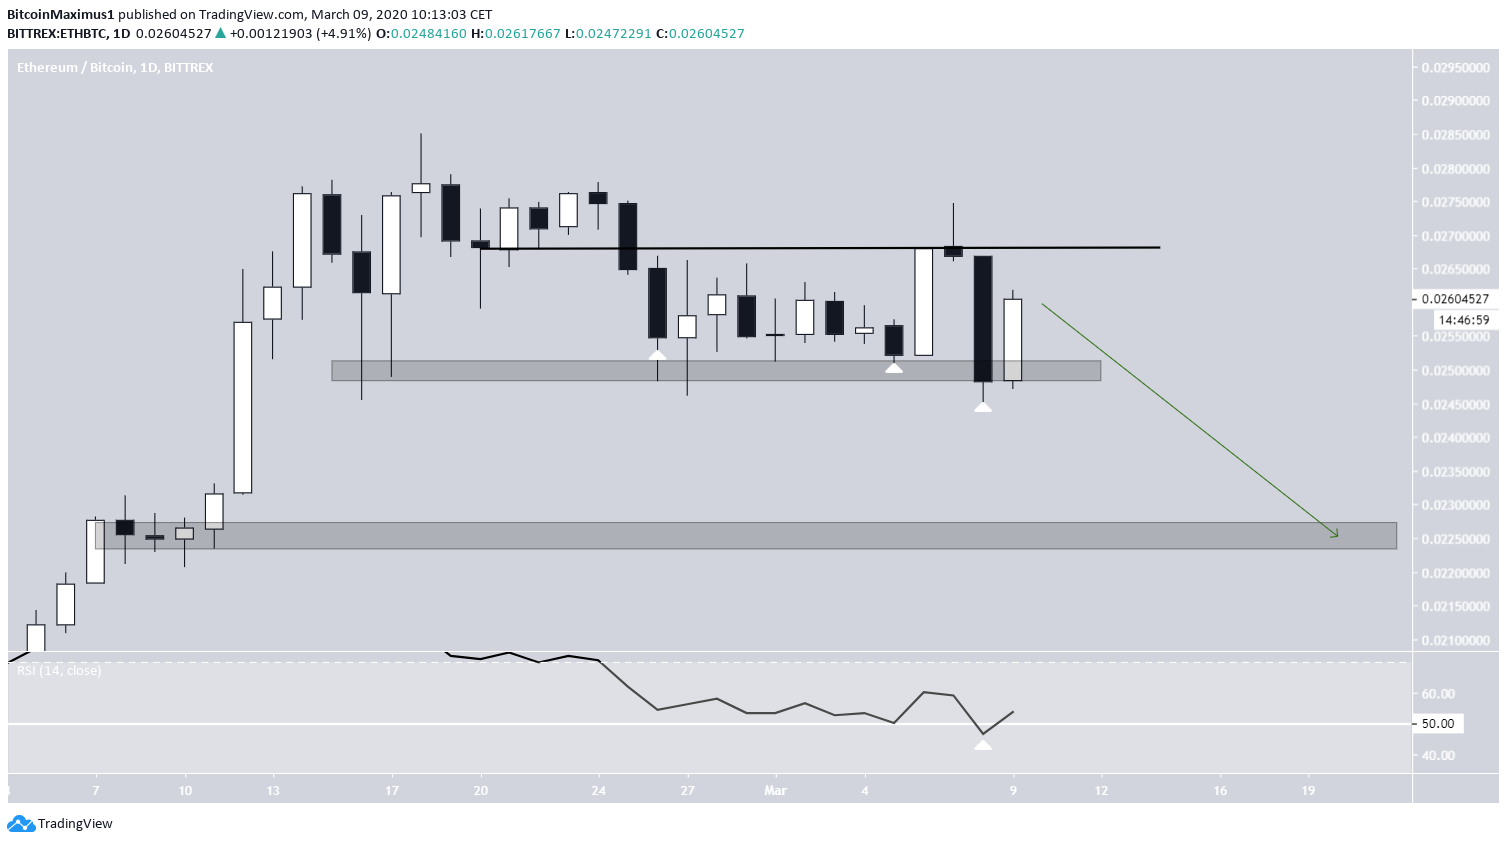
As for the ETH/BTC pair, it has been holding up relatively well during Bitcoin’s decrease. As @PostyXBT outlined, it is trading inside a range between ₿0.025-₿0.027, currently being very close to the support area.
The range continues…#ETH is my signal for when I should put more attention towards alts again.
If we have a bullish break out of this range, then it's time. Until then, focusing most of my time on Bitcoin PA. pic.twitter.com/H1x4ipxkee
— Posty (@PostyXBT) March 9, 2020
Even though the price is holding on to support, it has been consistently making lower daily closes, the final one being right inside the support area. In addition, the ensuing bounces have been weaker.
The daily RSI is barely holding on above 50. So, it looks as if the price will break down and head towards the next support area at ₿0.0225.
To conclude, the Ethereum price has broken down below a significant support area. While a relief rally is possible, the price is expected to eventually decrease to the support areas outlined above.


