


The Ethereum (ETH) price increased considerably during the week of July 20 – 27. While the long-term bullish trend is still formidable, there are several short-term weakness signs suggesting a pullback is likely.
Ethereum Reaches Long-Term Resistance
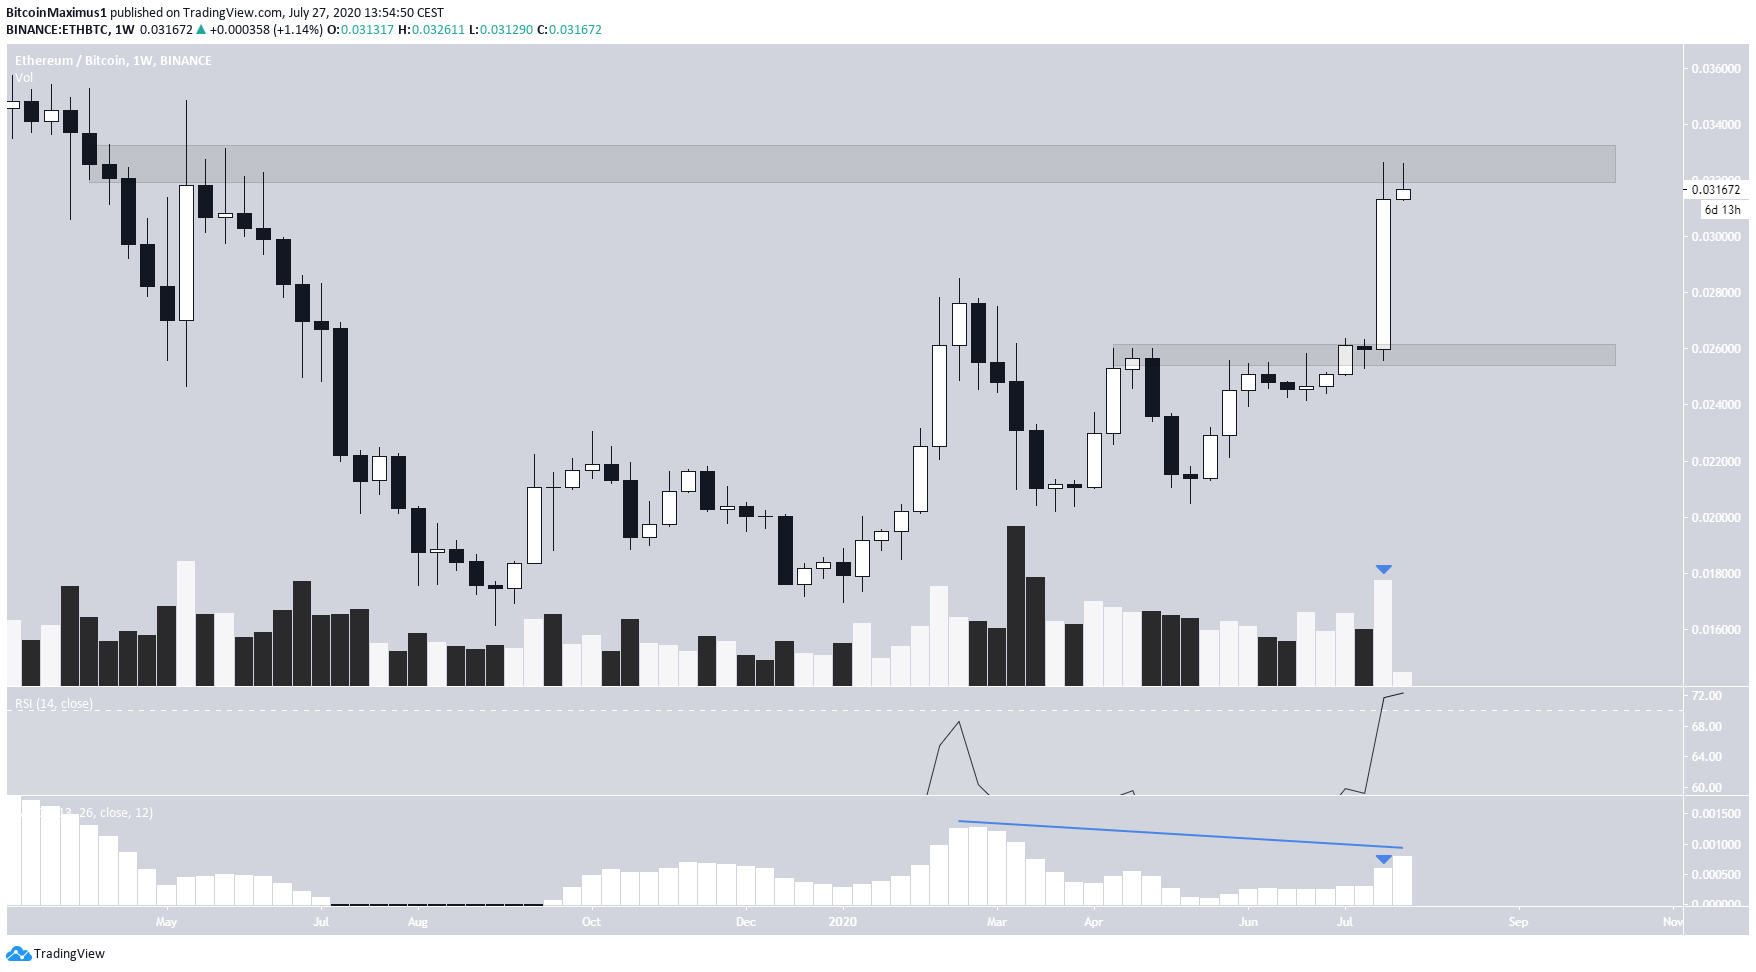
During the week of July 20 – 27, the Ethereum price created a bullish engulfing candlestick with considerable volume. The increase took the price all the way to ₿0.0325. This area acted as resistance in May 2019, and the price has not reached it since.
Even though the RSI is overbought, there is no bearish divergence yet. In addition, the MACD has formed bearish divergence relative to the readings in February, but the momentum has picked up over the past two weeks. Therefore, while the trend is losing momentum, it is still bullish
The closest support area is found at ₿0.026, which is the level that created the recent bullish engulfing candlestick.
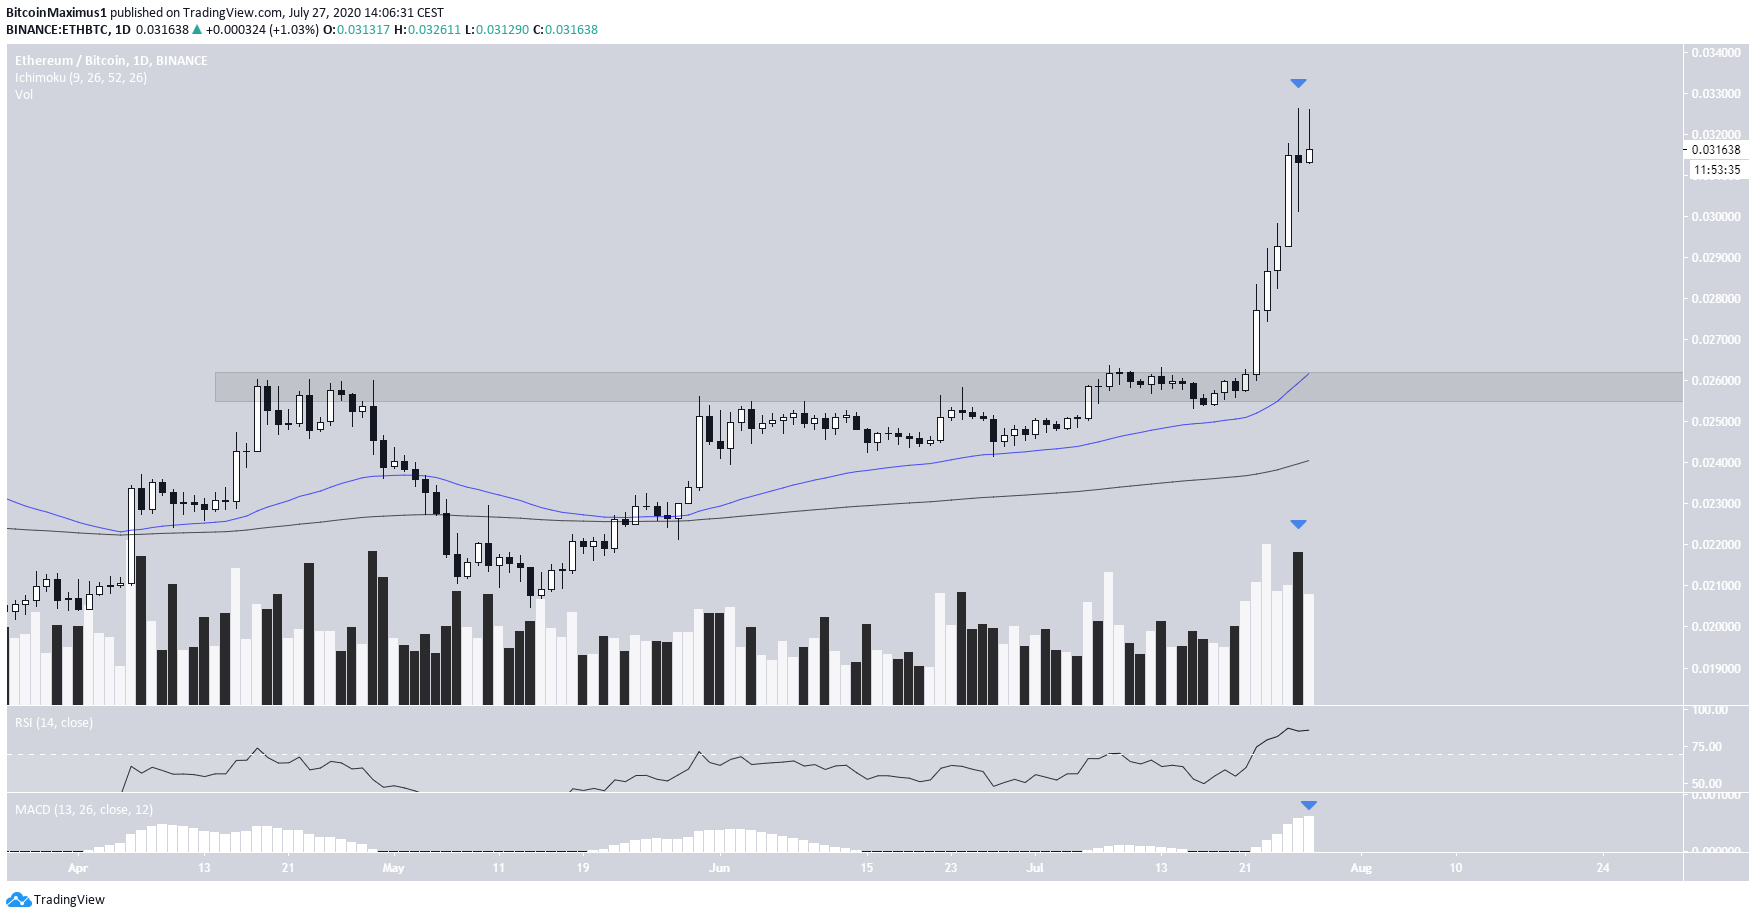
The daily chart provides a similar outlook. On July 26, the Ethereum price created a high wave doji, which is a bearish reversal pattern when coming after an upward move. The bearish candlestick also took place with significant volume.
Technical indicators are similar to the weekly time-frame. The RSI is extremely overbought but has not generated any type of bearish divergence yet. The MACD is still growing. So, while the trend is overextended, it hasn’t shown any type of weakness yet.
The ₿0.026 support area is strengthened by the presence of the 50-day MA, which previously made a bullish cross with the 200-day one.
Comparison to Silver
Cryptocurrency trader @Anbessa100 outlined an Ethereum chart, showing a fractal with silver that has been ongoing since the beginning of 2018.
Ethereum has broken out from its February high. She noted its importance since silver did the same and went on to reach multi-year highs.
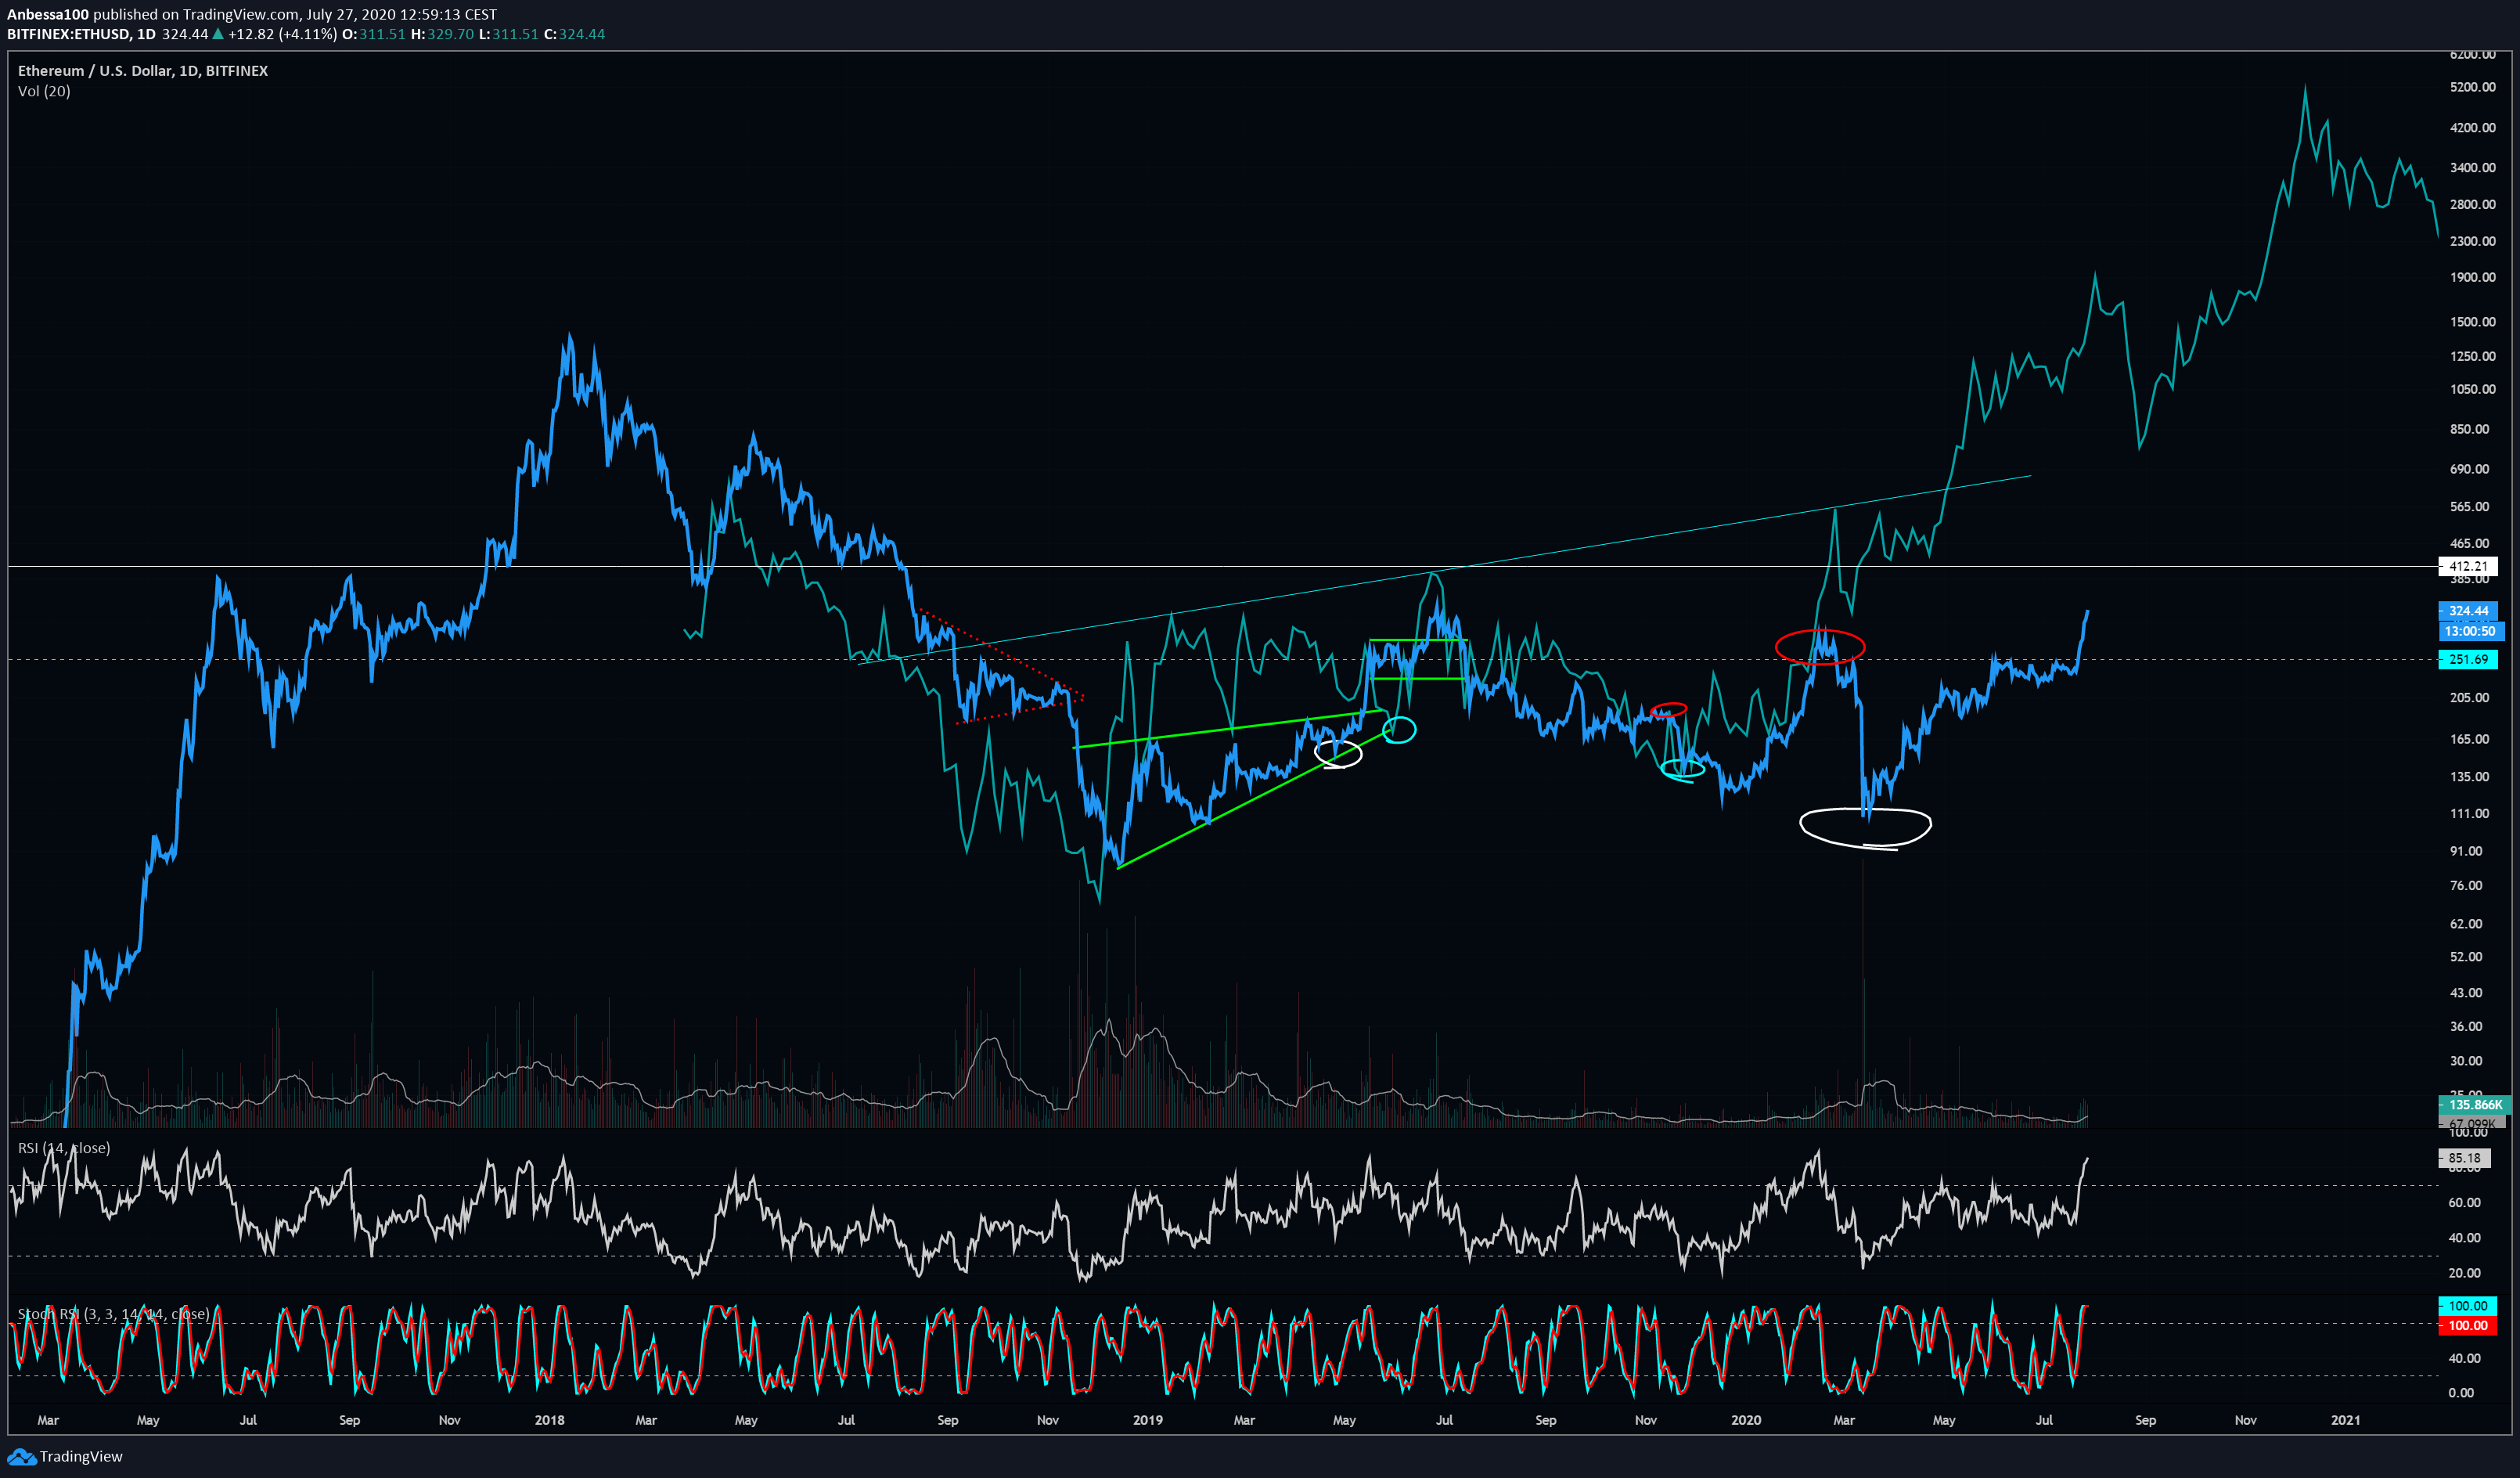
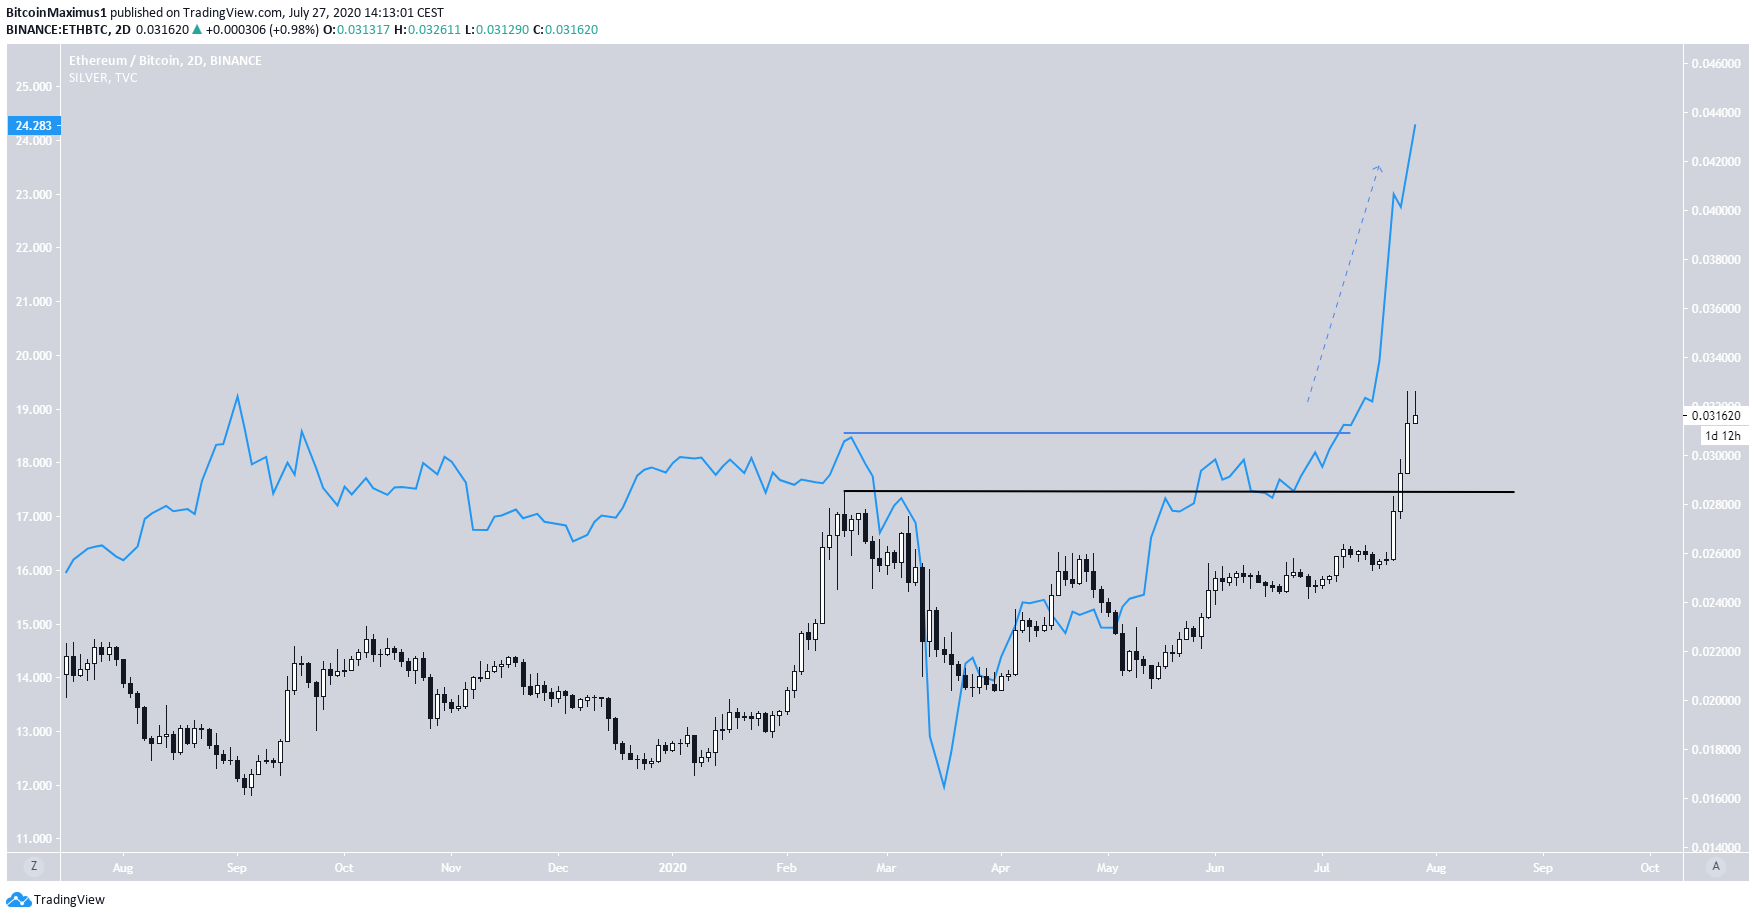
The price of silver is shown in the graph below in blue. Indeed, when the price broke out from its February high, it initiated a parabolic increase, taking the price to its current levels.
Similarly, the Ethereum price has been increasing rapidly since it broke out above the February high last week. While the all-time high is still far away, it should continue moving upwards at an accelerated pace if the silver fractal stays intact.
Wave Count
The Ethereum move since September has been unusual, making it difficult to draw a correct wave count. However, it’s possible that the price is in the third wave (black) of a five-wave Elliott formation. Inside it, the price is in the fifth sub-wave (white), which has also extended.
The minor sub-waves for the 5th wave extension are shown in yellow. If the count is correct, ETH would initiate a short-term decline, before moving upwards with strength and completing the long-term third wave.
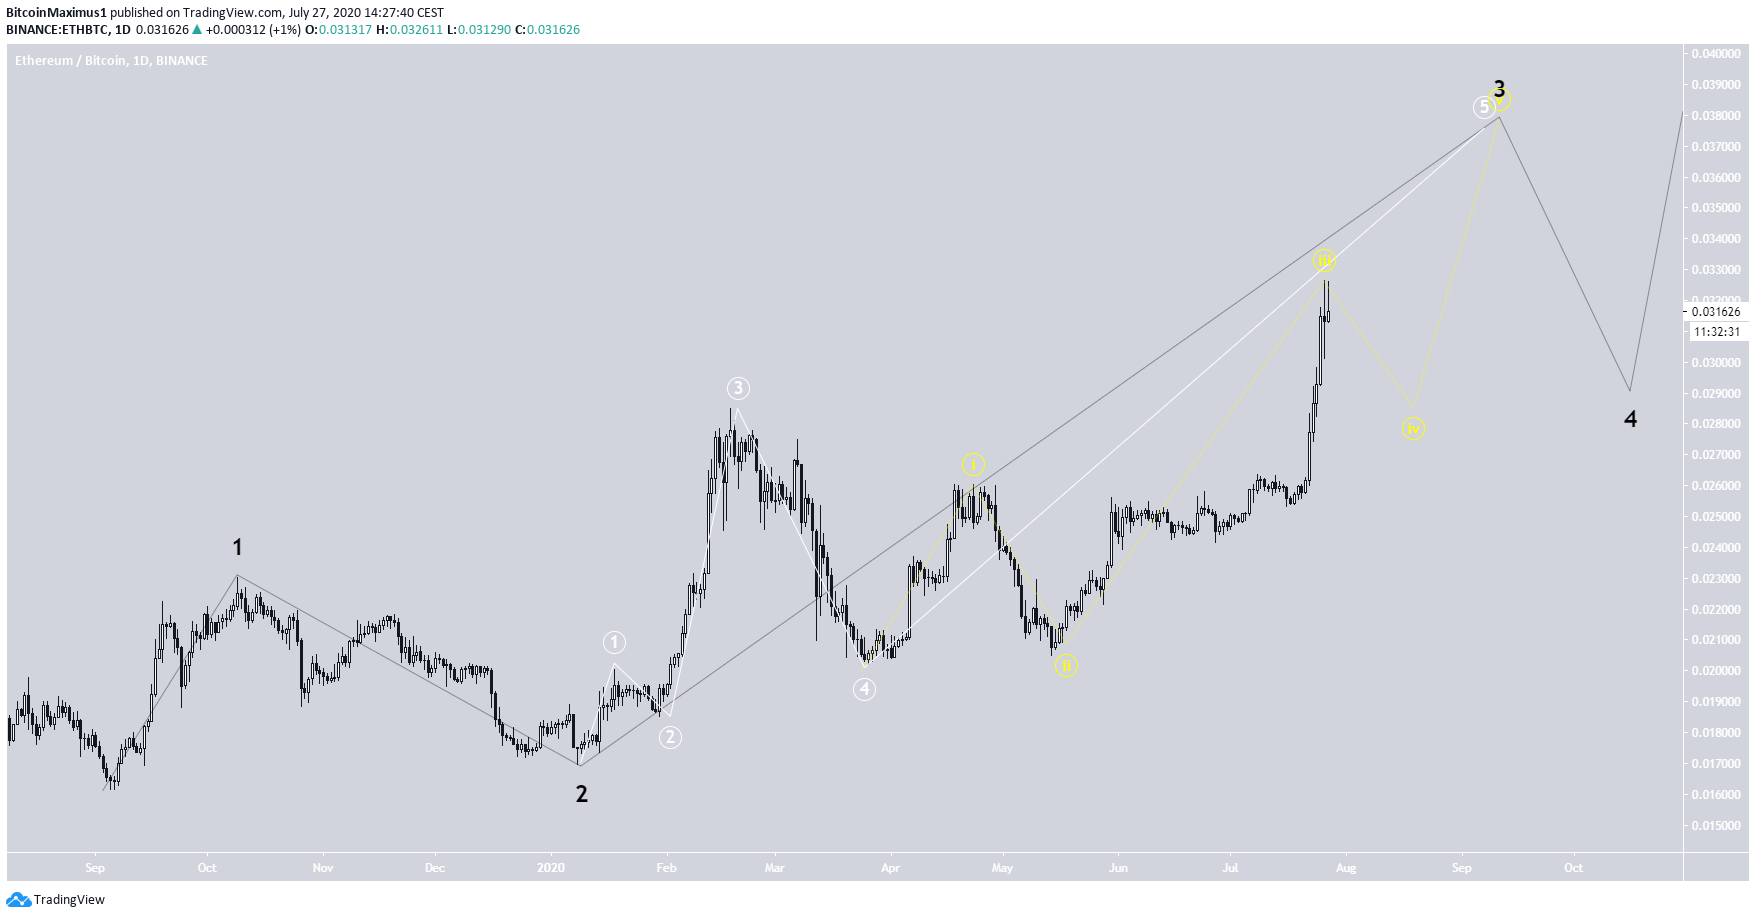
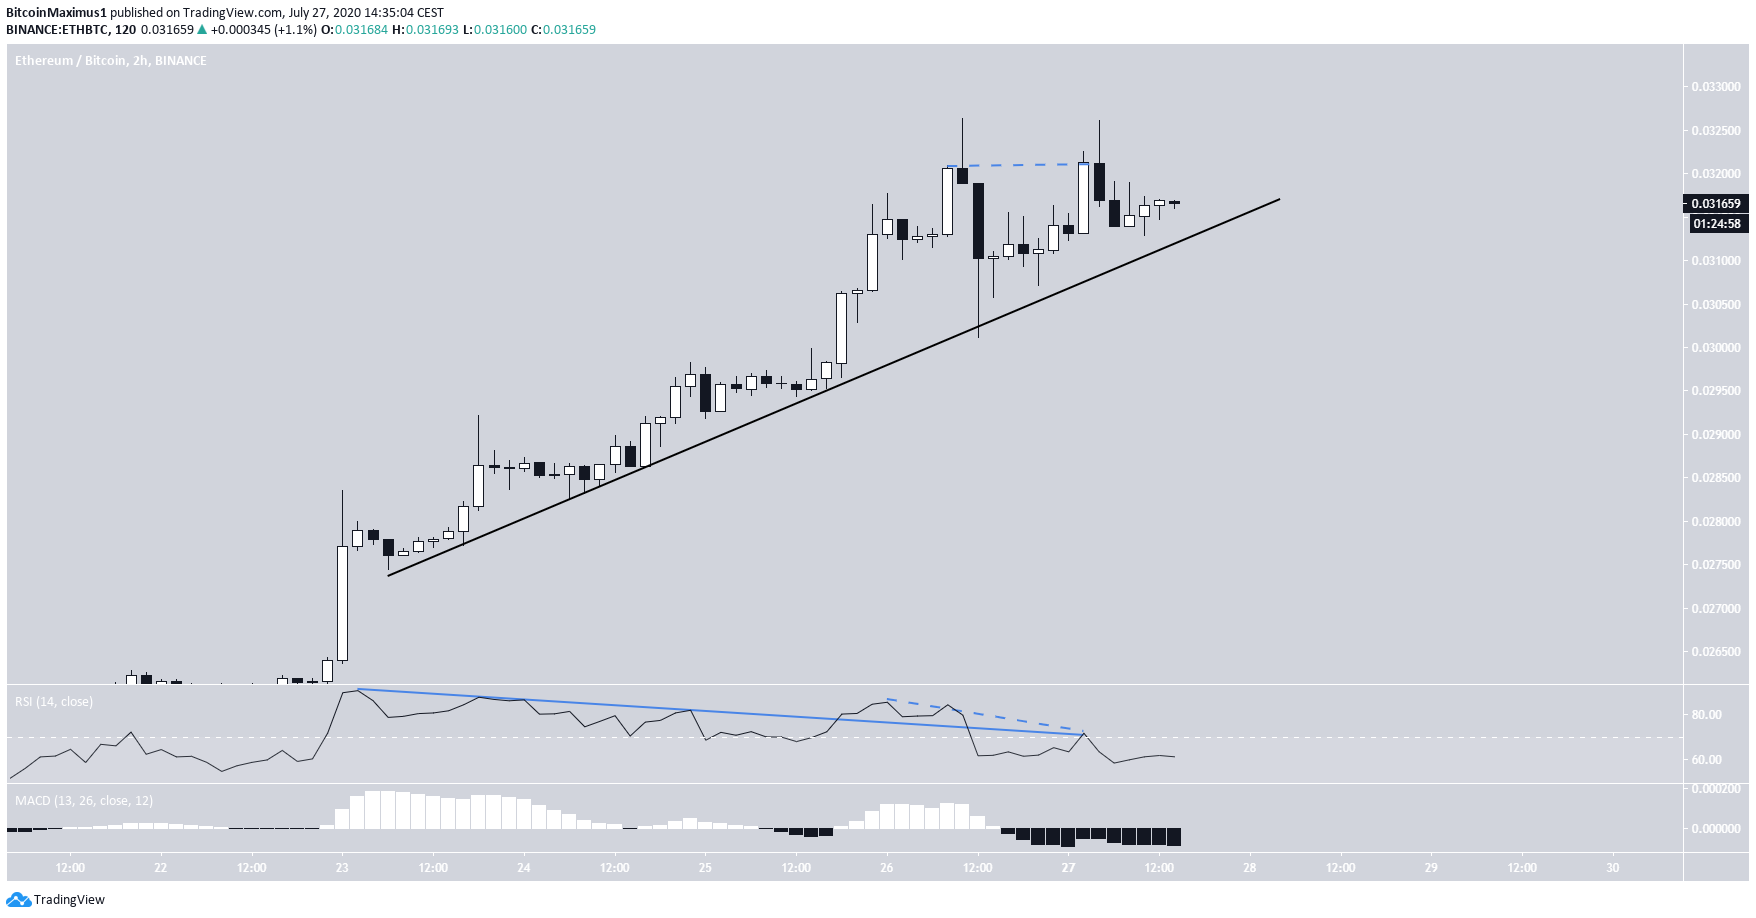
The short-term readings also confirm this possibility. The price has created a short-term double top pattern, combined with bearish divergence and a considerable loss of momentum on the MACD.
Therefore, once the steep ascending support line breaks, ETH is likely to retrace towards ₿0.028 and possibly the support area outlined in the first section at ₿0.026.
To conclude, the Ethereum price is in a long-term bullish trend. A short-term pullback is expected before the price resumes its upward movement.


