


![Ethereum Fractal Suggests a New Market Cycle Will Begin Soon [Premium Analysis]](/_mfes/post/_next/image/?url=https%3A%2F%2Fassets.beincrypto.com%2Fimg%2Fh4sOAPVrKyLYK9jatG680fvvCgM%3D%2Fsmart%2Ff939e31c5bd74f2497a7600004716c4e&w=1920&q=75)
Ethereum has not handled the recent Bitcoin price decrease well. It has decreased at a much faster rate than the cryptocurrency market leader — losing 12 percent of its value in the ETH/BTC pair.
The reasons for this faster-than-expected decrease could be numerous. First, a wallet associated with PlusToken has just moved more than $100 million worth of ether (ETH).
On top of that, an early investor in the Ethereum ICO has moved almost 300,000 ETH from his account, which had been there since 2015. Around six days ago, the account moved another 60,000 ETH out of this wallet.
However, technical analysis shows that the possibility of a reversal is still present. Trader and analyst Bitcoin Jack stated that the Ethereum price movement since September is possibly following a fractal set by the Bitcoin price in December 2018 — when it reached the $3400 bottom.
I heard you like fractals
Especially the 3-4K Bitcoin fractal
I have one for you$ETHBTC pic.twitter.com/gxIwihtEh4
— //Bitcoin 𝕵ack 🐐 (@BTC_JackSparrow) December 19, 2019
If so, Ethereum is very close to reaching a bottom and will soon begin a new market cycle.
Let’s take a closer look at the price movement and see if that really is the case.
In Isolation
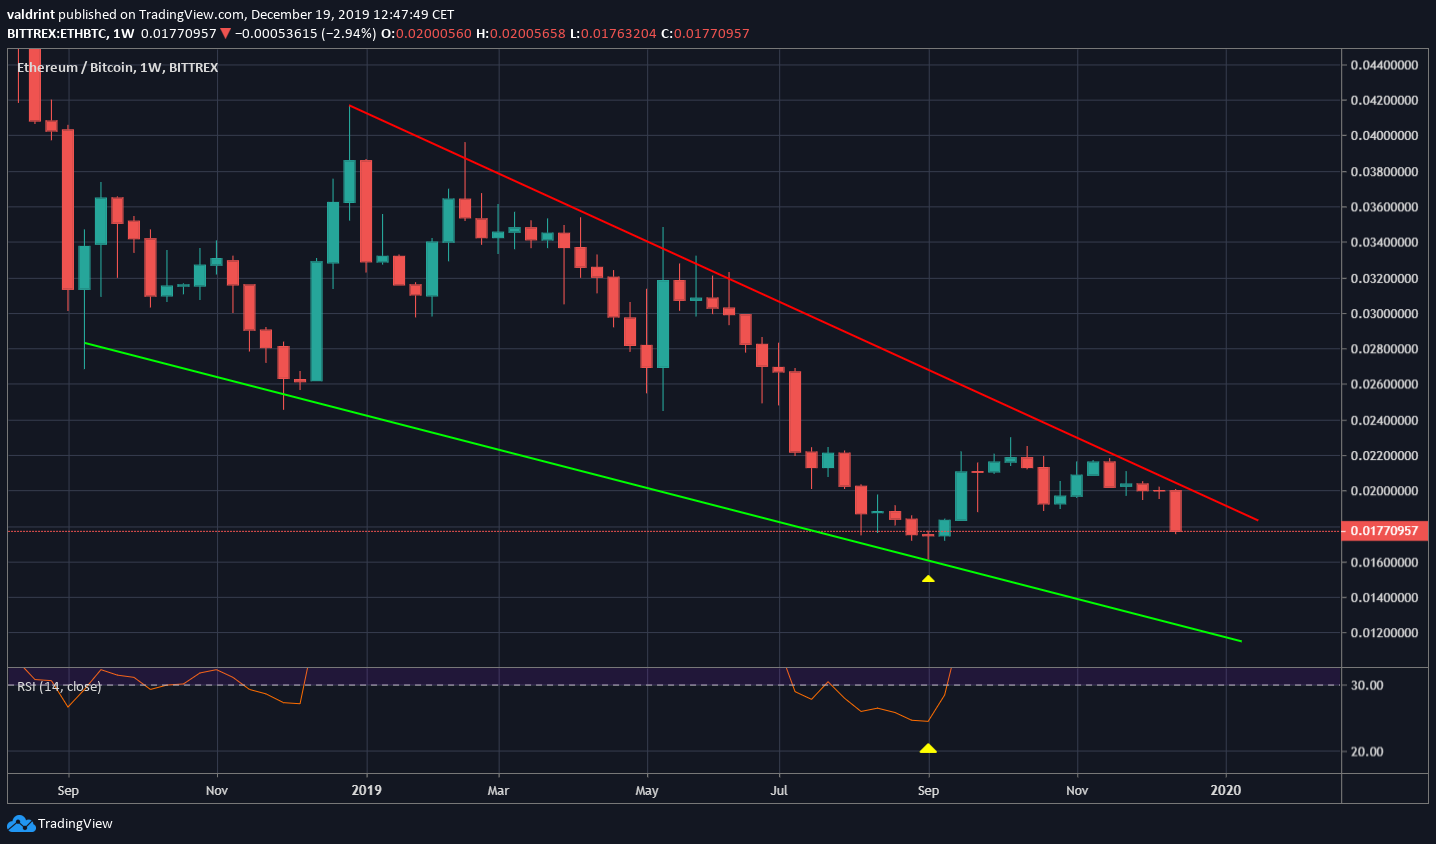
The Ethereum price has been trading inside a descending wedge since September 2018. Recently, it was rejected by the resistance line of the wedge and is currently heading downward.
It is approaching the ₿0.016 support area, which marked the long lower wick in the beginning of September. Additionally, the weekly RSI at the time had a value of 24 — the lowest recorded since September.
Ethereum vs. Bitcoin
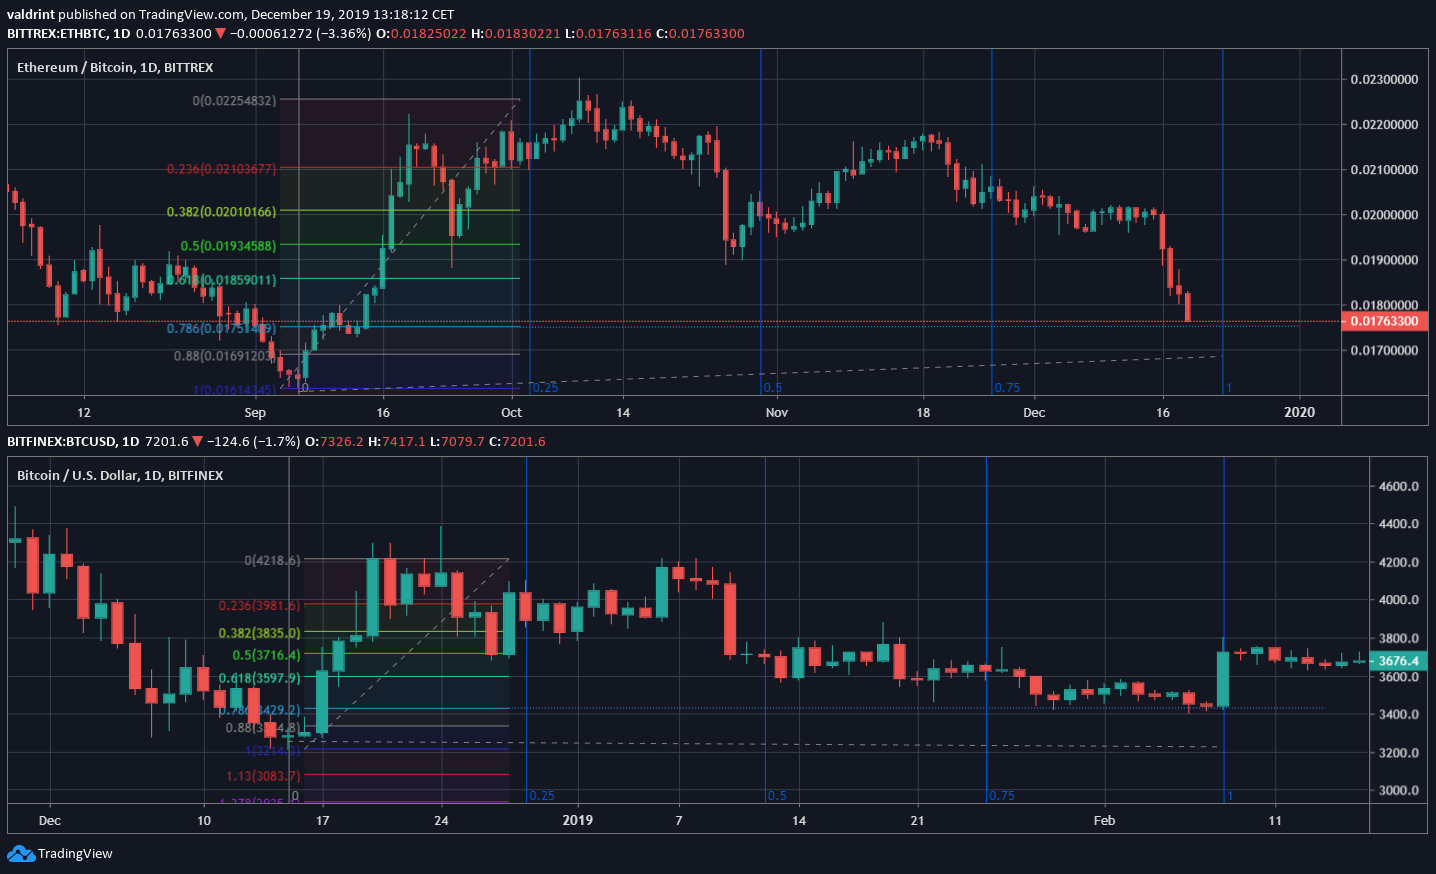
The December 2018 and current Ethereum movements share several similarities. More specifically, both movements ended at the 0.786 Fib retracement level.
Additionally, dividing the movement into quarters, the first quarter had a rapid price increase, the second was consolidation near the high, while the third and fourth ones indicated price decreases.
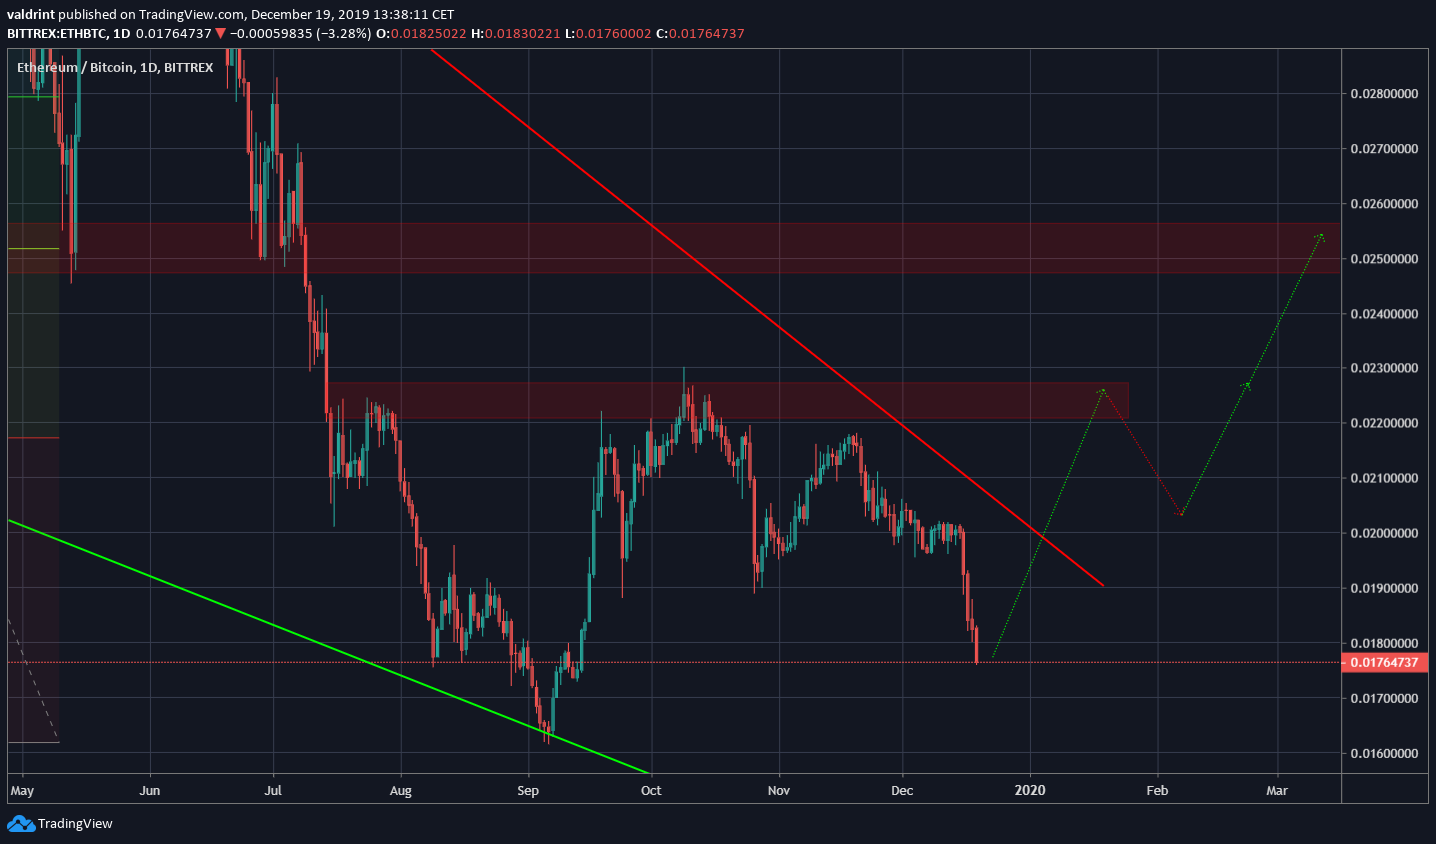
If the Ethereum price continues following this fractal, it should reach a low near ₿0.017 before continuing its upward movement.
In the context of the longer-term descending wedge, the initial movement would cause the Ethereum price to break out from the wedge and head towards the resistance at 0.0225. After a period of consolidation, the price should continue moving upward and eventually reach 0.25.
To conclude, the Ethereum price has been trading inside a bullish pattern for more than a year. Its current movement is very similar to that of Bitcoin during the December 2018 low. If it continues following this pattern, it will reach a bottom near ₿0.017 by the end of the year before breaking out.


