


Ethereum recently fell below a significant support area and validated it as resistance. It is currently decreasing towards the support line of a descending channel.
While inside this channel, the Ethereum price has decreased by 40%. However, it has begun showing some signs of a reversal.
Price action trader @TheCryptoCactus outlined the current trading pattern for Ethereum. He suggested that the price is likely to test the lower support area of $137.
$ETH another test of channel support but this time we have failed to reclaim this longterm support level of $153.
Even though we may see some support at this channel low its likely now that confirming previous support is new resistance we could see PA test lower support at $137. pic.twitter.com/M8pfYlJMnO
— Cactus (@thecryptocactus) December 12, 2019
Let’s take a closer look at the Ethereum price and see if it is likely to get there.
Descending Channel
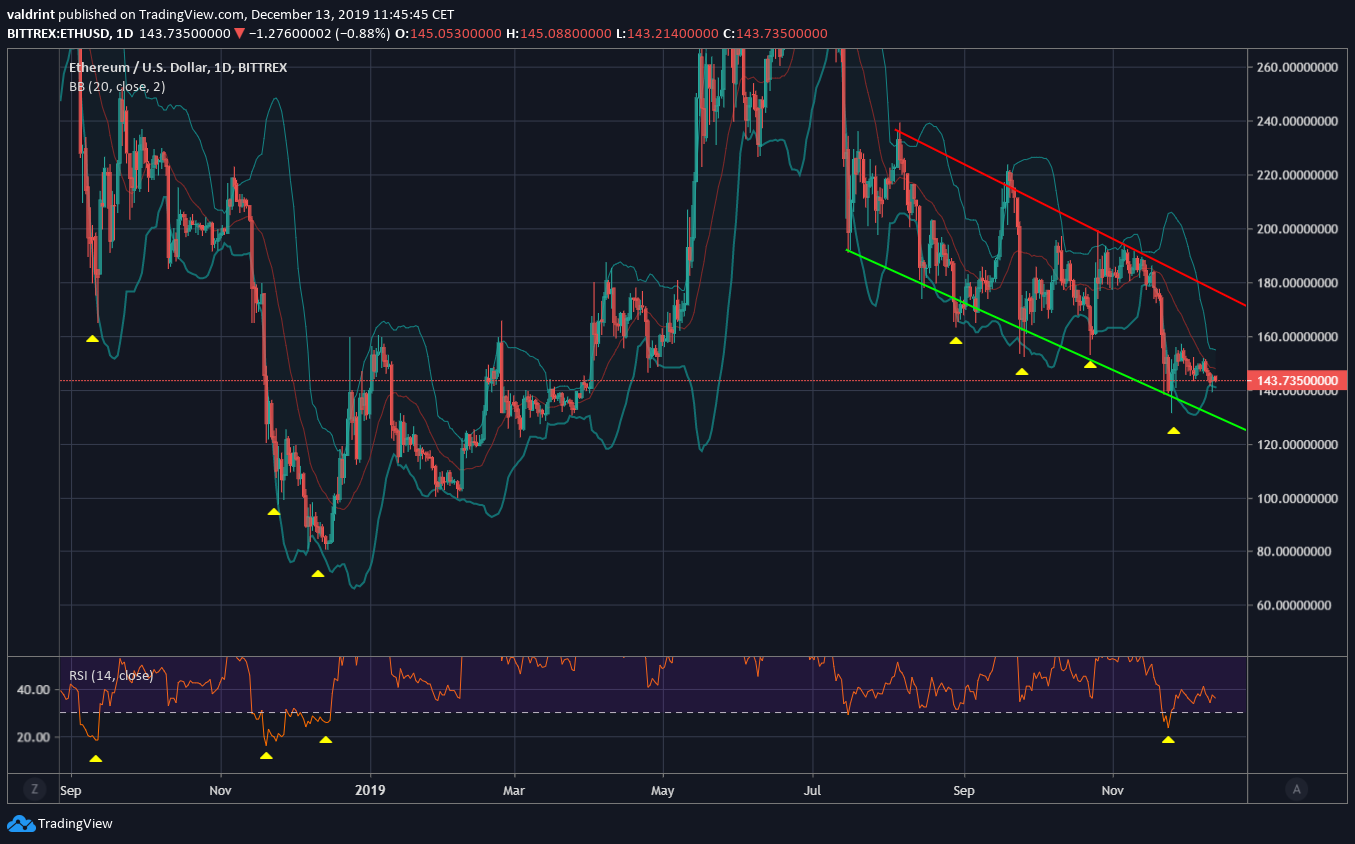
The Ethereum price has been trading inside a descending channel since July 16. It initially created a support area at $155 but broke down below it on November 21.
Afterward, the price validated the area as resistance before decreasing. It is currently slightly above the next support area at $135, which coincides with the descending support line of the channel.

There are two main reasons why we believe the price will reclaim the resistance area and head towards the resistance line of the channel.
The price fell below the lower Bollinger band on November 26. Every-time it has done so while trading inside the descending channel, an upward move towards the resistance line has occurred.
Additionally, the daily RSI has fallen below 30. Every other time this occurred over the past year, a reversal ensued.
Ethereum/Bitcoin
If the current ETH/USD increase happens, it is possible that the ETH/BTC pair increases, if Ethereum’s rate of increase is higher than that of BTC.
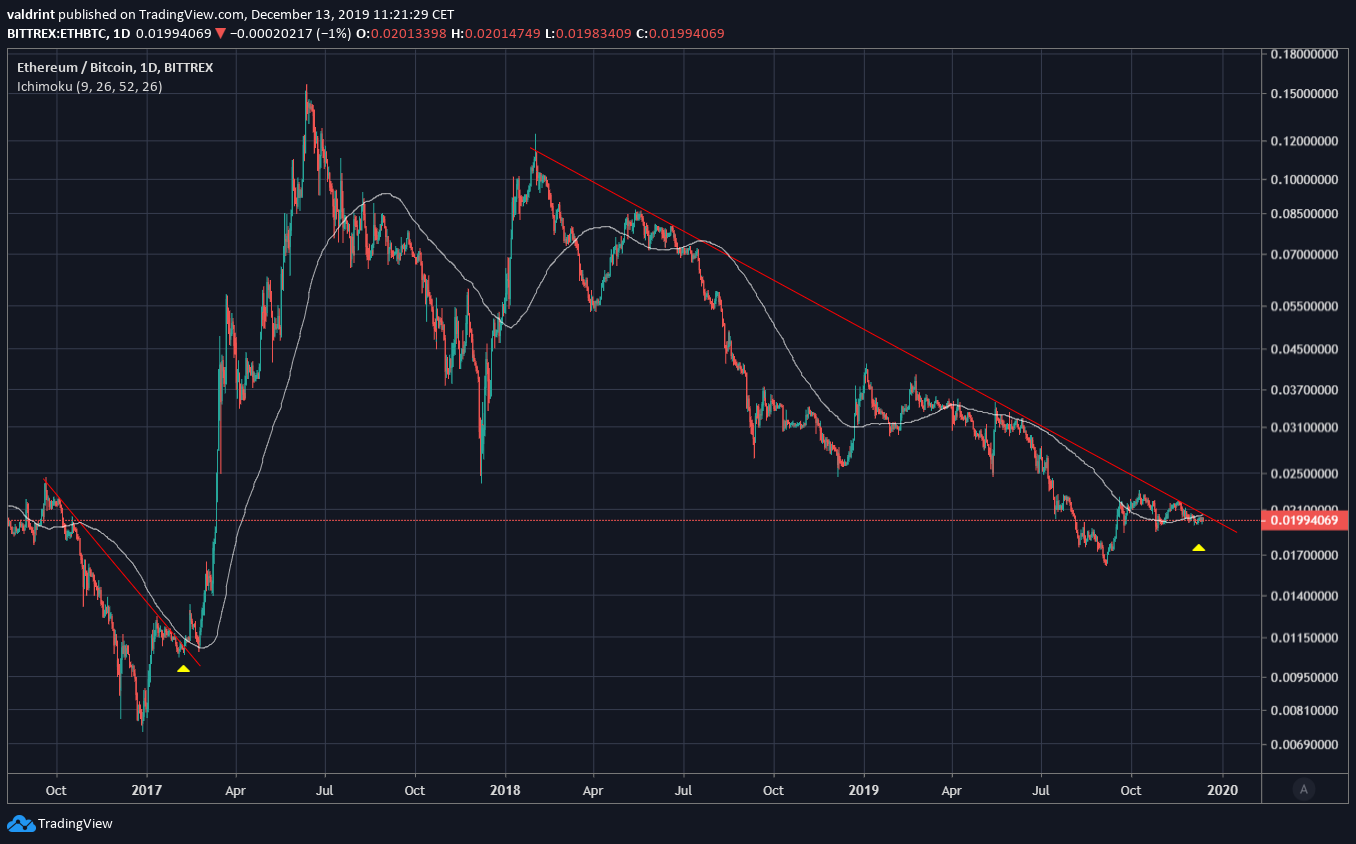
Full-time trader @cryptoMichNL suggested that the current ETH/BTC movement is very similar to that in 2016 that preceded the 2017 upward move.
Patience, patience.
Still looks the same to me. pic.twitter.com/4GwOKA01hz
— Michaël van de Poppe (@CryptoMichNL) December 12, 2019
The resistance lines are very similar and the 100-day moving average (MA) shows some similarities since the price moved above it in 2016 right before the breakout and is currently doing the same now.
However, the RSI is at a very different position, and price movement below the resistance area, including but not limited to the touches of the support line and the percentage/duration of the decrease are very dissimilar.
Thus, while there are similarities, we do not believe they are sufficient in concluding that the current movement is a fractal of the previous one.
To conclude, both the ETH/USD and ETH/BTC pairs have been trending downward for an extended period of time. However, both have shown signs of a reversal and upward moves could soon follow.
Images are courtesy of TradingView, Twitter.


