


On June 10, 2019, the Ethereum price (ETH) reached a high of $226. A gradual increase ensued. The price has created several higher lows.
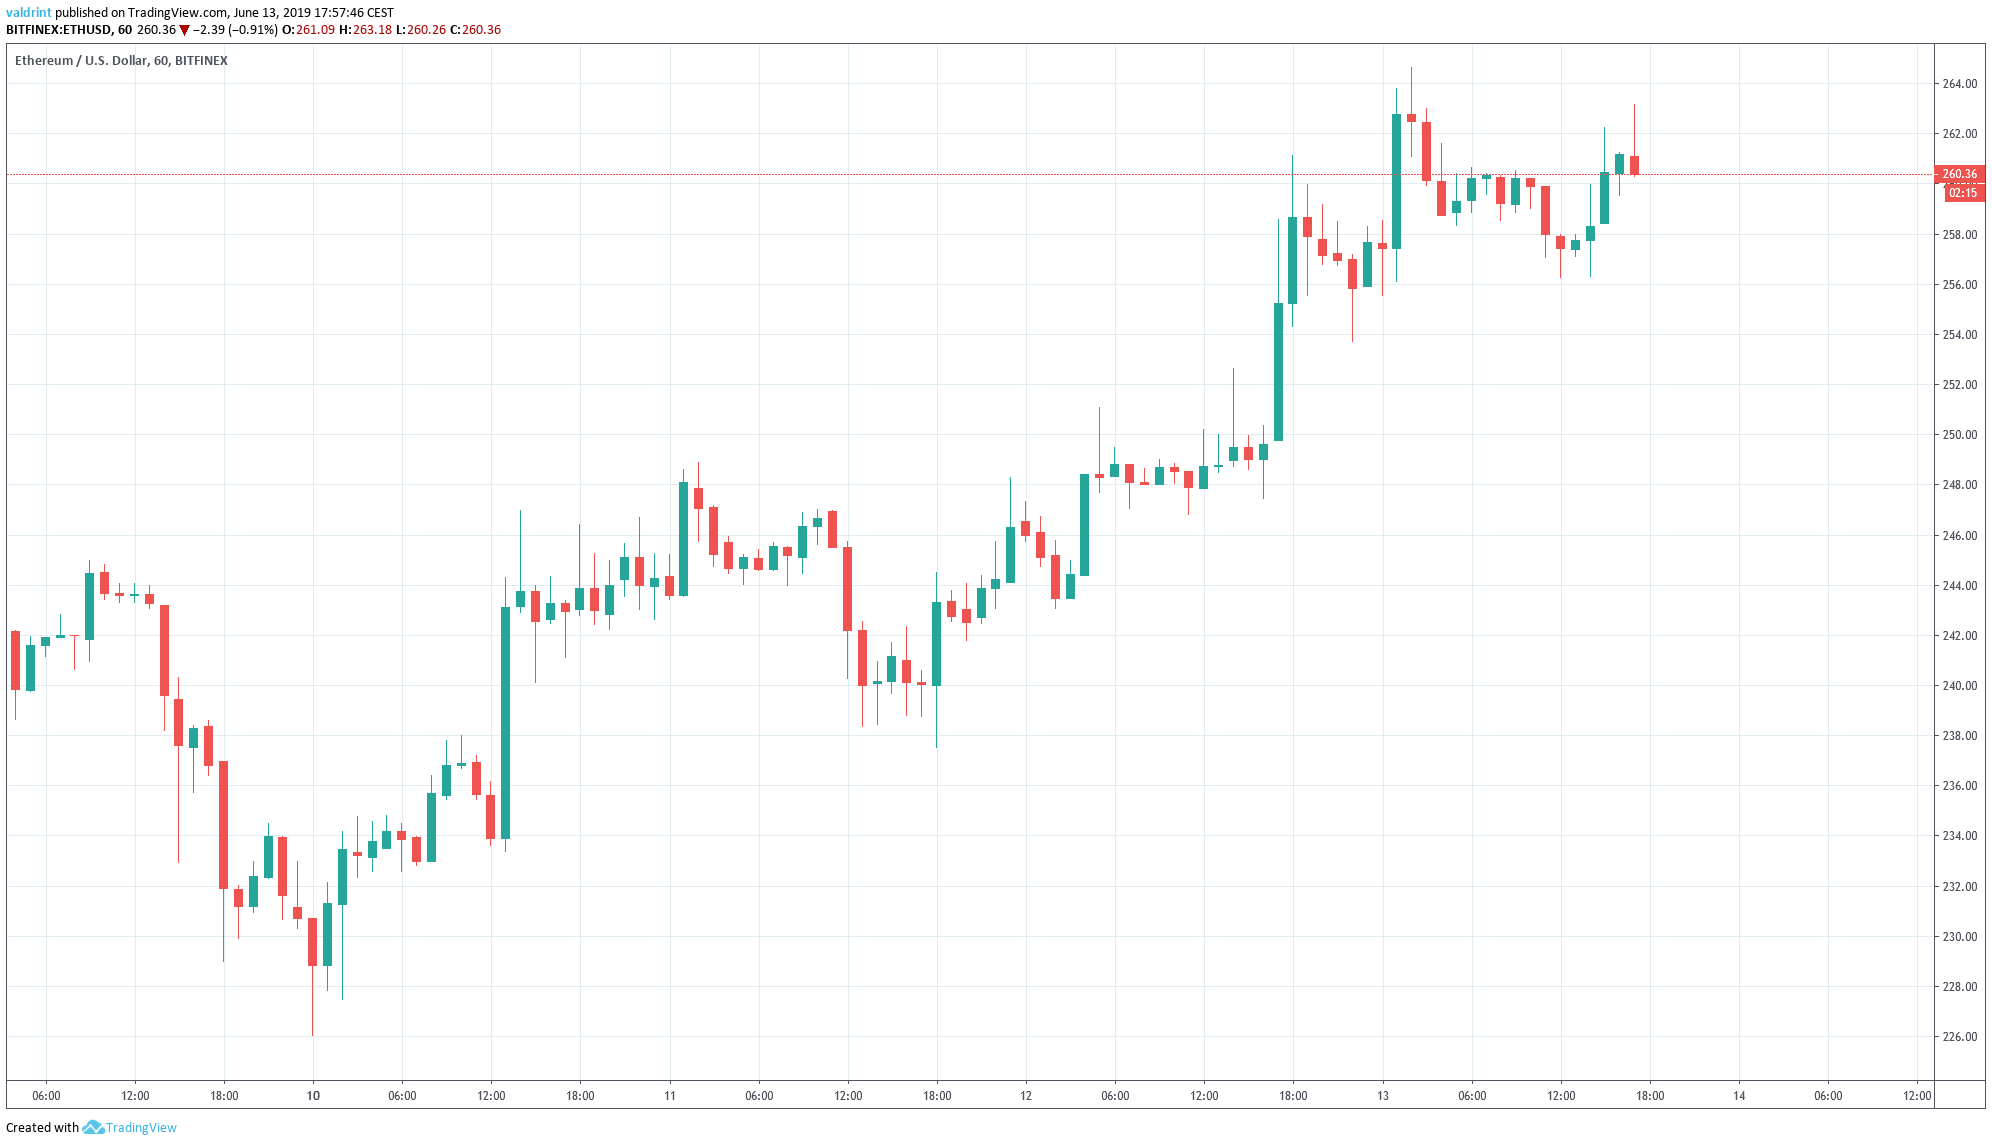
At the time of writing, the highest recorded price was $264 on June 13.
Below, we are going to analyze the Ethereum price (ETH) in different time-frames and alongside technical indicators in order to try and predict future movement.
Ethereum Price (ETH): Trends and Highlights for June 13
- ETH/USD reached a low on June 10
- It is trading inside a short-term ascending channel.
- It is possibly creating a head and shoulders pattern.
- The 10- and 20-day moving averages have made a bearish cross.
- There is support near $228.
Ethereum Price: Current Pattern
On June 10, the price of ETH/USD reached an hourly high of $226.1. The price has been increasing since, trading inside the ascending channel outlined below:
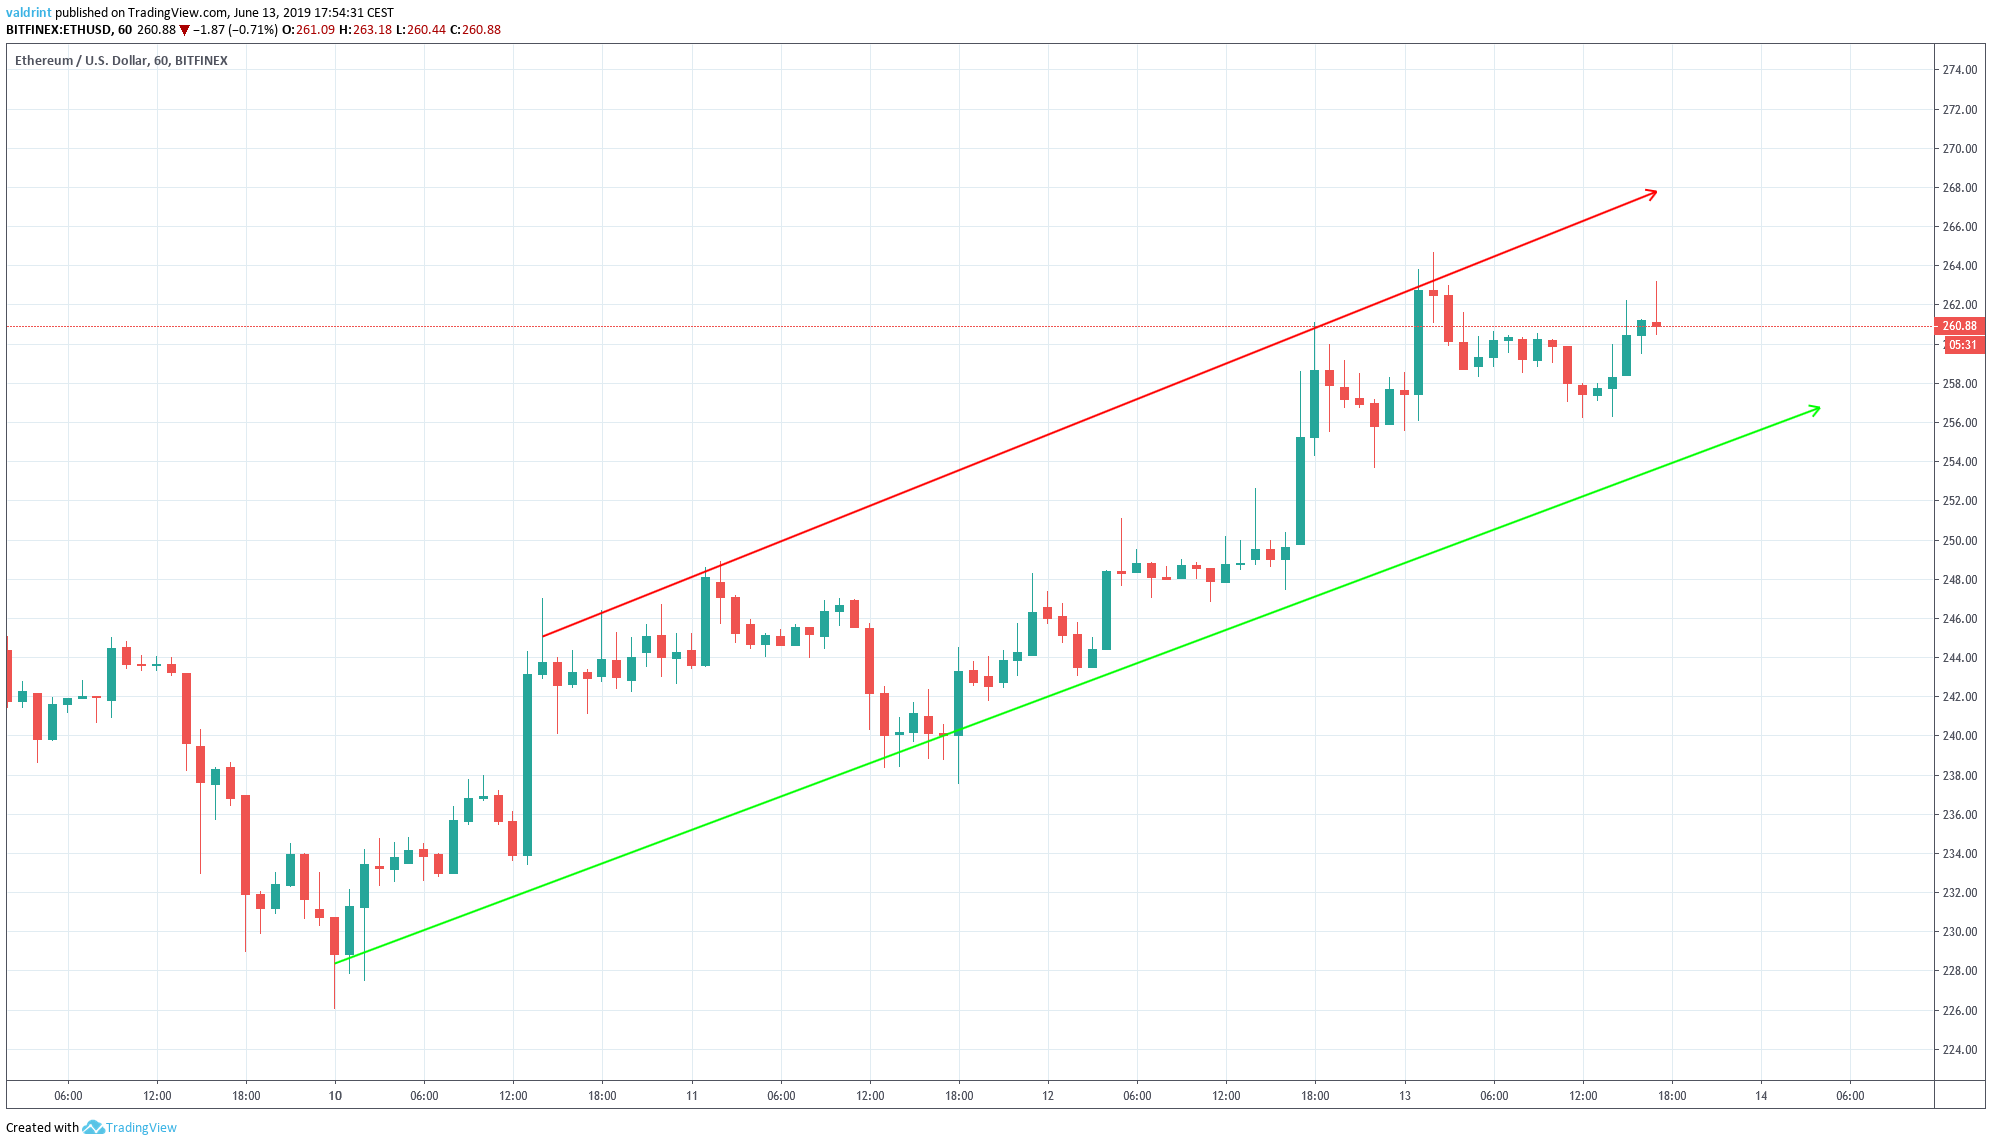
At the time of writing, the ETH price was trading in the middle of the channel.
The price reached the resistance line on June 13 and created a bearish doji.
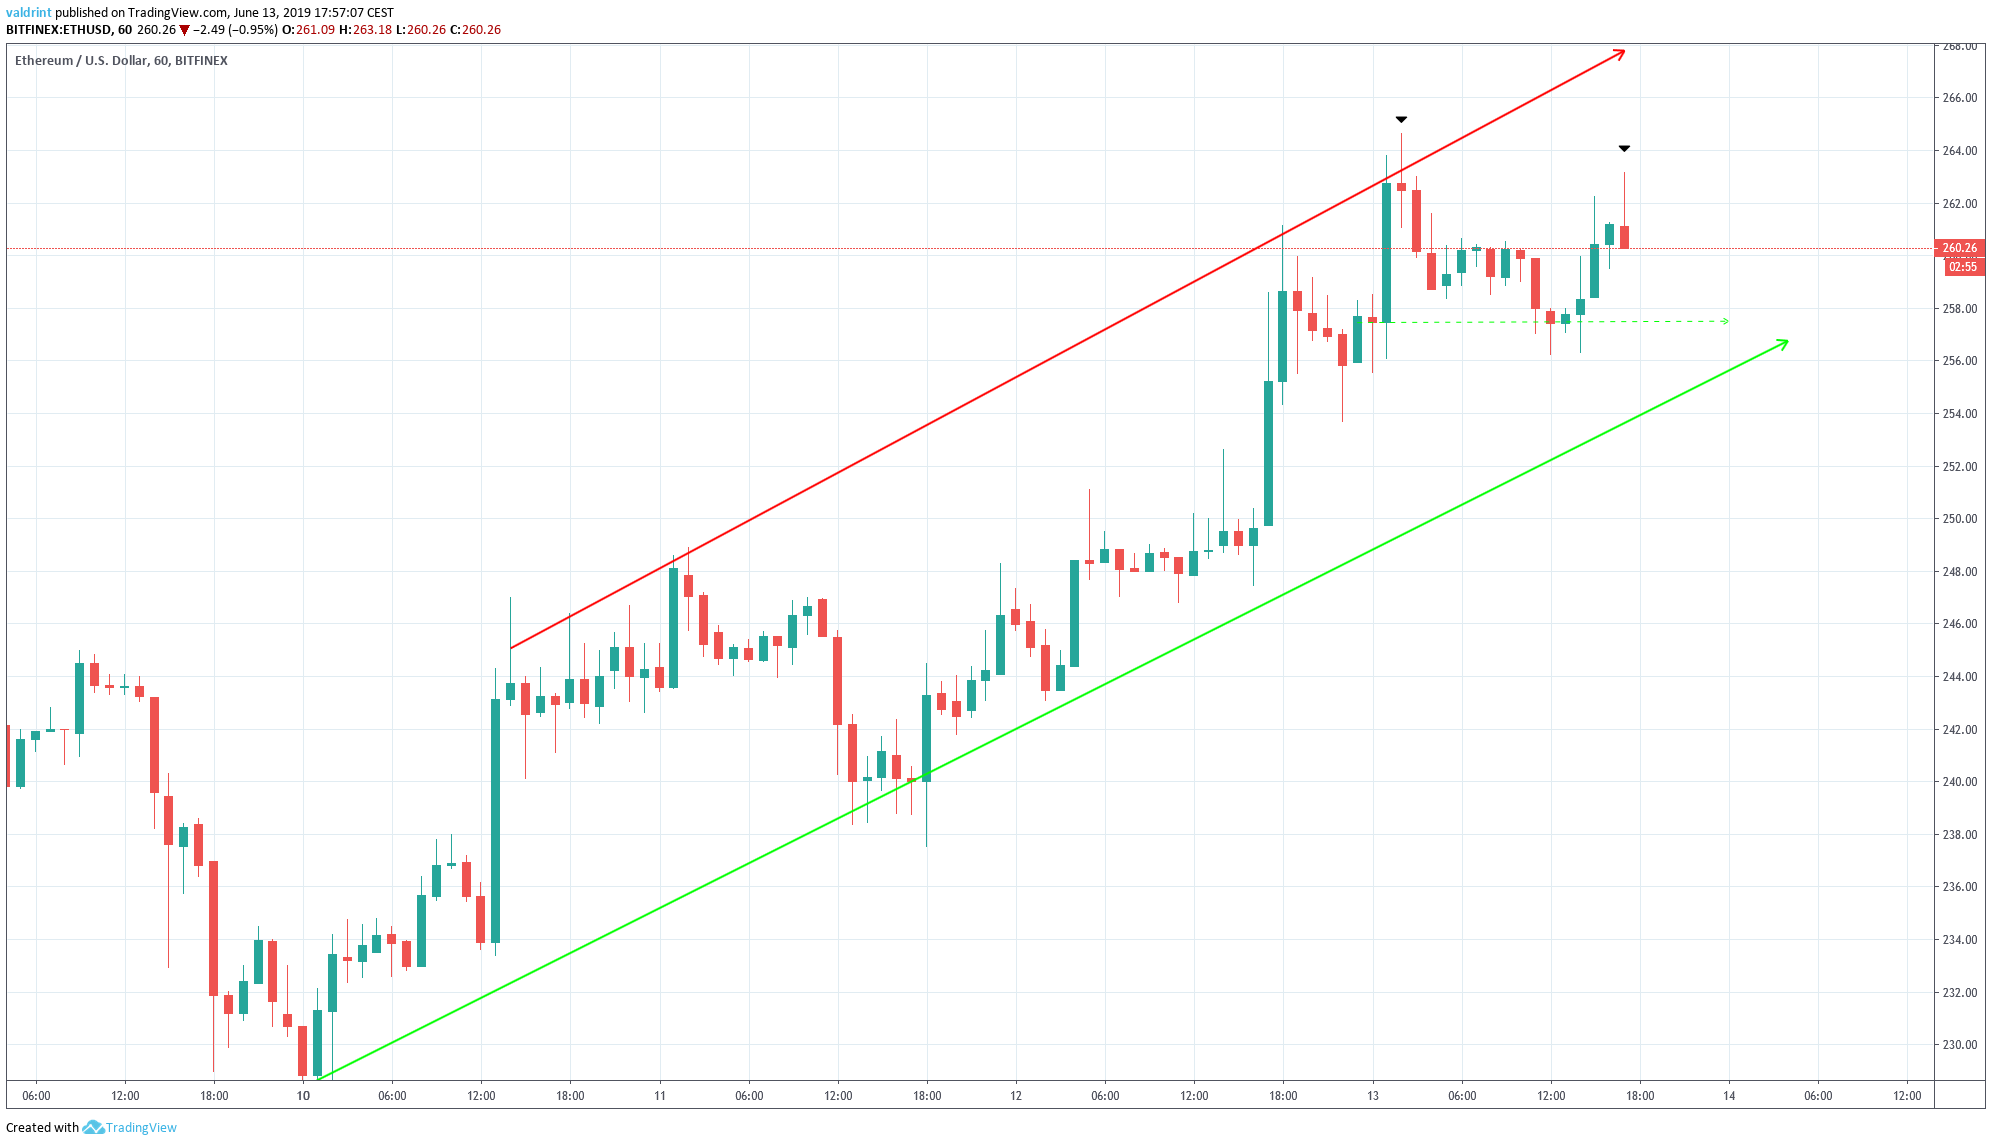
Afterward, the ETH price began to decrease. The current candle is shaping up to be a hanging man, which often indicates a reversal.
However, there has yet to be a close below the opening prices of the bullish candle prior to the doji. A close below $257 would be a confirmation that a short-term reversal has begun.
A look at technical indicators is required to assess this possibility.
Head And Shoulders
Since May 15, the Ethereum price has been following a horizontal support line at $229.
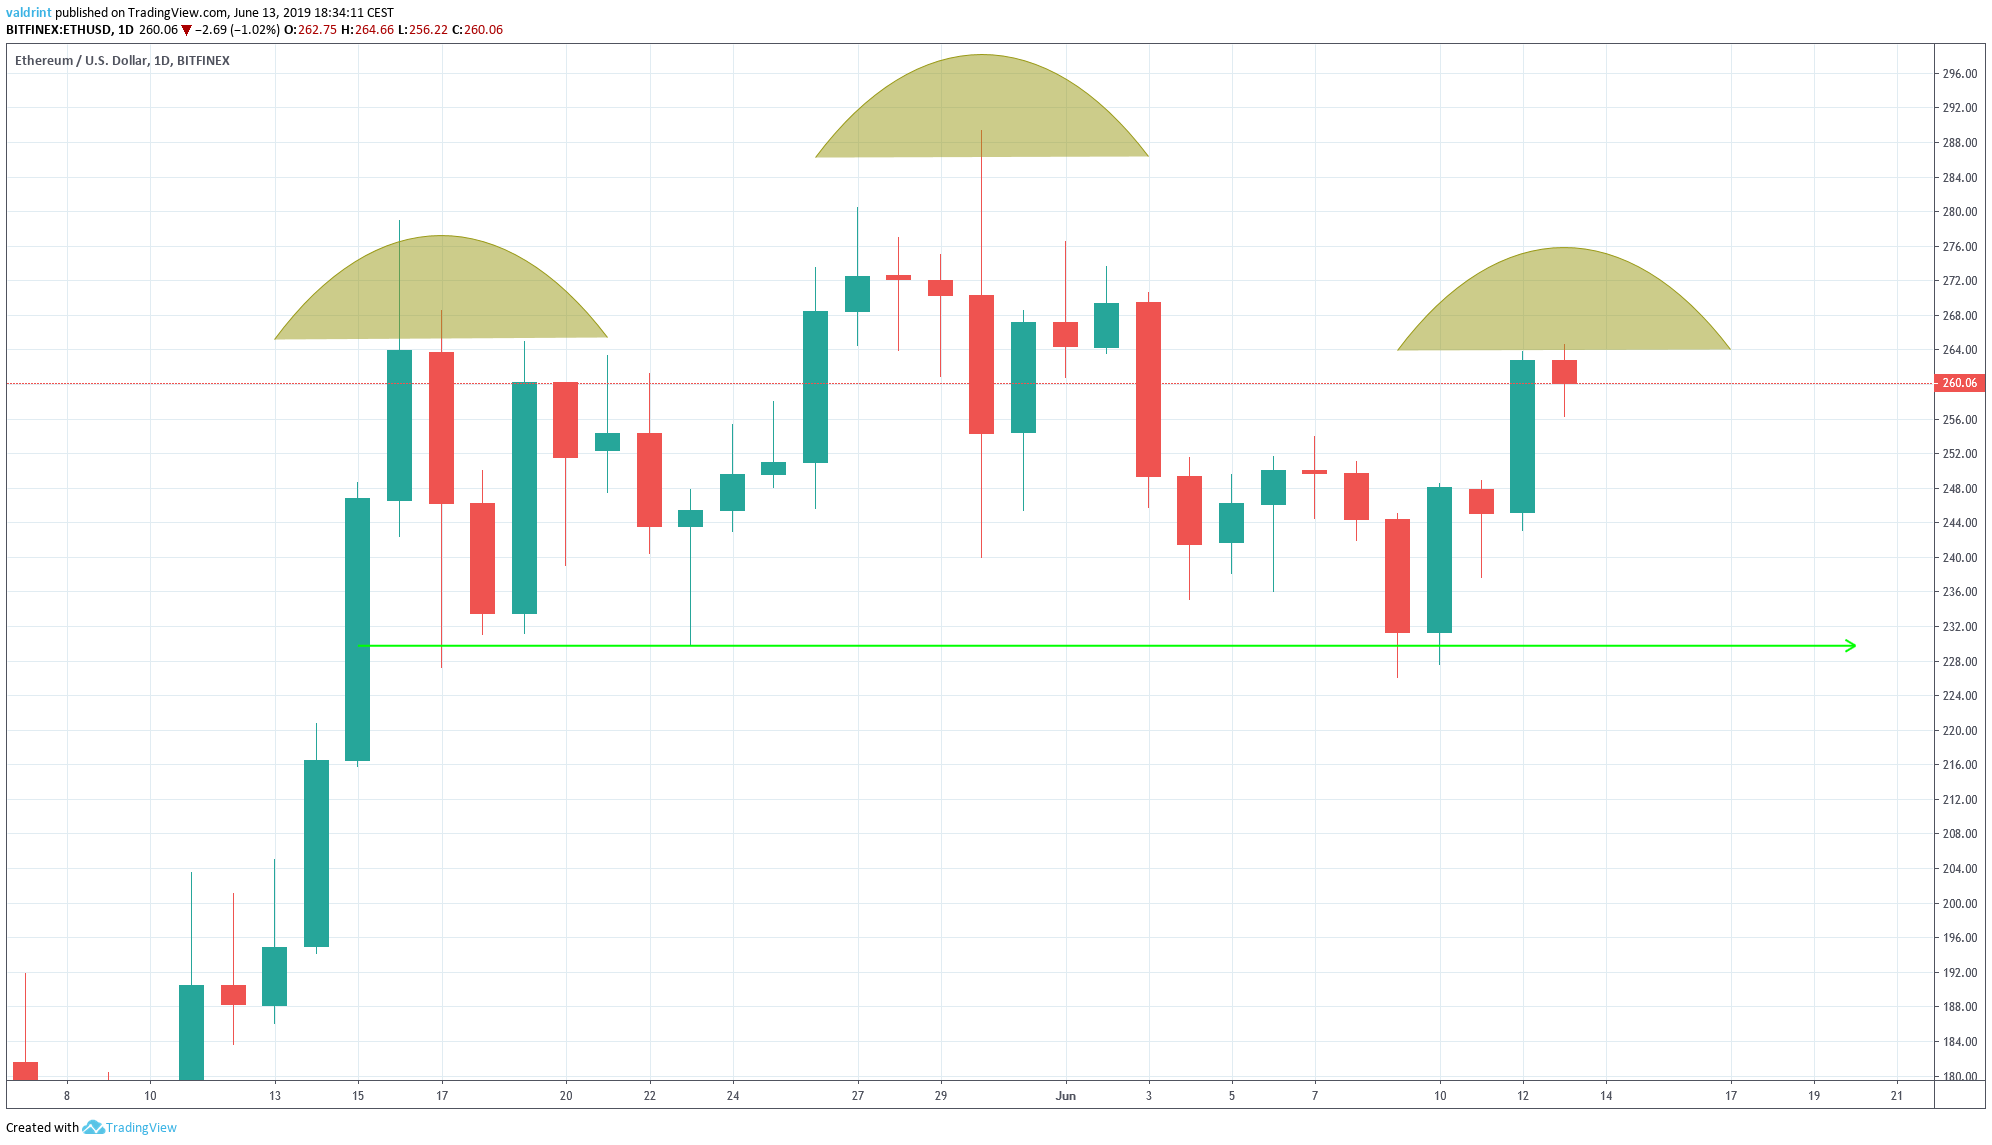
On May 17, the ETH price reached highs near $268. A higher high of $289 was reached on May 30. After each high, a decrease ensued and the price reached the support line.
At the time of writing, a similar move was occurring. The price has made a high of $264, similar to that on May 17.
These are characteristics of a head and shoulders (H&S) pattern. The high on May 17 was the left shoulder, succeeded by the head on May 30. Currently, we are possibly in the process of forming the right shoulder.
Furthermore, the volume has unfolded in a way which is standard for the H&S pattern.
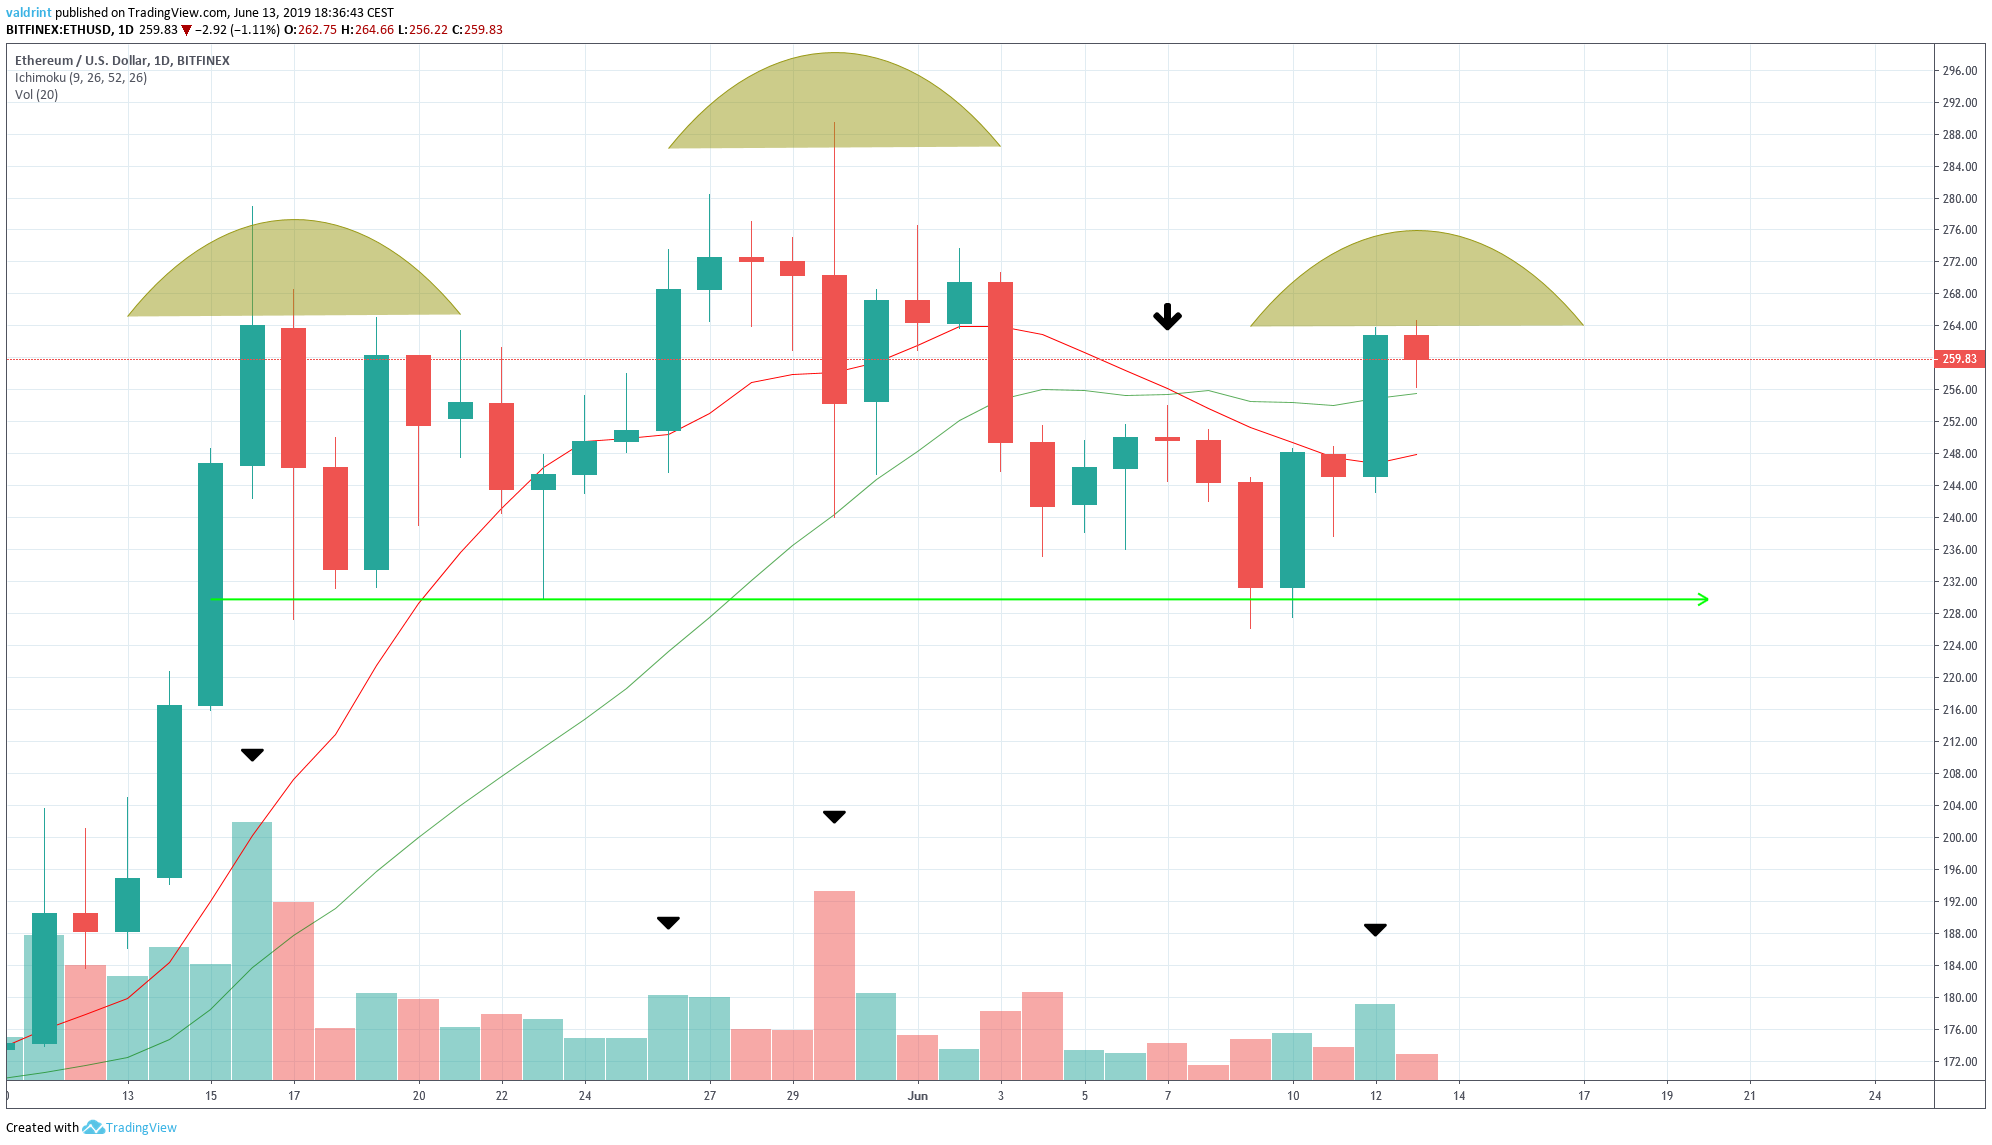
Leading up to the left shoulder, the volume was higher than during the advance to the head. Furthermore, it decreased during the lead up to the right shoulder.
During the decline from the head, the volume was higher than during the decline from the left shoulder. Final confirmation would come if the volume is higher during the decline from the right shoulder.
Finally, the 10-day MA cross below 20-day MA on June 7. This is known as a bearish cross and often indicates that a downtrend has begun. The use of this indicator supports the creation of the H&S pattern.
A breakdown below the support line of $229 could lead to a rapid price decrease.
Ethereum Price (ETH): Reversal Areas
One support area is traced for ETH/USD below:
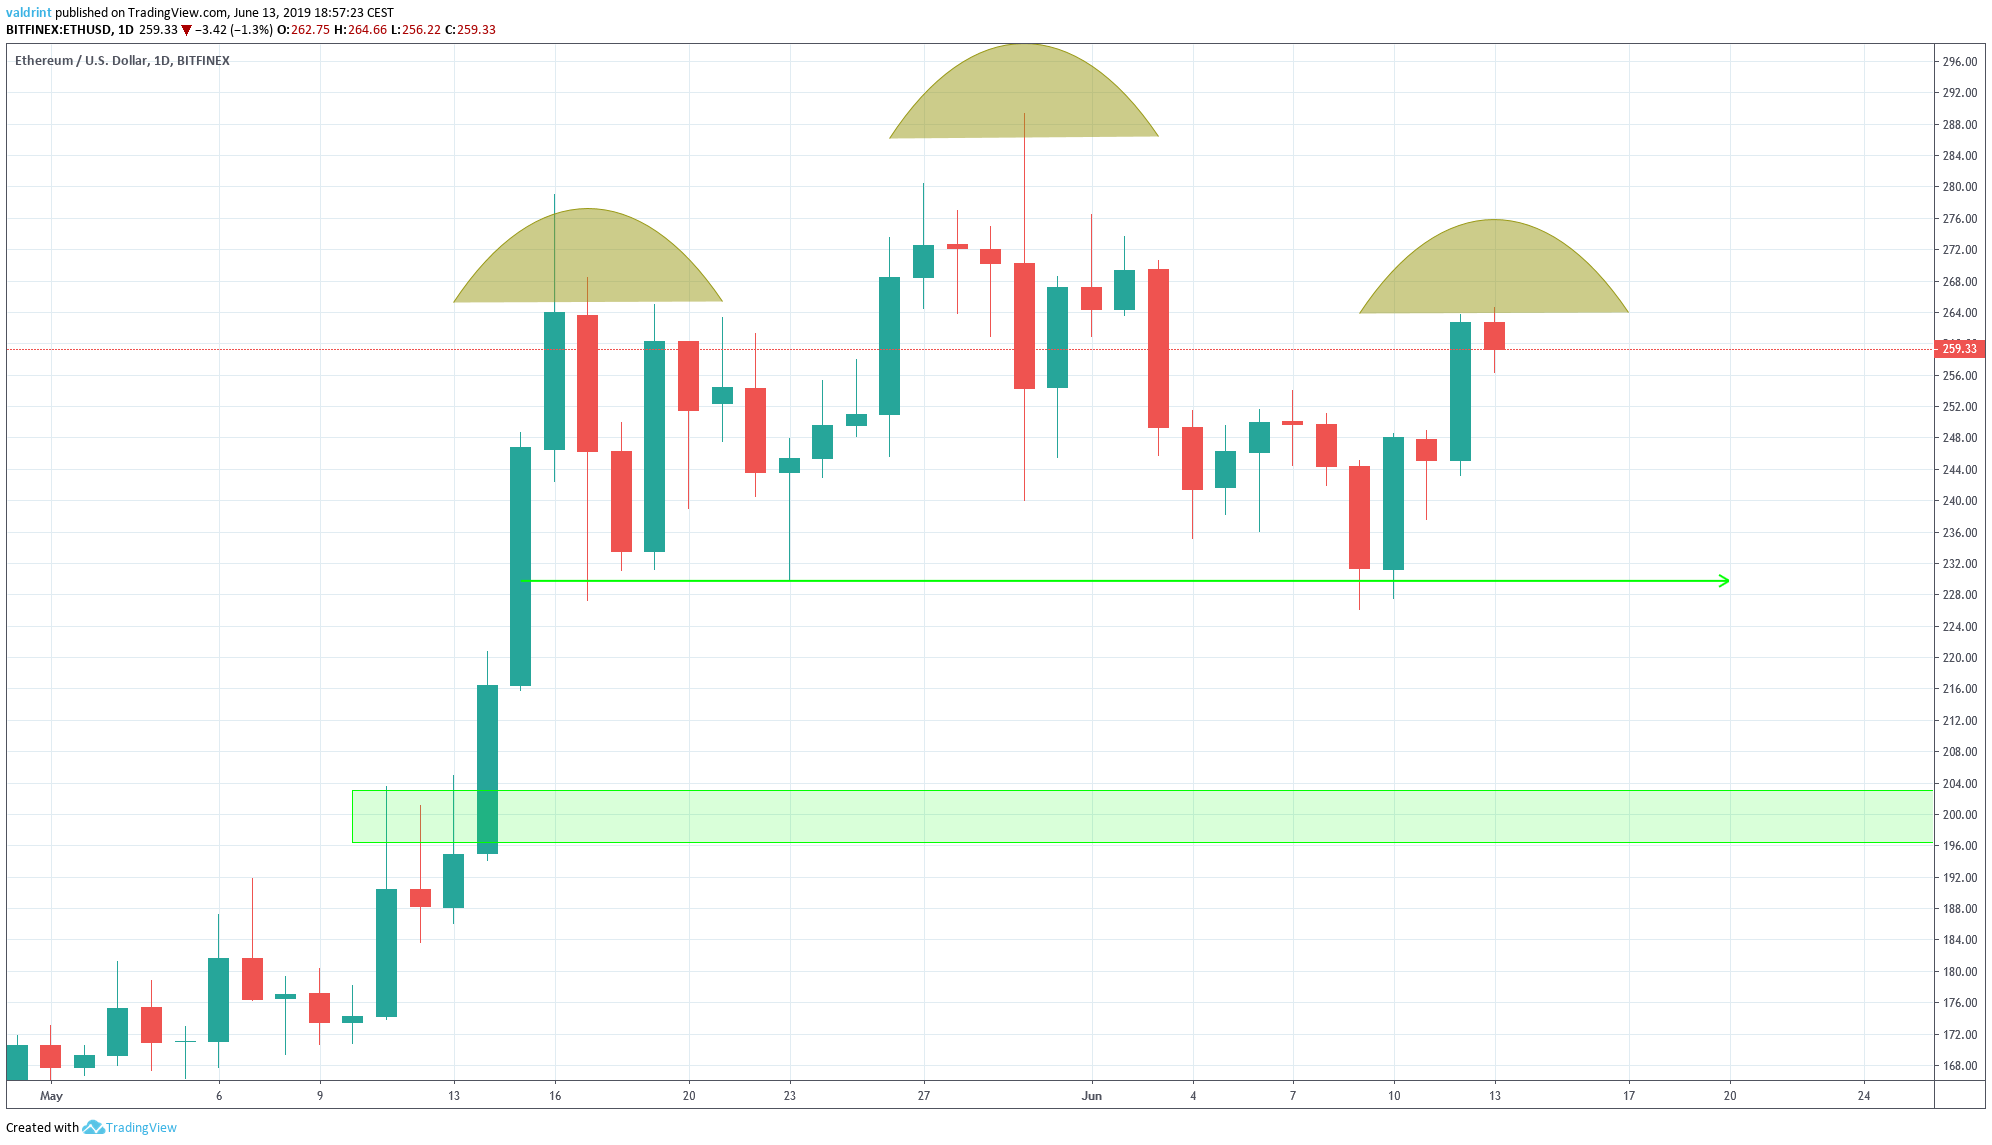
The closest support area is found near $200. If the price breaks down below the support line, the price is likely to reach this area. An analysis of technical indicators supports this possibility, however not necessarily in the short-term.
Summary
To conclude, the price of Ethereum (ETH) is trading inside a short-term ascending channel. It is also possibly creating a head and shoulders pattern, which is a bearish reversal pattern. An analysis of technical indicators supports price decreases.
Do you think the Ethereum price (ETH) will reach the support line? Let us know your thoughts in the comments below!


