Ethereum (ETH) has been increasing since Jan. 24 and has shown several strong bullish reversal signs. It’s currently trading at an important resistance level, a breakout above which would confirm that the correction is complete.
The weekly Ethereum chart provides a mostly bullish outlook.
The price has bounced twice at the $2,400 horizontal support area (green icons). The area had previously acted as resistance and has now turned to support. The bounce put an end to the decrease that had been ongoing since the $4,868 all-time high price.
Technical indicators are also firmly bullish. The MACD is increasing, is positive, and has created three successive higher momentum bars. All these are considered common signs of bullish trends.
The RSI is also increasing and is currently trending above 50.
Therefore, the outlook from the weekly time frame is firmly bullish.
Future ETH movement
Cryptocurrency trader @PostyXBT tweeted an ETH chart, stating that a bullish close could take the price all the way to $3,400.
Since the tweet, the price has already broken out and reached the target.
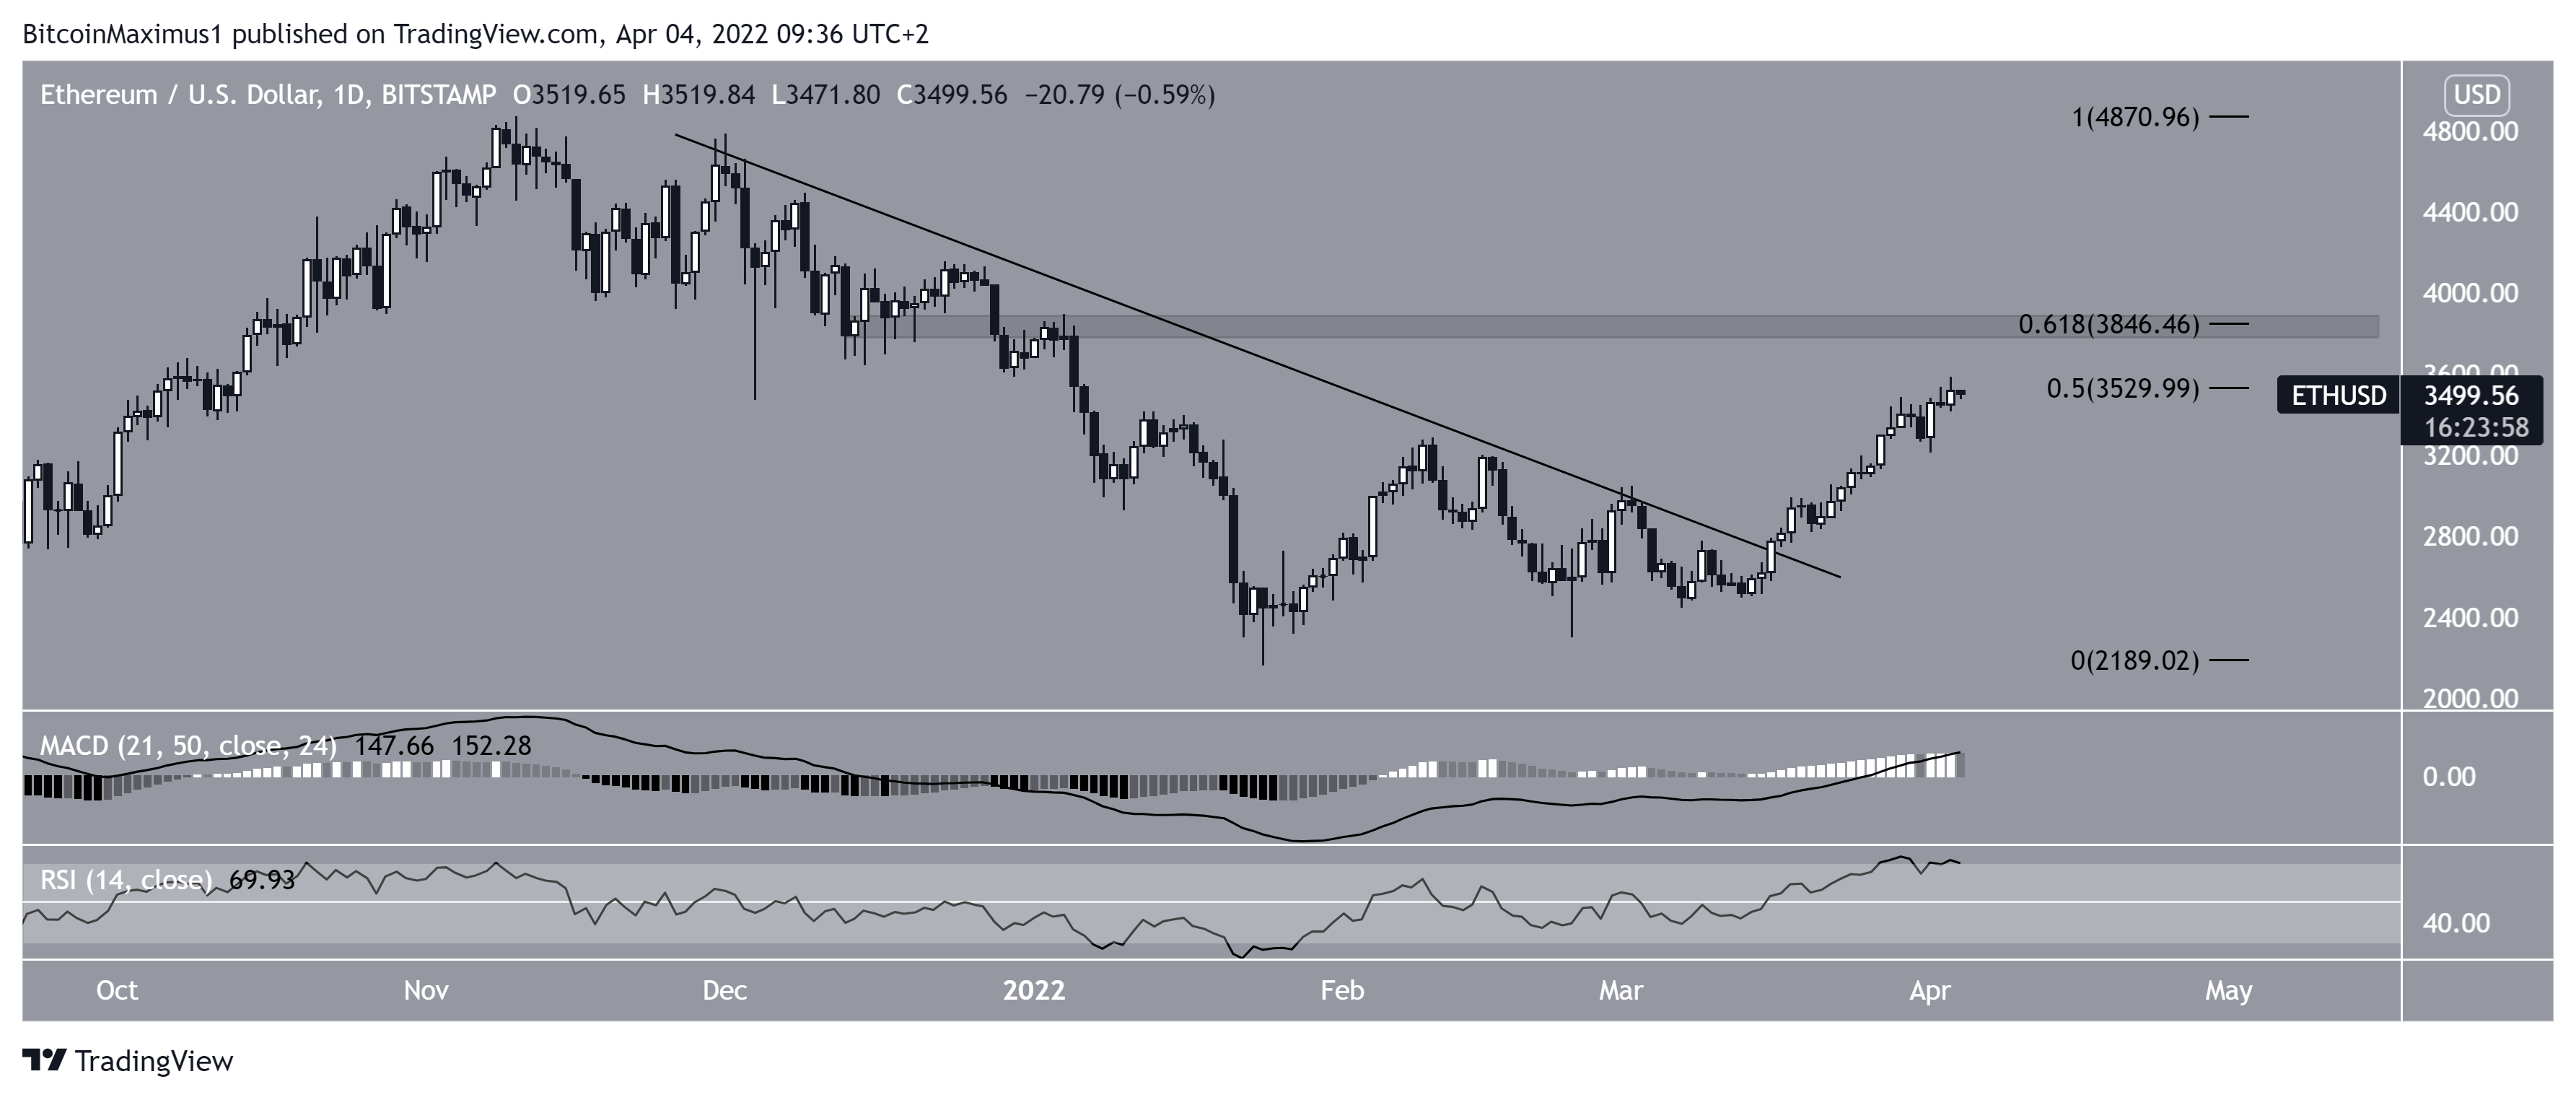
Furthermore, the price action and technical indicators in the daily time frame support the continuation of the upward movement.
ETH has broken out from a descending resistance line that had been in place since the aforementioned all-time high. This is a sign that the correction has ended.
Secondly, similar to the weekly time frame, both the MACD and RSI are moving upwards and are in bullish territory.
The closest resistance levels are found at $3,530 and $3,850. The latter is both the 0.618 Fib retracement resistance level and a horizontal resistance area. Therefore, it’s a crucial level to watch that is likely to provide strong resistance.
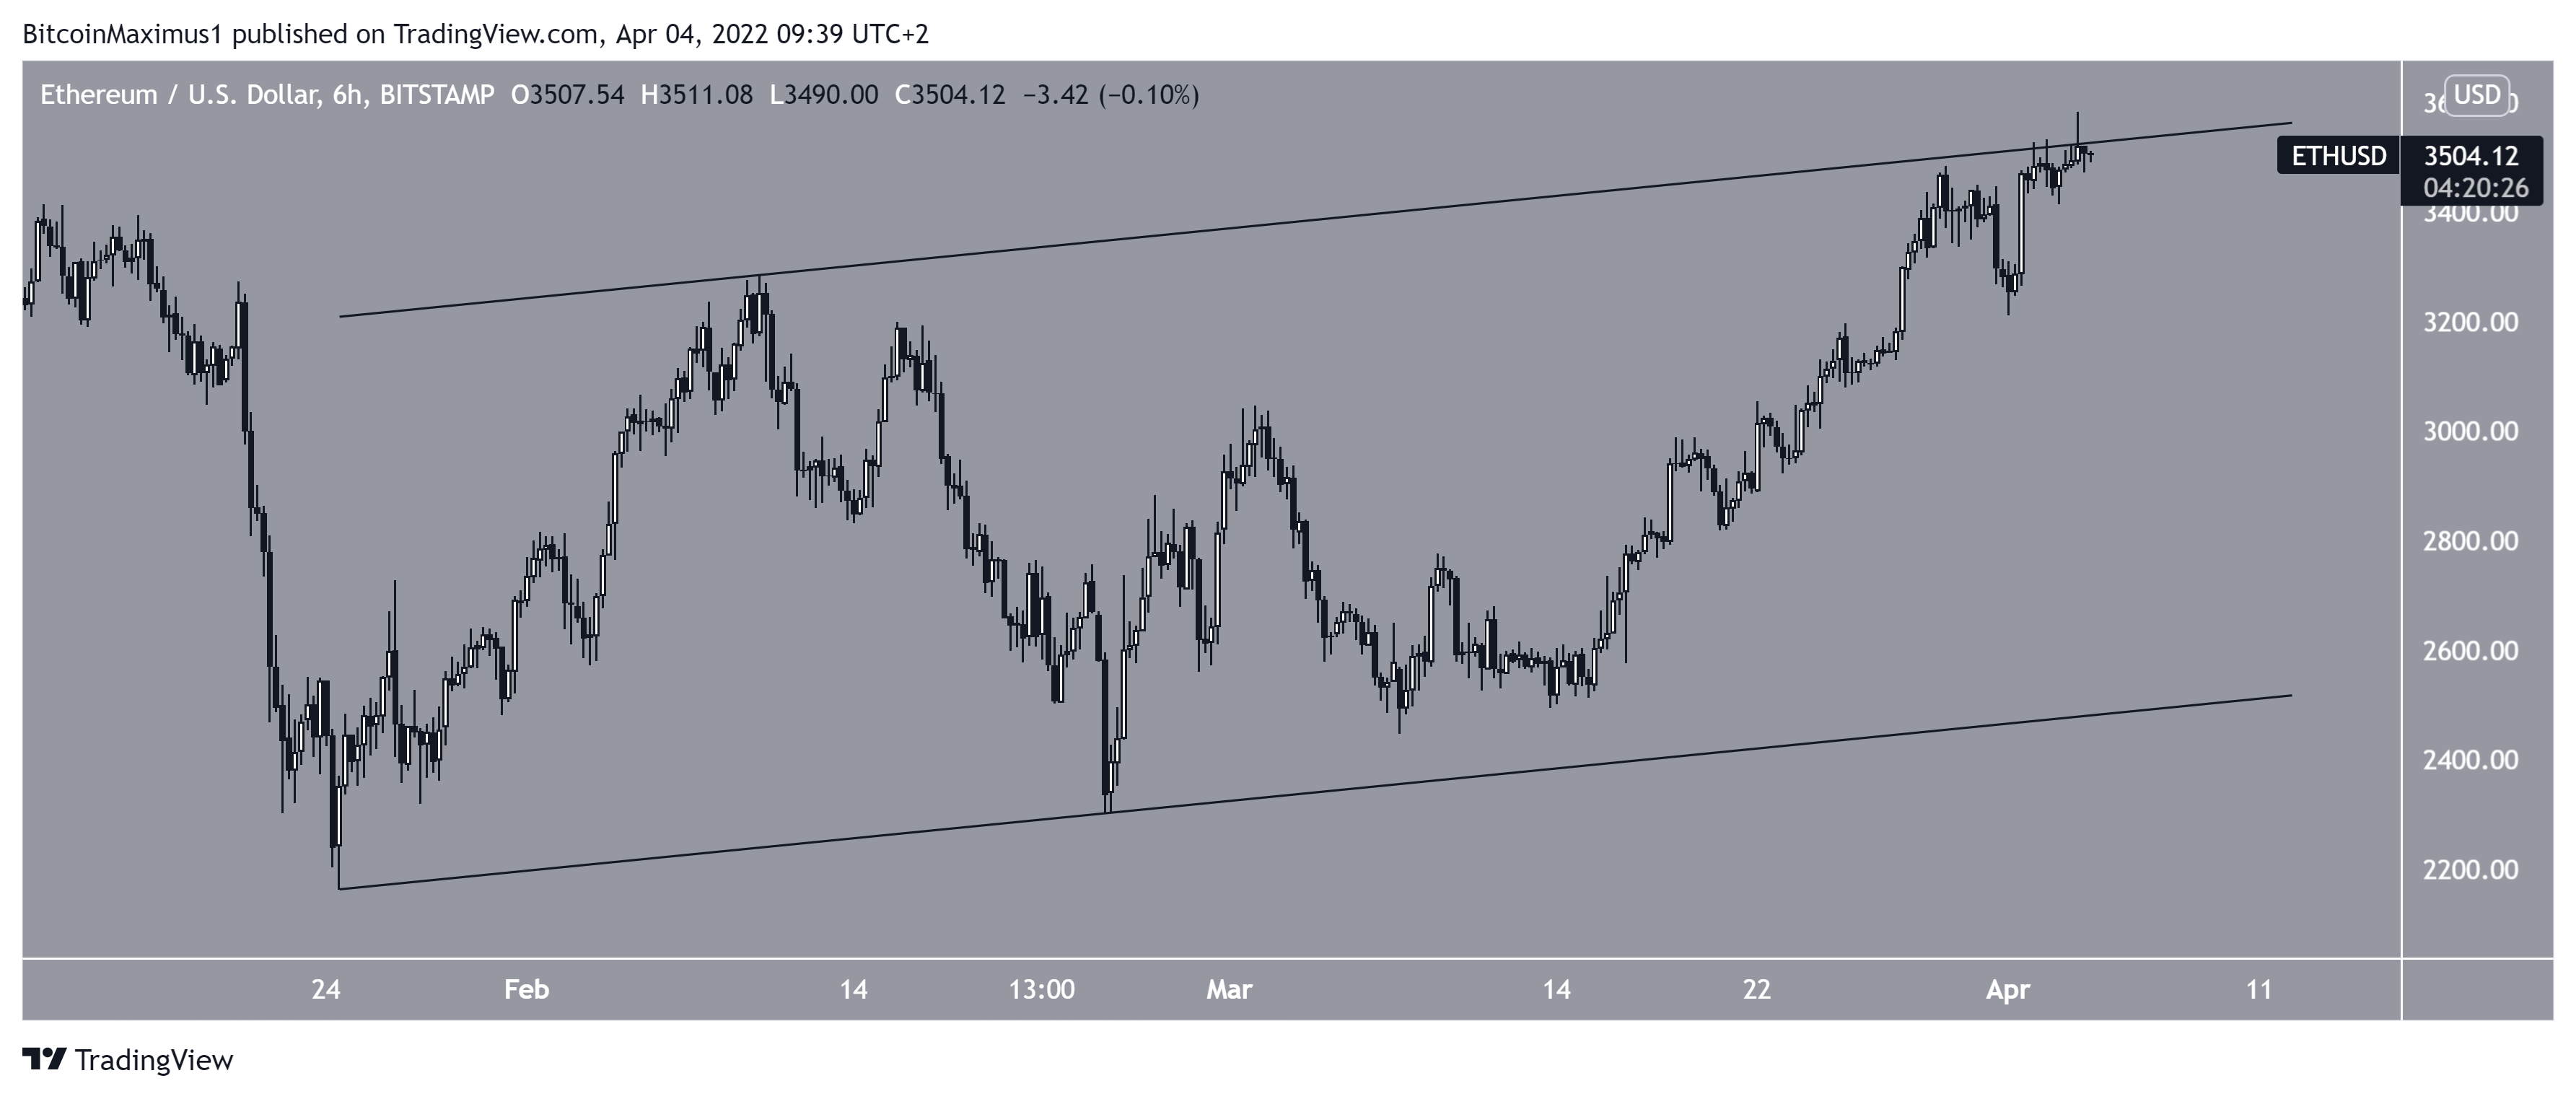
The six-hour chart shows that ETH has been trading inside an ascending parallel channel since Jan. 24. Currently, it is trading right just beneath the channel’s resistance line.
A breakout from the channel would confirm that the correction is complete and the trend is still bullish.
Wave count analysis
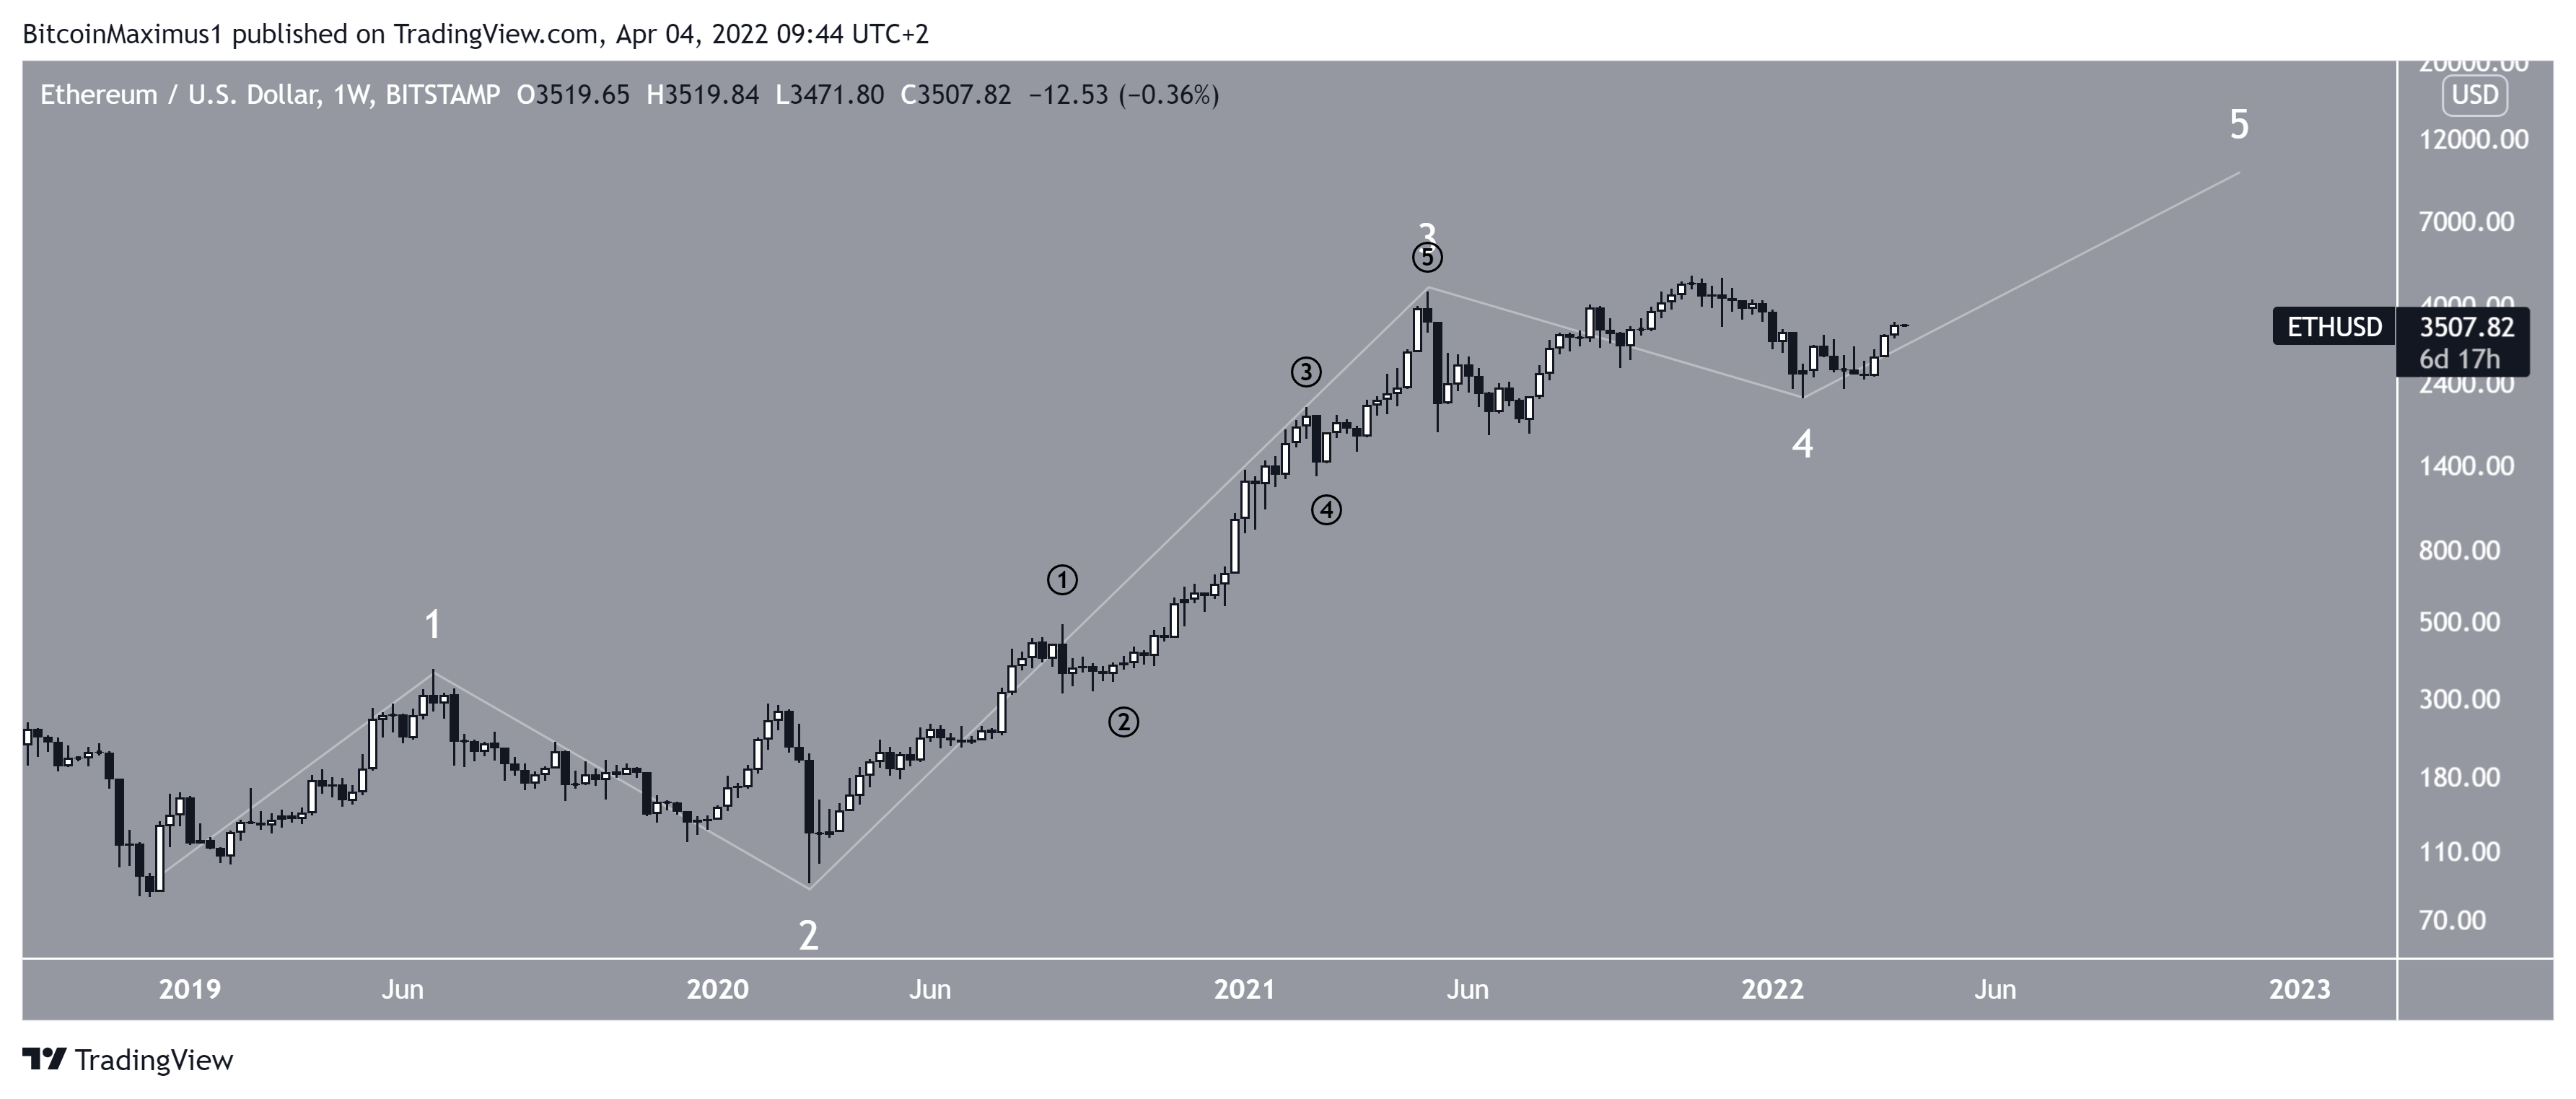
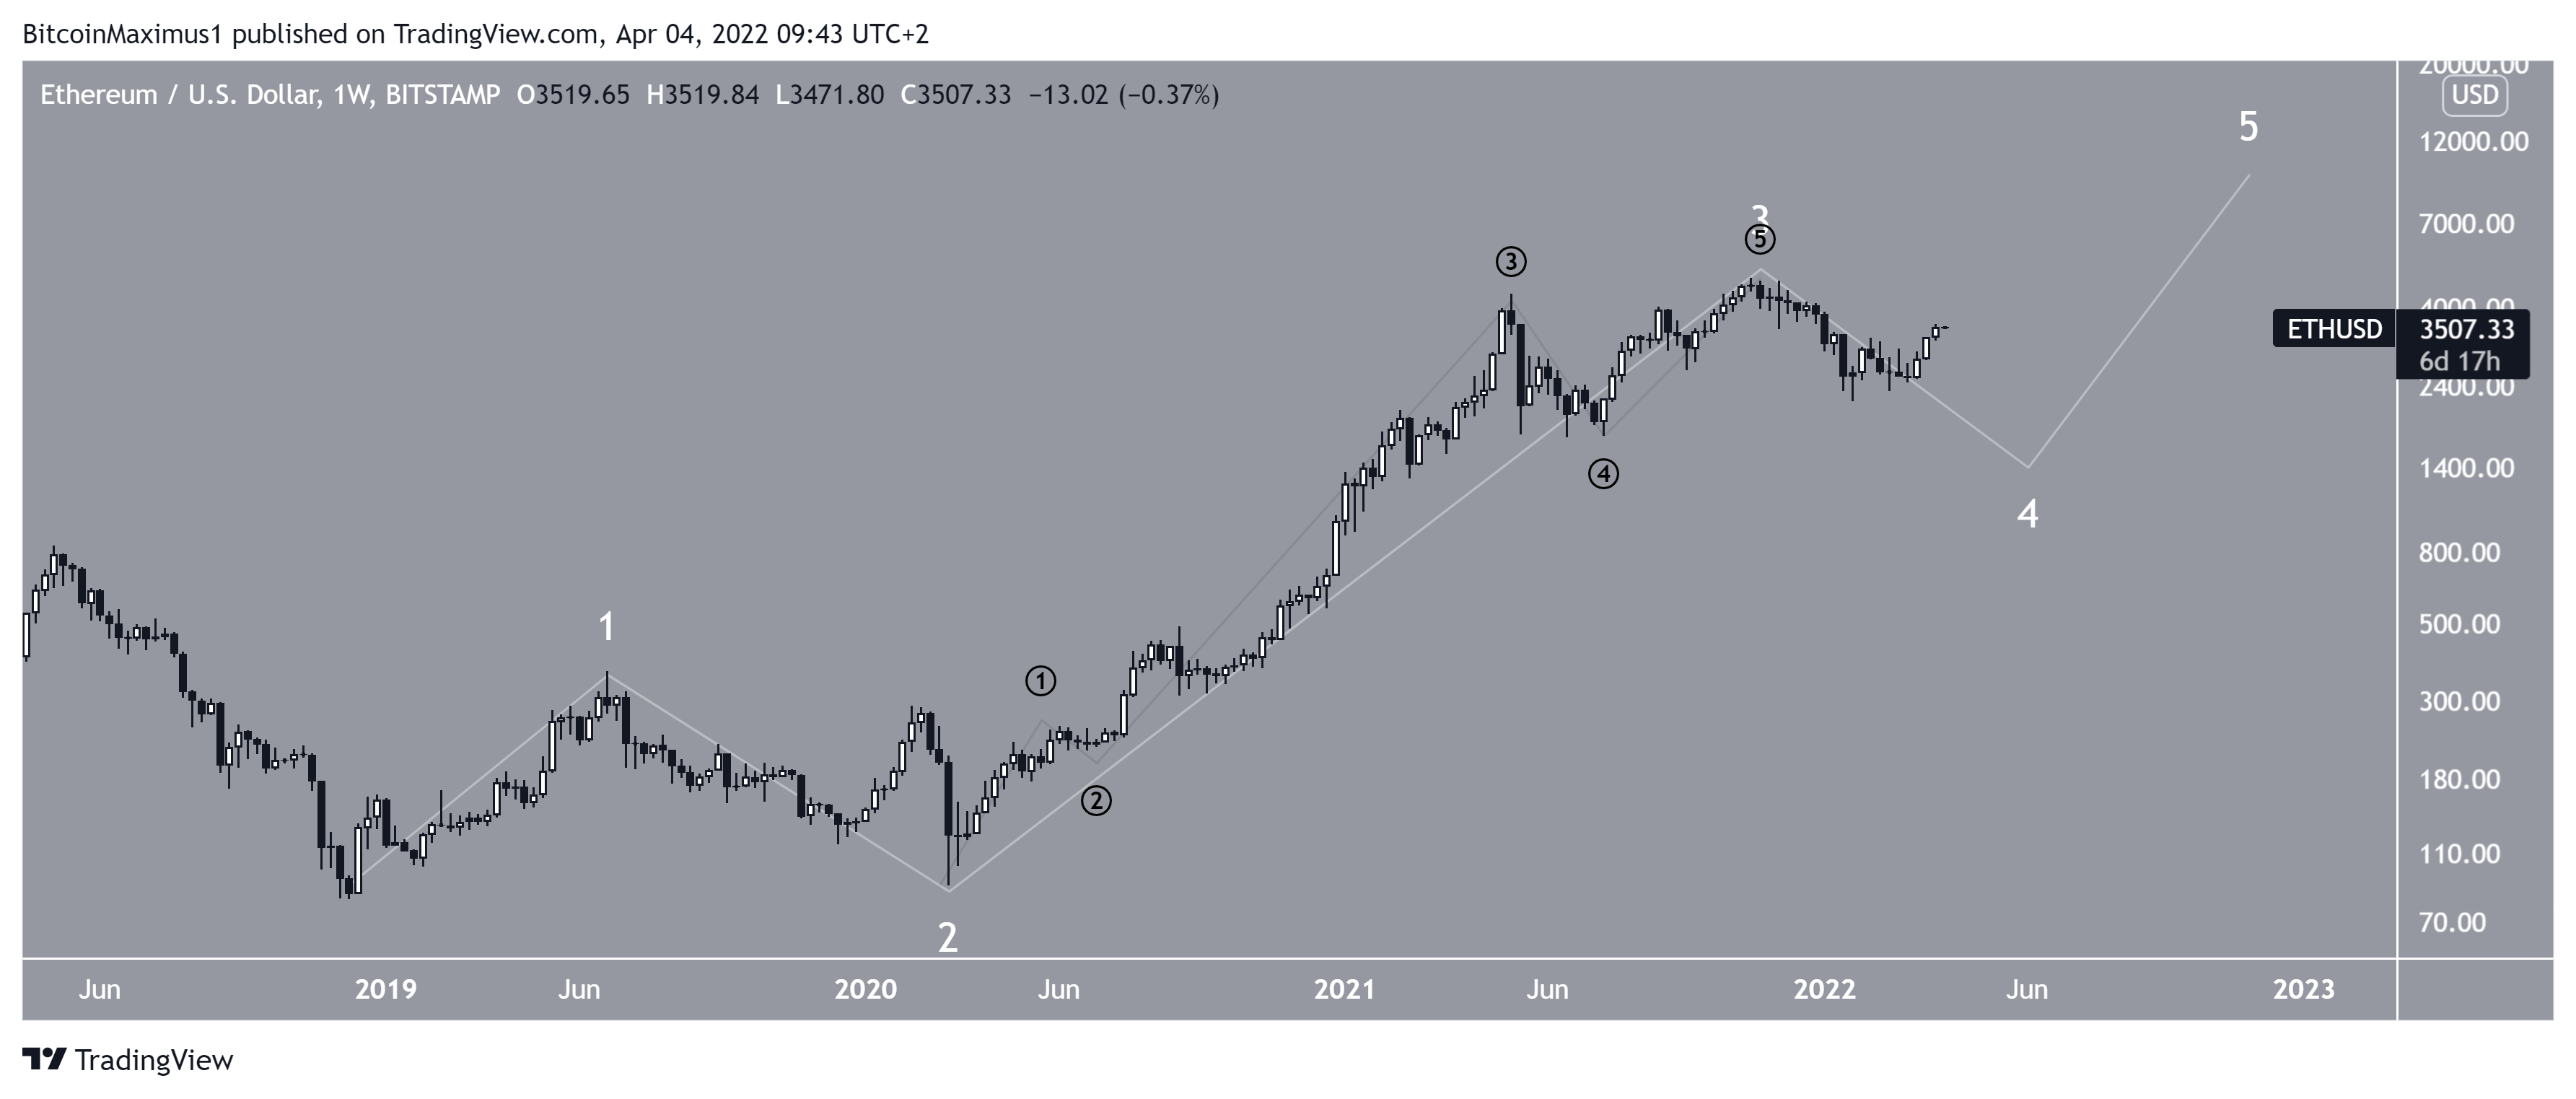
There are two main possibilities for the long-term wave count. Measuring from March 2020, the first suggests that ETH has completed a long-term wave four (white) and has now begun wave five.
The second suggests that ETH is still in wave four and the upward movement will resume after another drop.
A closer look at the price action supports the first scenario, in which wave four is complete.
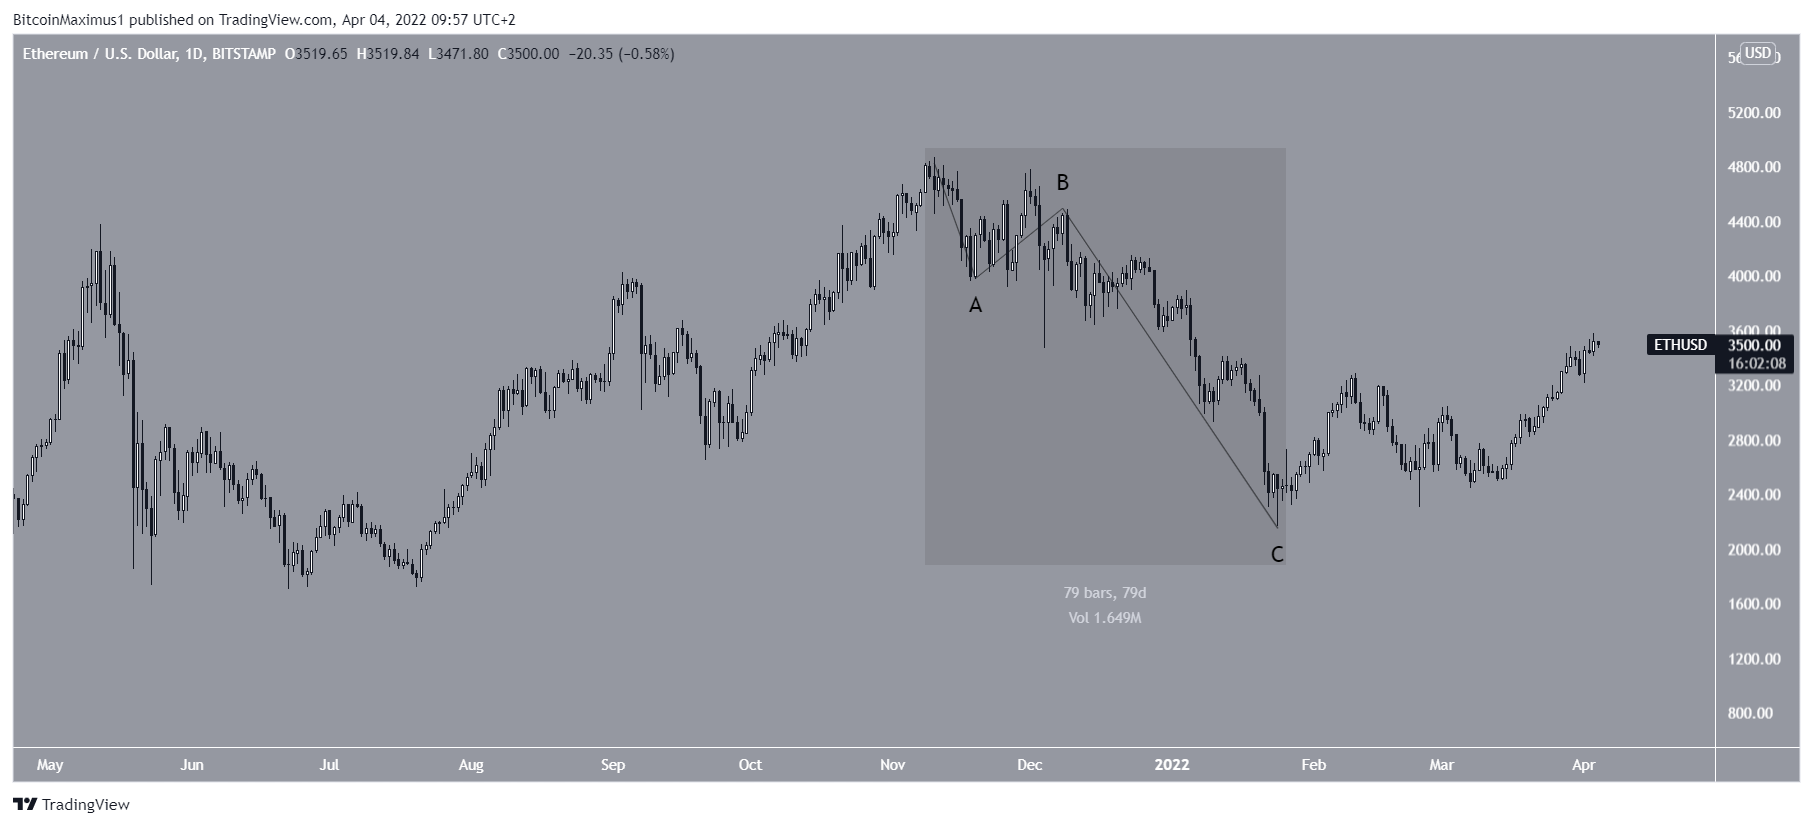
The main reason for this is that the decrease since the all-time high (highlighted) looks more like an A-B-C corrective structure rather than a bearish impulse.
If ETH were to continue decreasing, the downward move would have been expected to be an impulse.
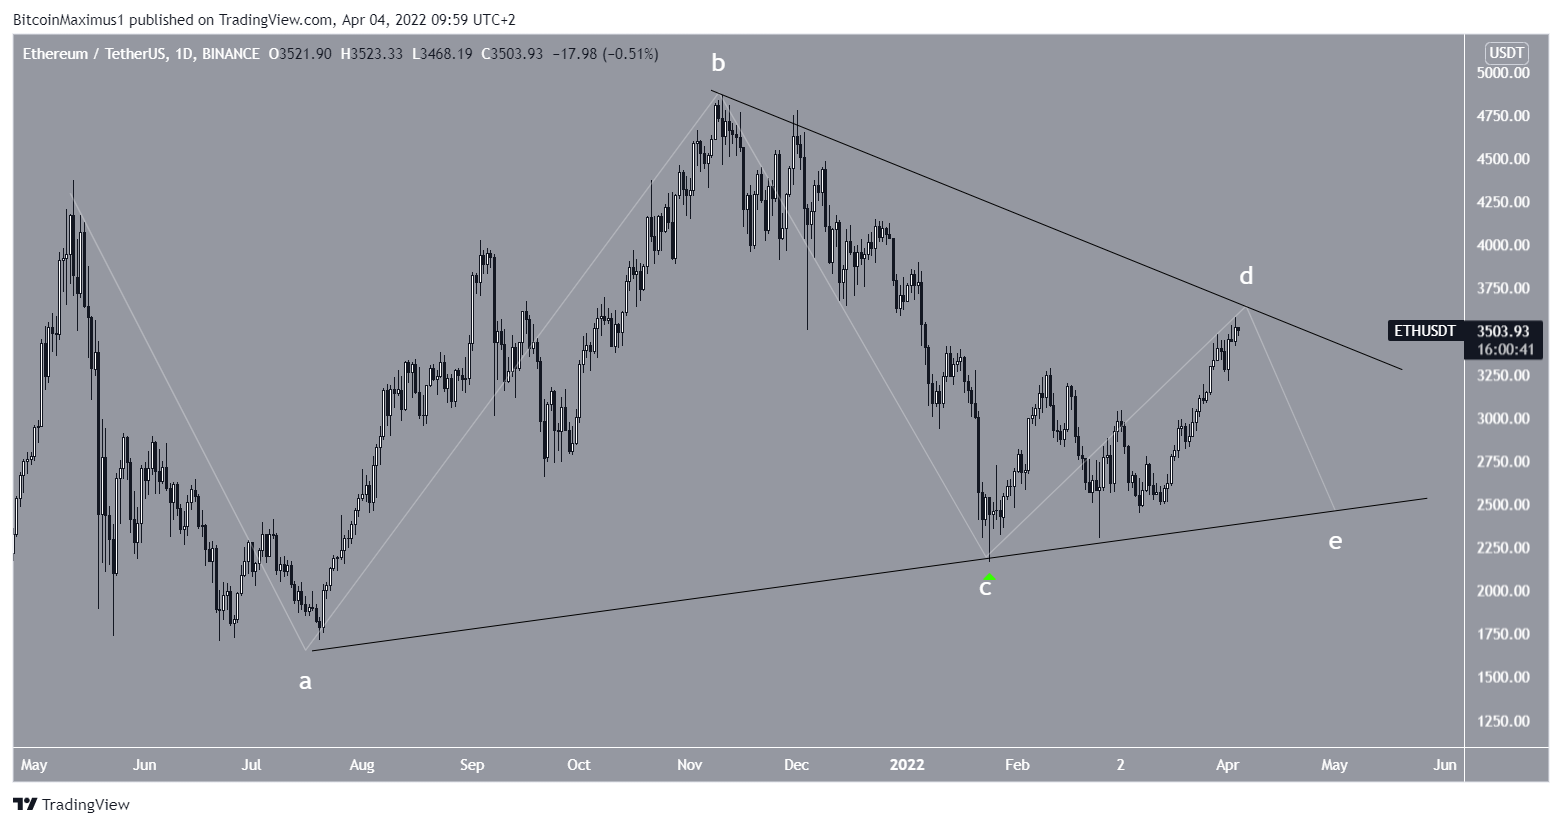
While it’s possible that the entire correction will develop into a triangle, in which case another downward movement would follow, it seems likely that the Jan. 24 low (green icon) will not be broken.
For BeInCrypto’s latest Bitcoin (BTC) analysis, click here
Disclaimer
In line with the Trust Project guidelines, this price analysis article is for informational purposes only and should not be considered financial or investment advice. BeInCrypto is committed to accurate, unbiased reporting, but market conditions are subject to change without notice. Always conduct your own research and consult with a professional before making any financial decisions. Please note that our Terms and Conditions, Privacy Policy, and Disclaimers have been updated.


