
The Ethereum (ETH) price increased by more than 40% over the past few weeks and is approaching its all-time high levels.
While the long-term trend is likely still bullish, a short-term decrease is expected before Ethereum resumes its upward movement.
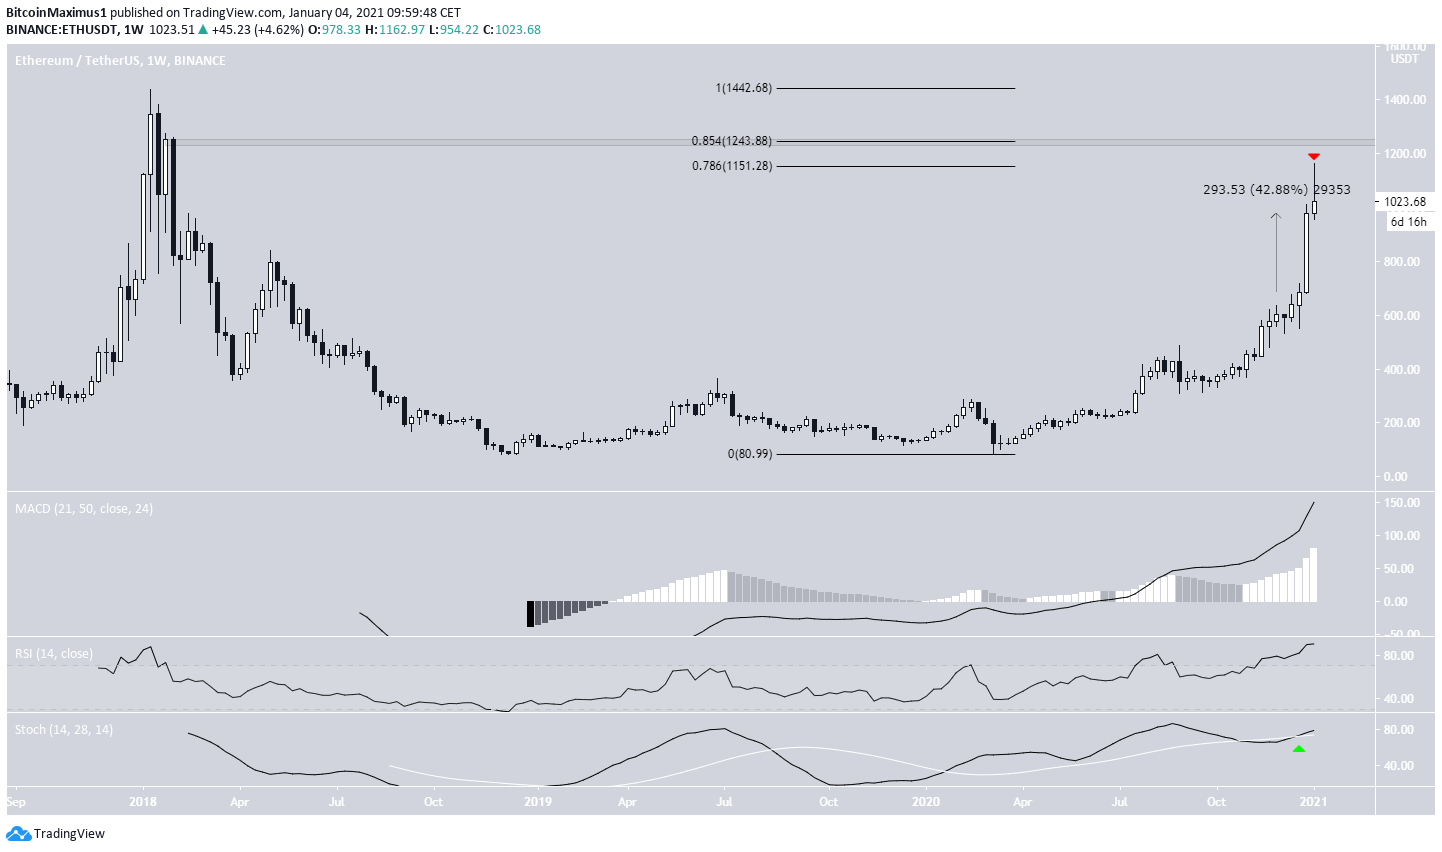
Long-Term Ethereum Levels
The ETH price increased considerably during the week of Dec. 27 – Jan. 4, doing so by nearly 43%. ETH continued its increase earlier today to reach a high of $1,162.97. However, the higher prices could not be sustained, and ETH created a long upper wick and fell back below $1,000.
The $1,162 high also coincides with the 0.786 Fib retracement level at $1,150. If ETH continues increasing, the next resistance would be found at $1,250, before the all-time high price of $1,440.
Despite showing overbought levels, technical indicators are still bullish, indicating that ETH is likely to continue increasing and eventually reach a new all-time high in the process.
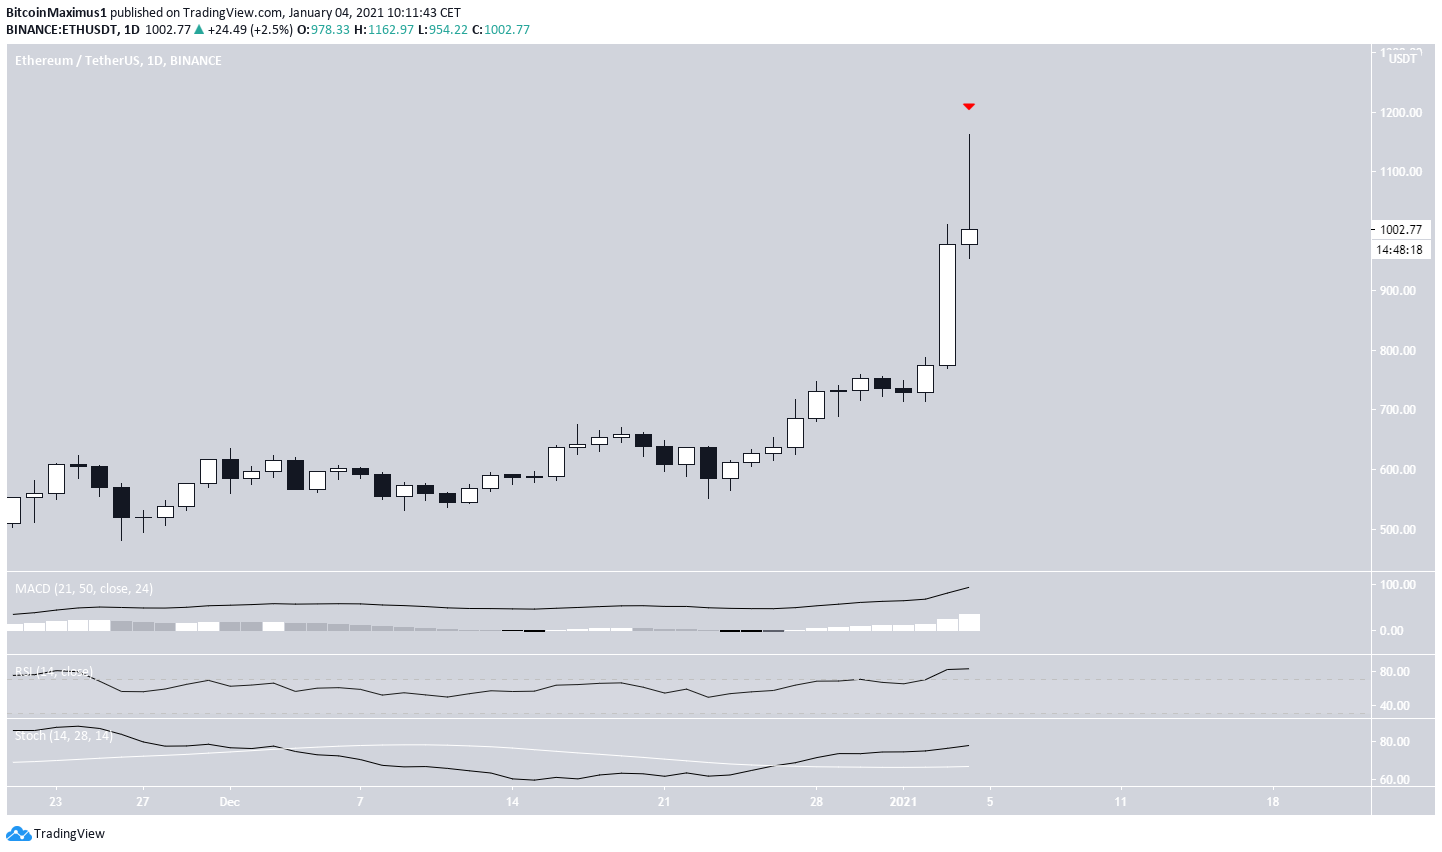
Future Movement
Similar to the weekly chart, indicators in the daily time-frame are still bullish. However, the current daily candlestick is shaping up to be a shooting star, which is normally considered a bearish reversal candlestick.
The daily Ethereum close will be extremely important in helping to determine if ETH has reached its top.
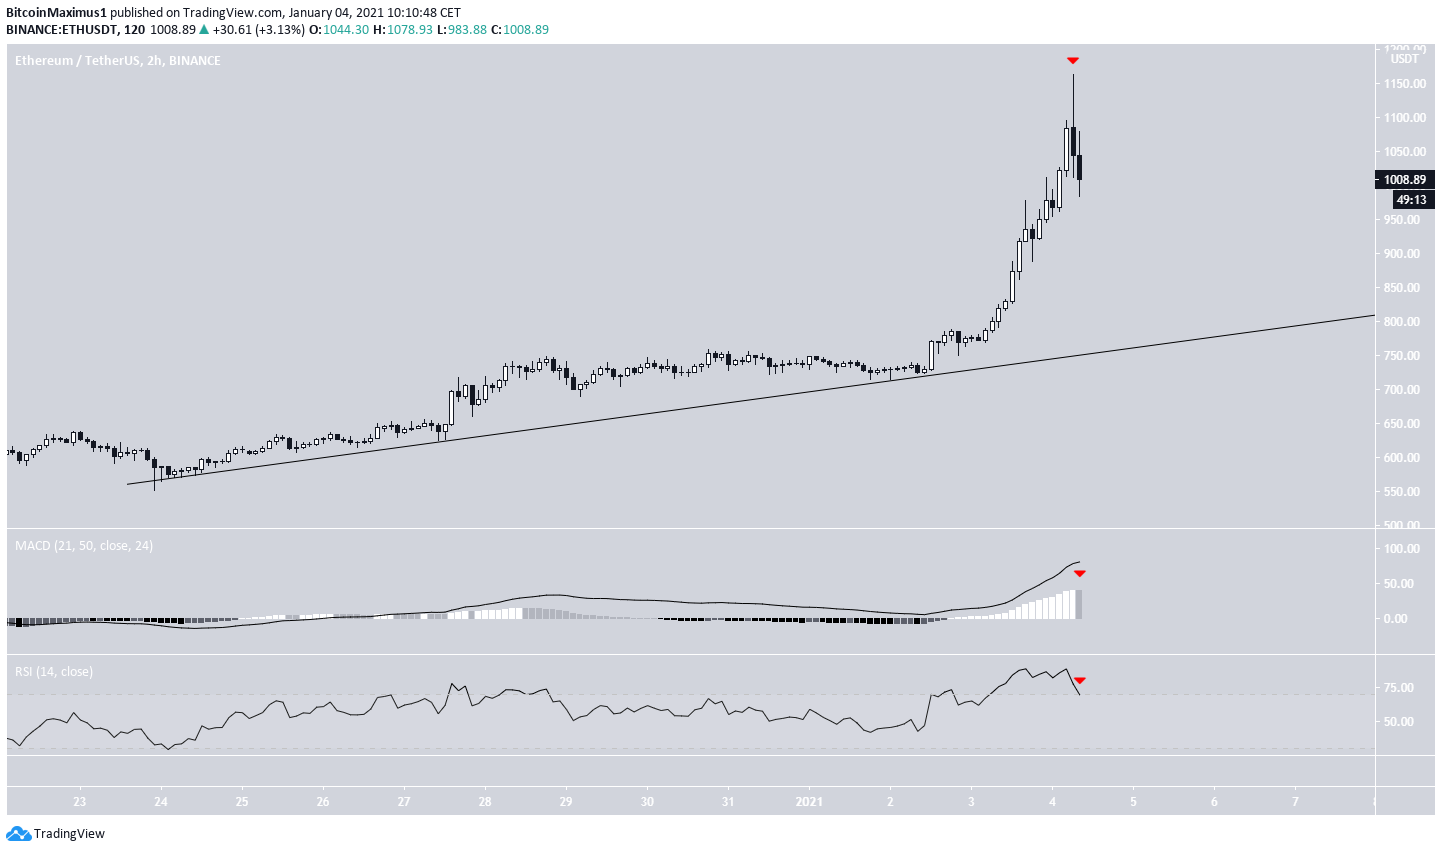
The two-hour chart shows the first signs of weakness in the form of a lower momentum bar in the MACD and an RSI decrease from overbought territory. In addition, ETH is following an ascending support line, which is currently near $800.
Therefore, if ETH were to continue its descent, it would be likely to find support near $800.
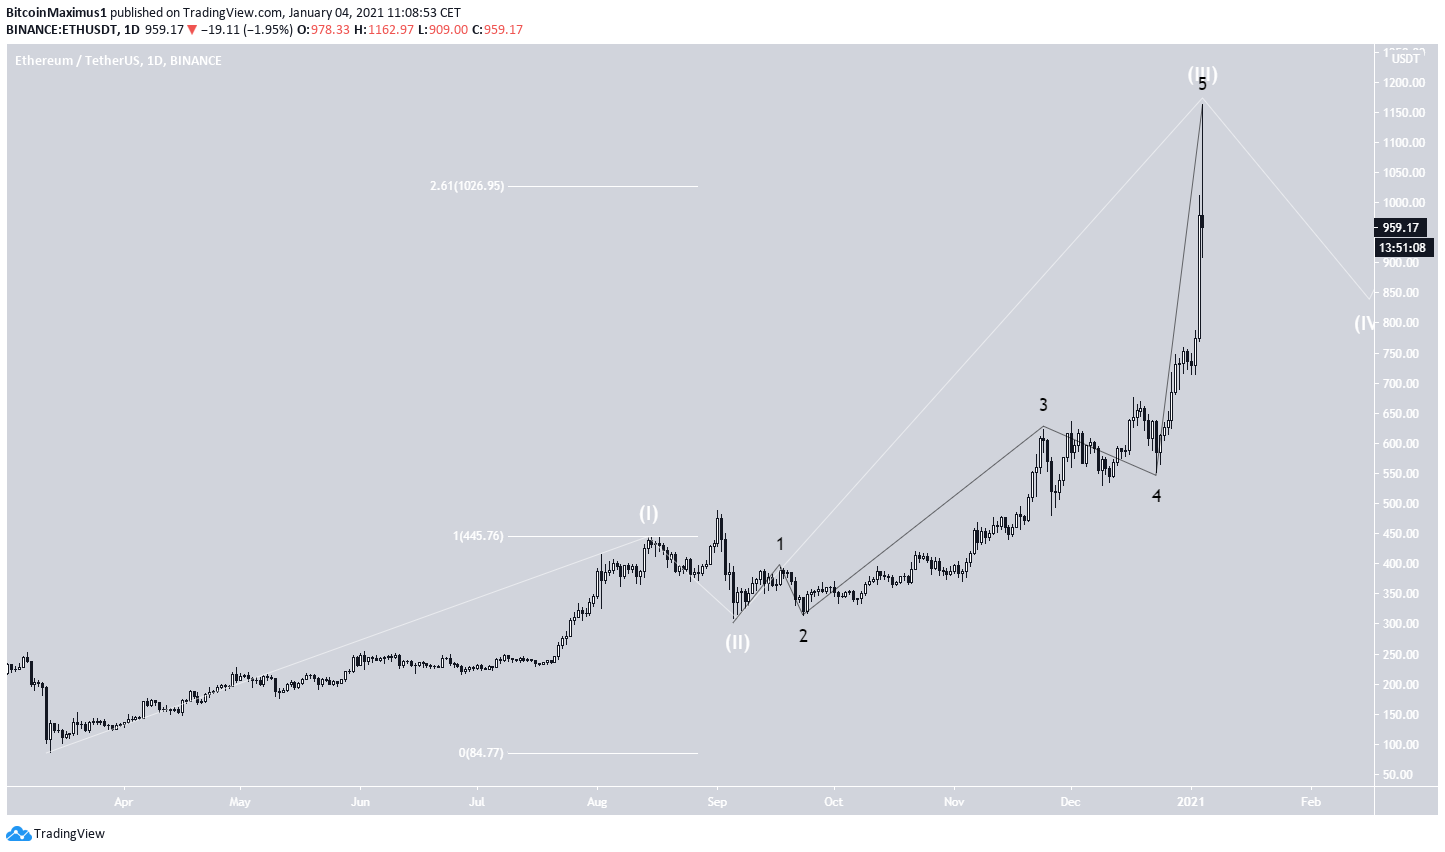
ETH Wave Count
Cryptocurrency trader @TheEWguy outlined an ETH chart stating that the price is in an extended third wave and is likely to continue increasing above $1,000.
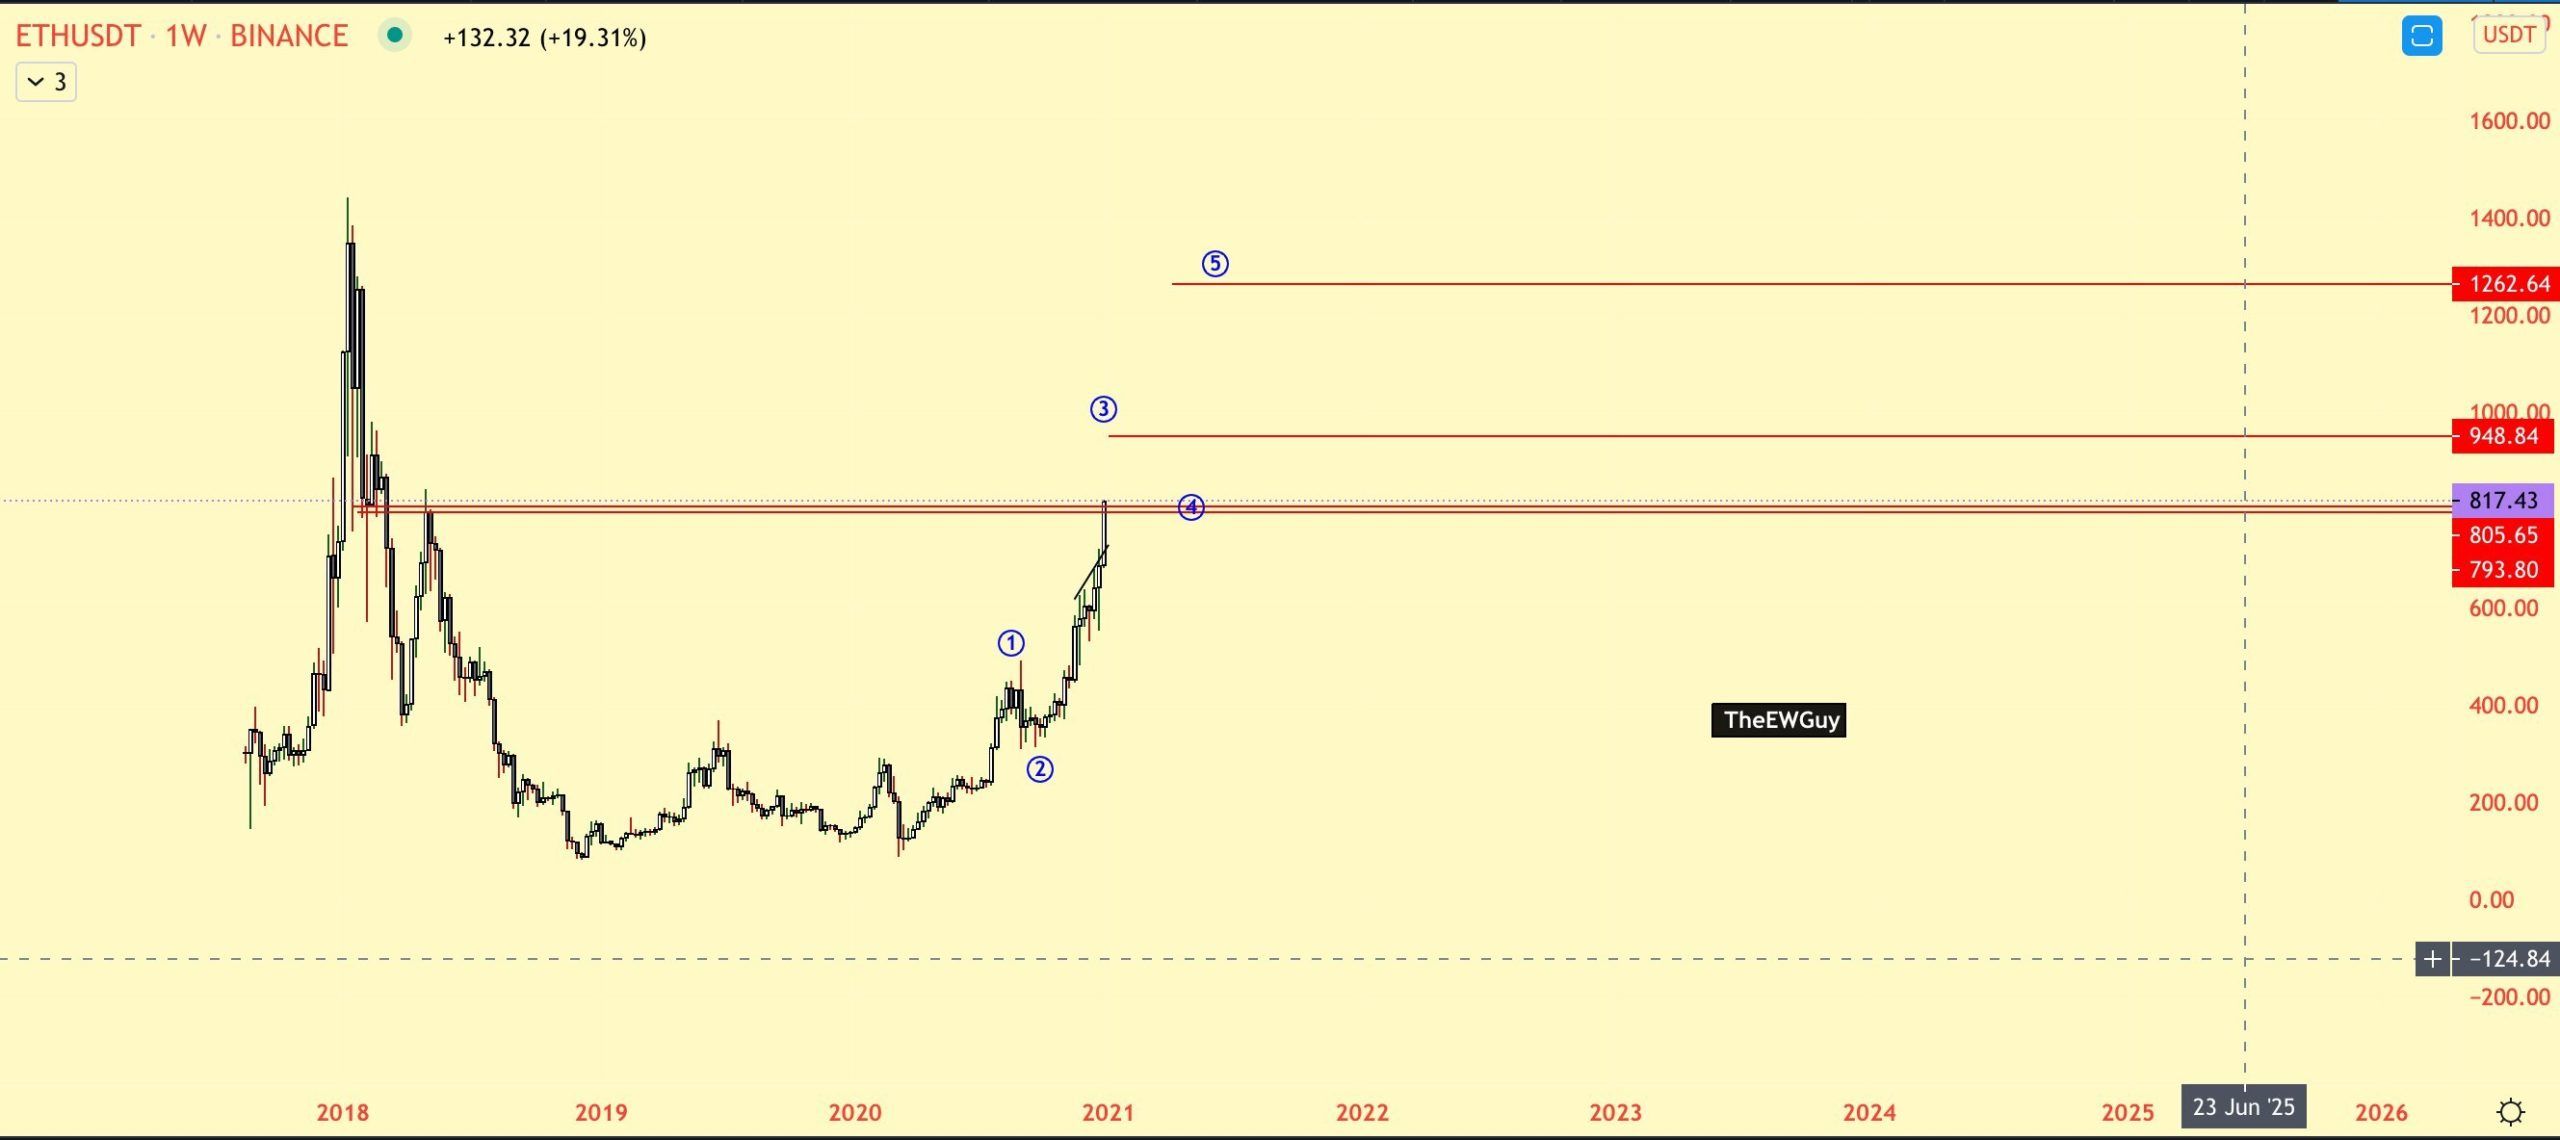
The wave count suggests that ETH is in the fifth sub-wave (shown in black below) of its third wave (white), from a bullish impulse that began back in March.
ETH has already moved above the $1,026 target for the top of wave 3 and is currently decreasing rapidly.
Therefore, ETH is expected to decrease in the short-term to complete wave 4 before resuming its upward movement towards a new all-time high.
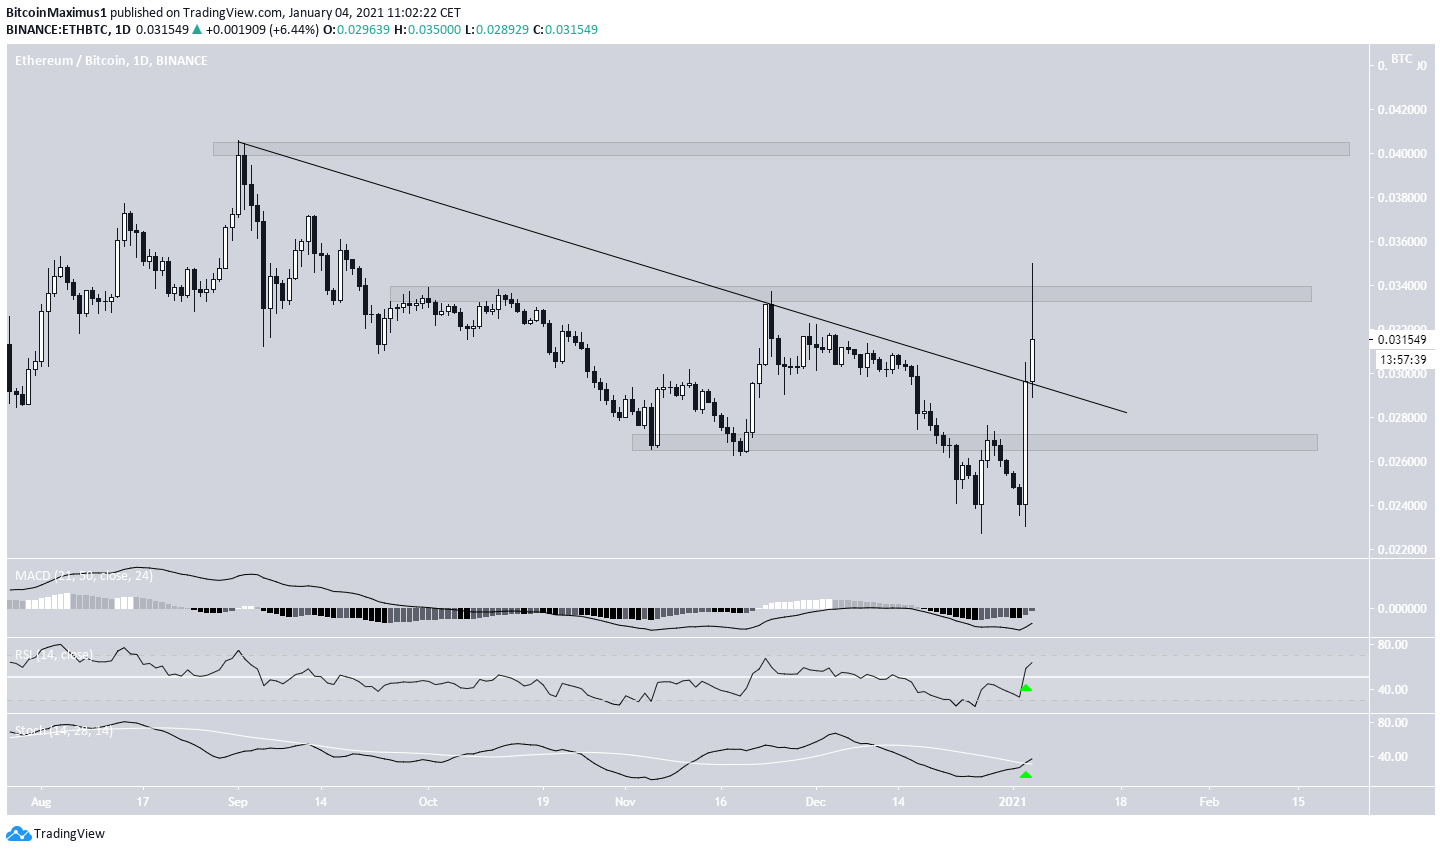
ETH/BTC
The ETH/BTC chart is bullish since it shows a retake of the ₿0.027 area and a breakout from a descending resistance line afterward.
The next resistance levels are found at ₿0.0335 (which has already rejected ETH) and ₿0.04.
Technical indicators are bullish, indicating that ETH is likely to break out above the ₿0.0335 area and move higher. However, a decrease to validate the breakout level could occur prior to the breakout.
Conclusion
Both the ETH/USD and ETH/BTC charts look bullish, despite the possibility of short-term corrective movements.
ETH/USD is expected to eventually reach a new all-time high price.
For BeInCrypto’s latest Bitcoin (BTC) analysis, click here!
Disclaimer: Cryptocurrency trading carries a high level of risk and may not be suitable for all investors. The views expressed in this article do not reflect those of BeInCrypto.
