


Ethereum (ETH) has been increasing at a much faster rate than Bitcoin (BTC) and is up by more than 50% since the June lows.
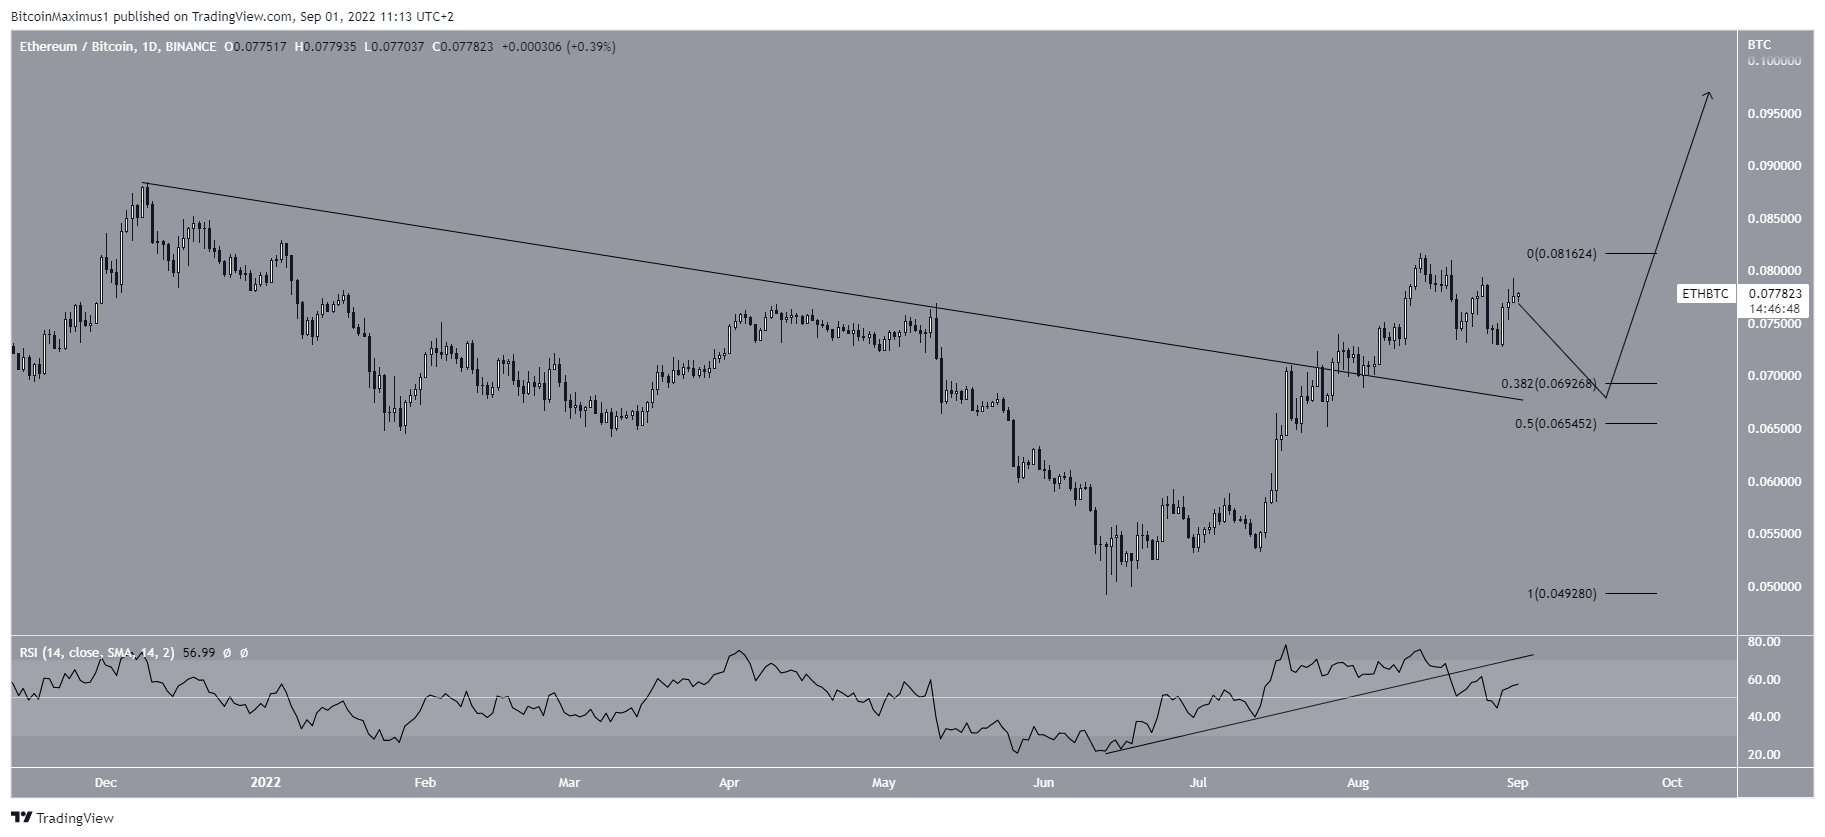
ETH had been decreasing underneath a descending resistance line since Dec 2021. The downward movement led to a low of ₿0.049 in June.
However, the price has increased sharply since and managed to break out from the line in the end of July, proceeding to reach a high of ₿0.081 in Aug.
Despite this sharp increase, the daily RSI is showing signs of weakness, since it has broken down from an ascending support line.
So, it is possible that it will return to the 0.382 Fib retracement support level at ₿0.069, validating the resistance line as support, before resuming its upward movement.
Future ETH/BTC movement
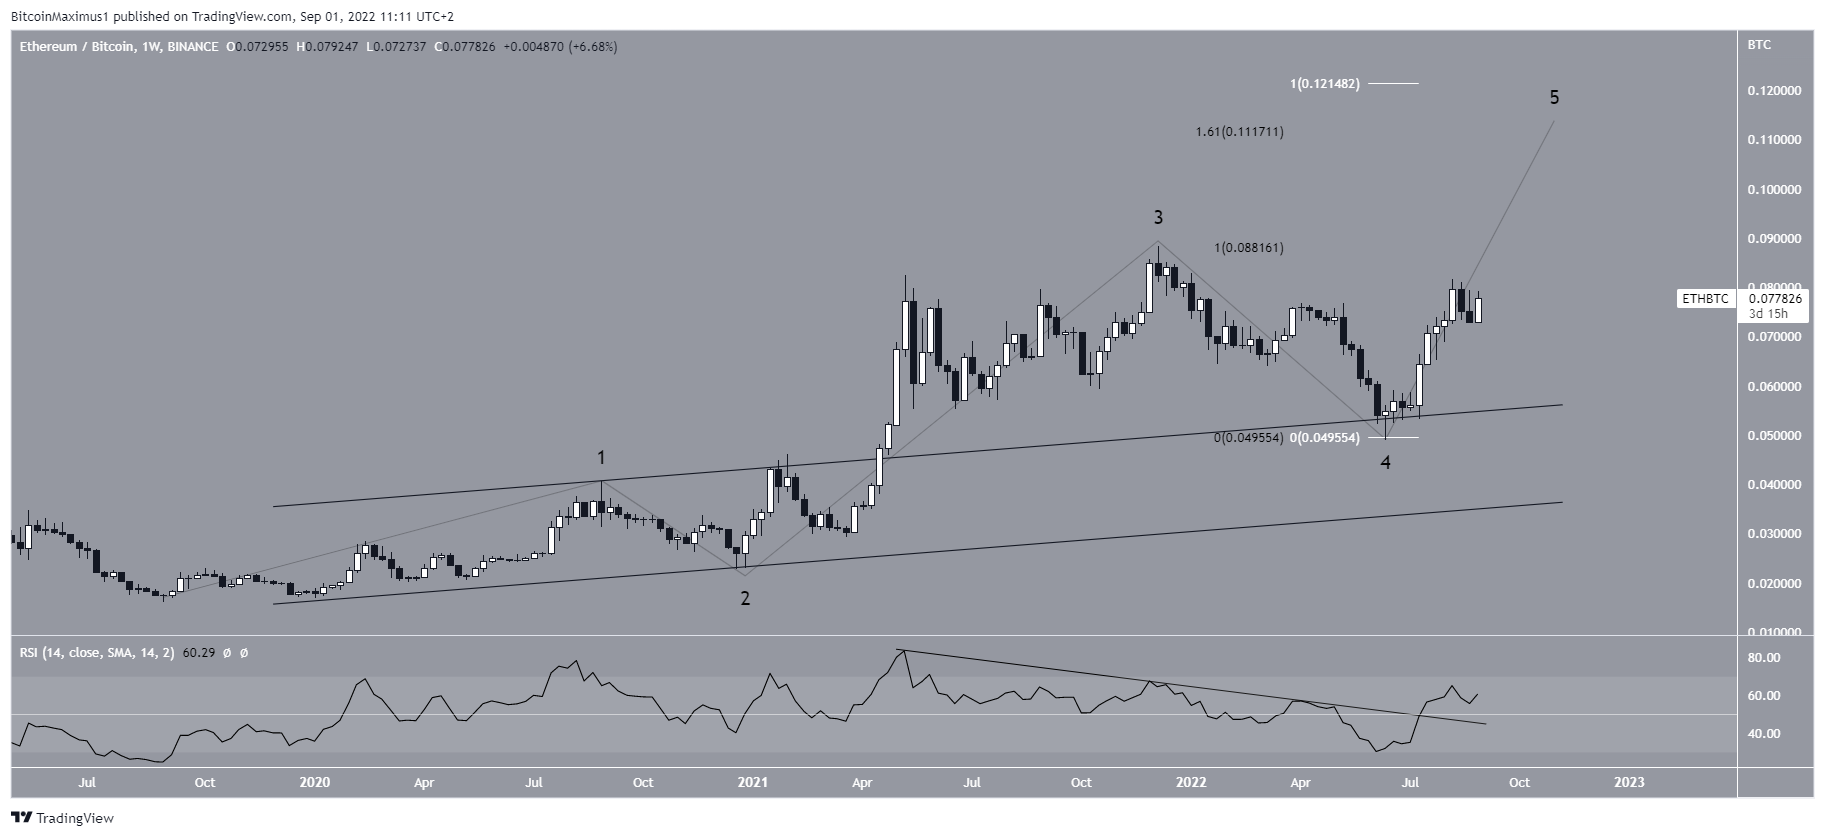
The weekly chart is more decisively bullish. The main reason for this is that the weekly RSI has broken out from its descending resistance line and then moved above 50 in the process. This is considered a sign of a long-term bullish trend.
As for the wave count, it seems that the price has completed a fourth-wave pullback, by bouncing at the resistance line of the previous channel.
If the upward movement continues, the main targets for the top of the movement would be between ₿0.11 and ₿0.121. The targets are created by the 1.61 external Fib retracement of wave four (black) and the length of waves one and three (white).
For ETH/USD analysis, click here.
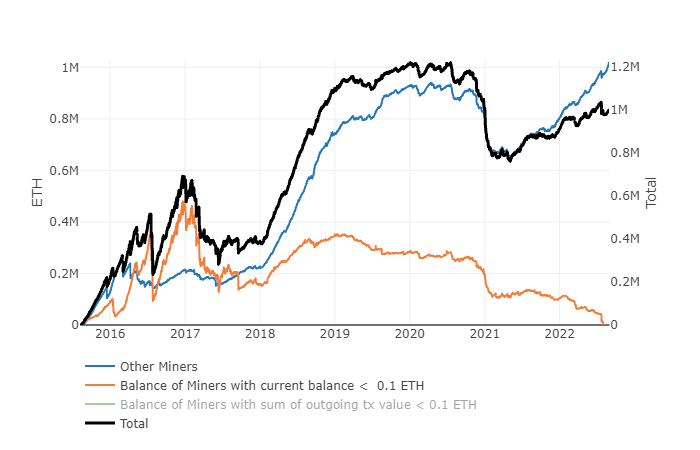
Ethereum miners continue stacking
In anticipation of the upcoming merge on Sept 15, Ethereum miners have been adding to their positions since May 2021. If we exclude the accounts which hold less than <0.1 ETH (orange), the balance of other miners (blue) is at an all-time high.
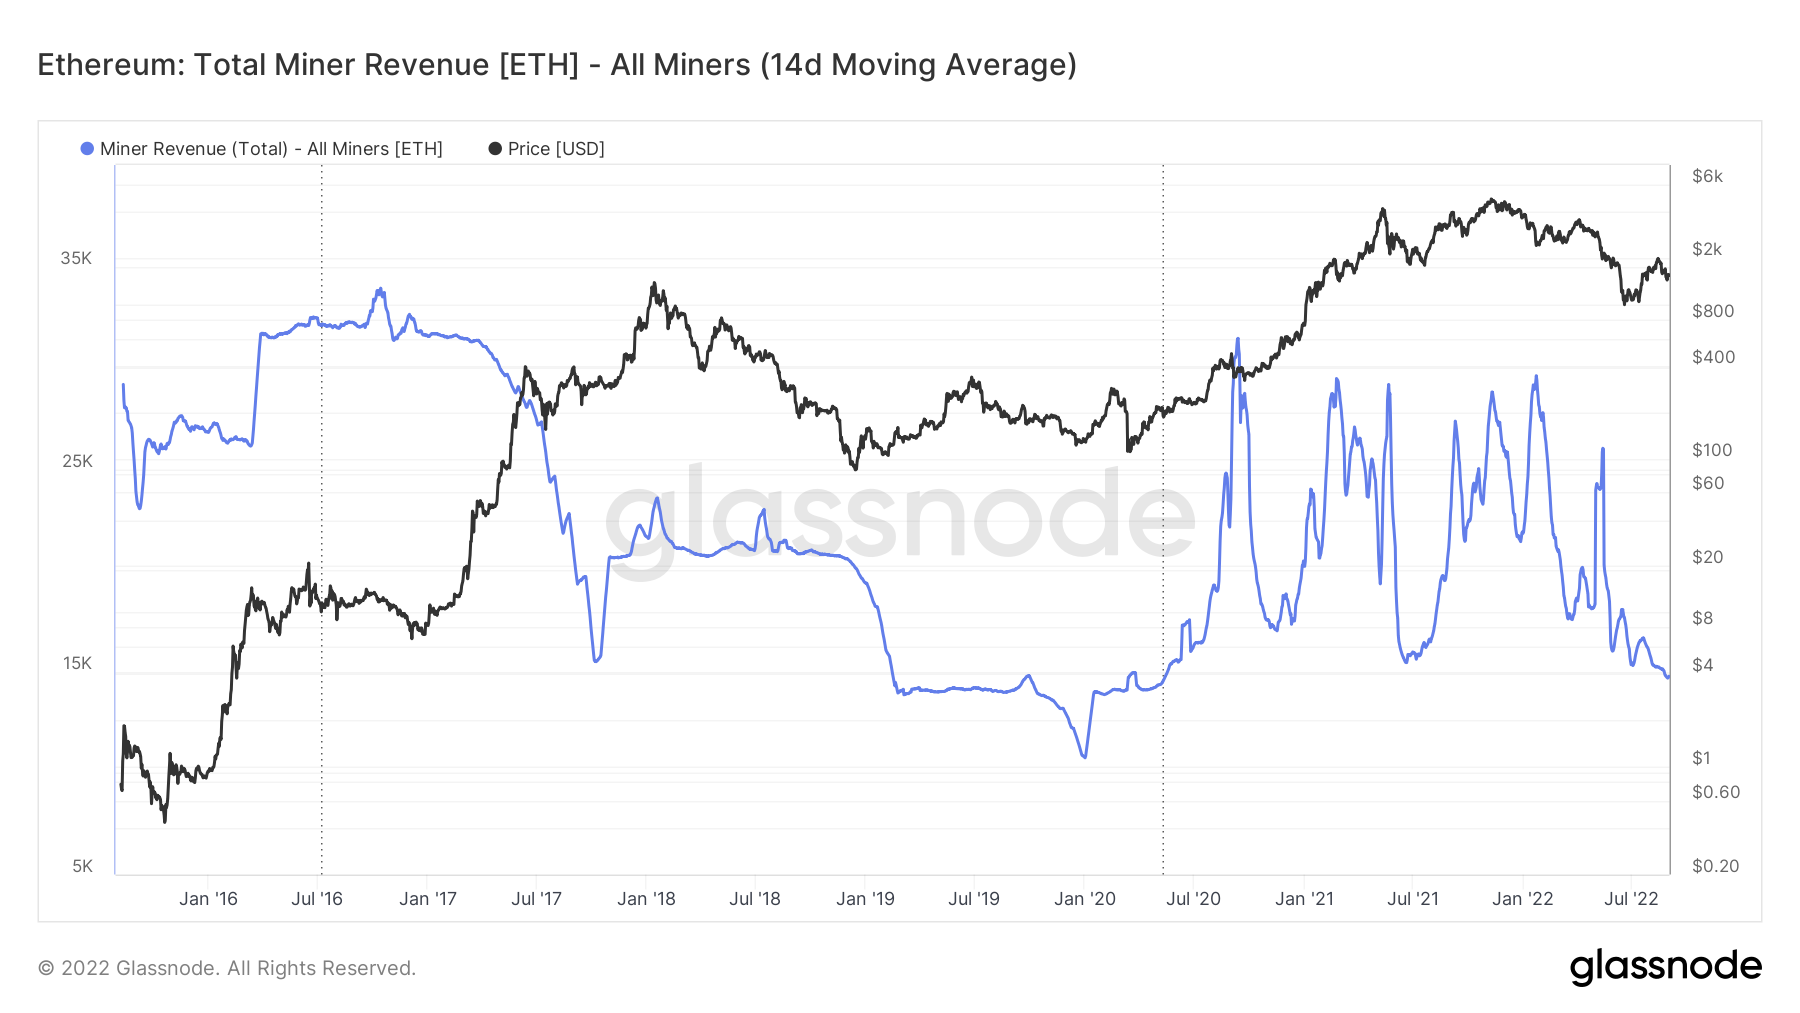
However, miner revenue is very close to a new all-time low. The only time it was lower than this was in Jan 2020.
The combination of these two charts shows an extremely strong conviction of Ethereum miners, since they are adding to their balance despite near all-time low revenues in fees.
For Be[in]Crypto’s latest Bitcoin (BTC) analysis, click here


