
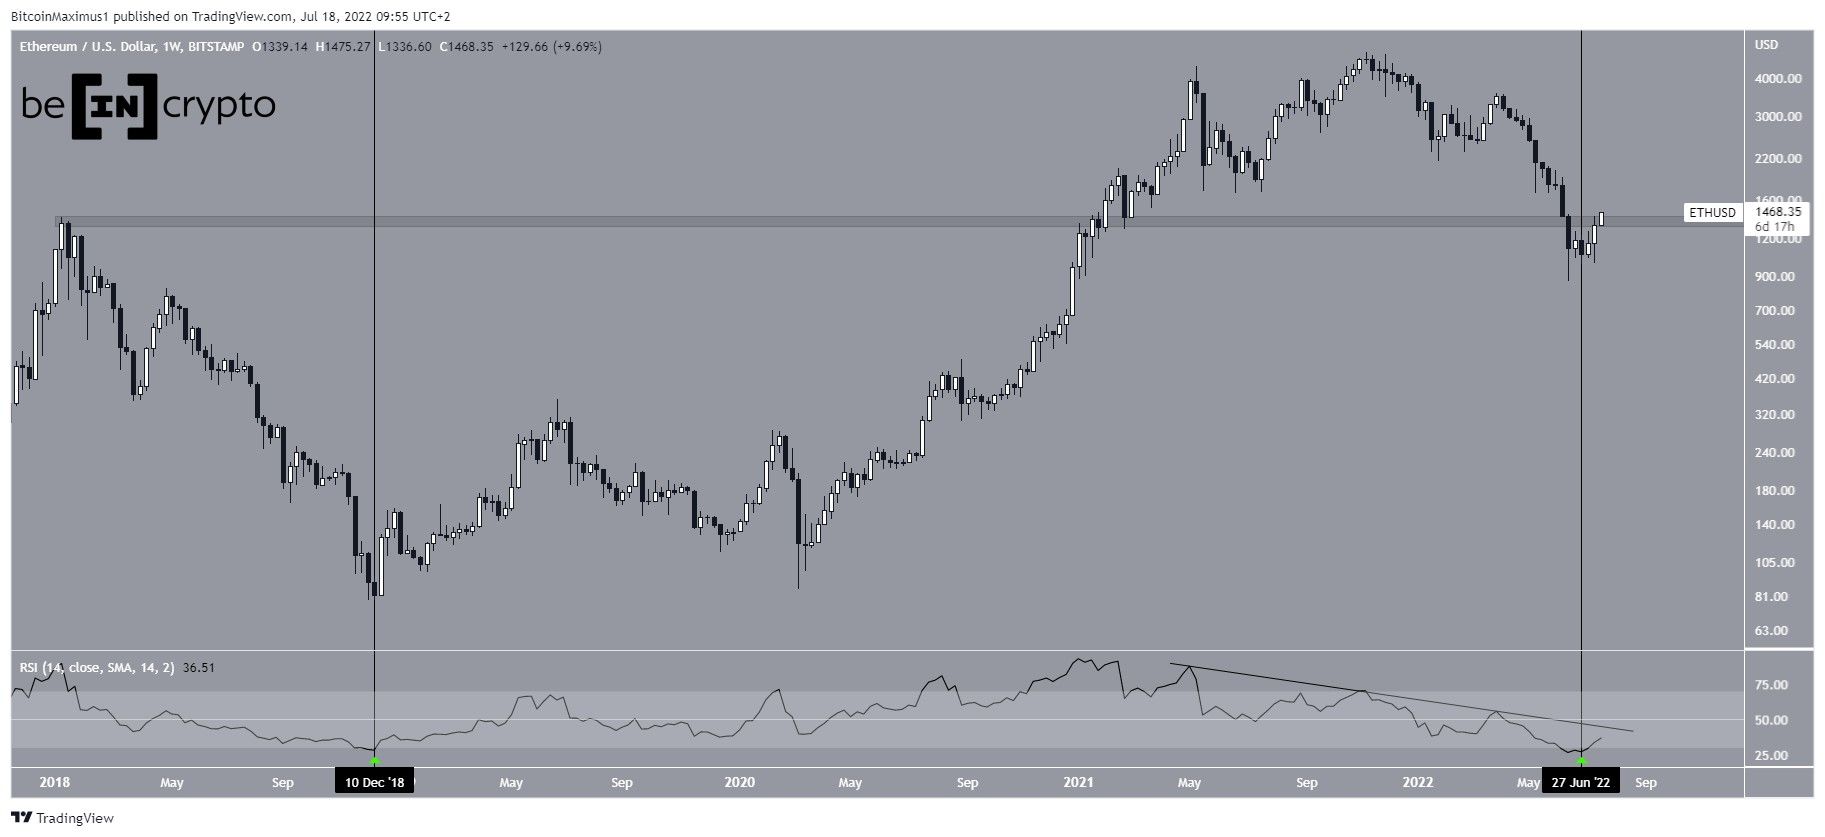
Ethereum (ETH) has been increasing since June 18 and is showing strong signs of a potential long-term bullish reversal.
Current movement
ETH has been falling since reaching an all-time high price of $4,868 in Nov 2021. The downward movement so far led to a low of $880 in June 2022. This caused the weekly RSI to drop into oversold territory. This was the first time it had done so since the Dec 2018 bottom (vertical lines).
While the weekly RSI has moved outside its oversold territory, it has yet to break out from its bearish divergence trend line that has been in place since May 2021. If it is successful in doing so, it would confirm that a bullish trend reversal has begun.
Additionally, the price is in the process of moving above the $1,400 horizontal area. This is a crucial level since it previously acted as the all-time high in 2018. Whether it reclaims it will go a long way in determining the direction of the future trend.
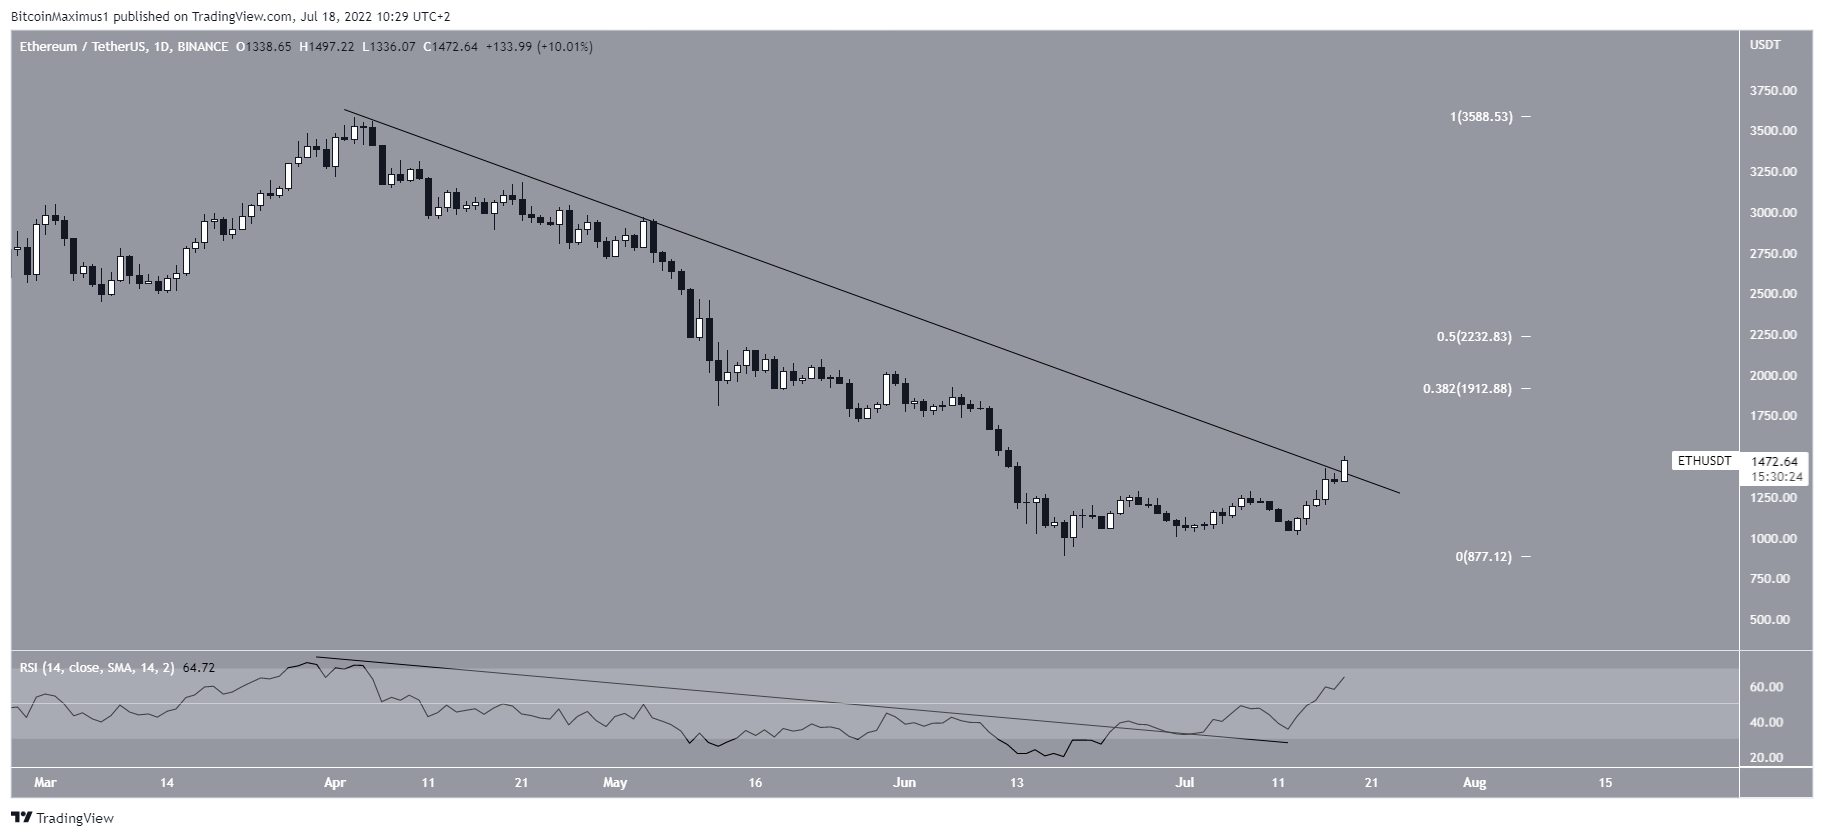
Potential ETH breakout
The daily chart shows that ETH has been following a descending resistance line since the end of March. Currently, it is in the process of breaking out from it. If it is successful, the closest resistance area would be between $1,910 and $2,230. The area is created by the 0.382 to 0.5 Fib retracement resistance levels.
The daily RSI supports the continuation of the upward movement, since it has broken out from a descending resistance line and moved above 50. So, it is likely that the price will reach a daily close above 50 and continue its upward movement.
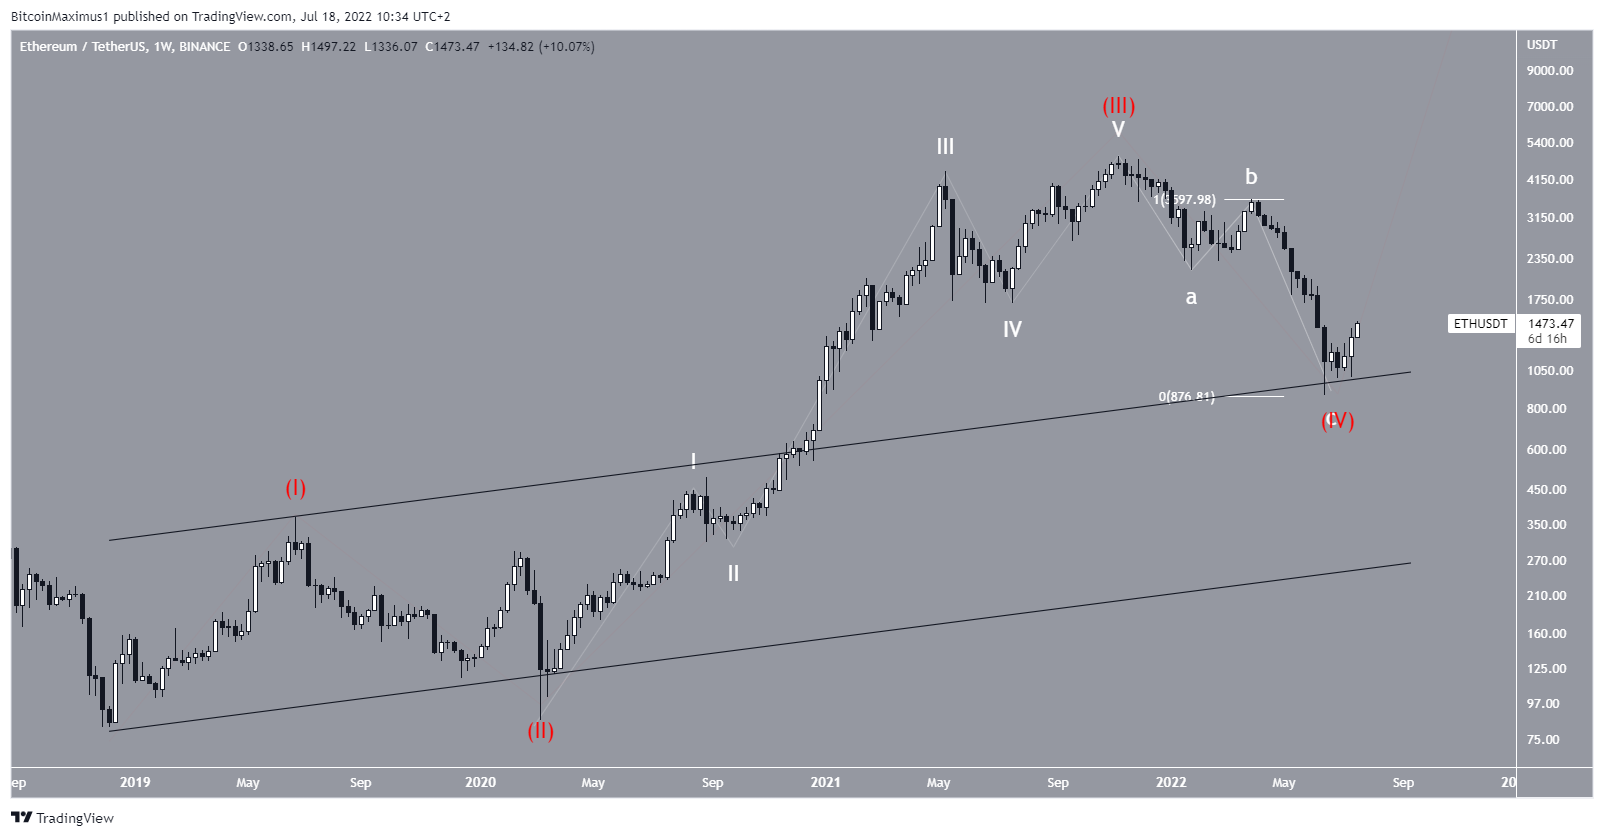
Wave count analysis
The most likely wave count suggests that ETH completed its five-wave downward movement, which started in March 2020 (white). Additionally, it seems that it has completed an A-B-C structure, in which waves A:C have had an exactly 1:1 ratio. This is the most common in such structures.
As for the longer-term movement, it is possible that the price has a fourth-wave pullback (red).
This potential long-term bottom fits well with the weekly and daily RSI readings alongside the price breakout.
For Be[in]Crypto’s latest bitcoin (BTC) analysis, click here.
