BeInCrypto analyzes the price movements for seven different cryptocurrencies, including Ethereum (ETH), which is currently making a breakout attempt.
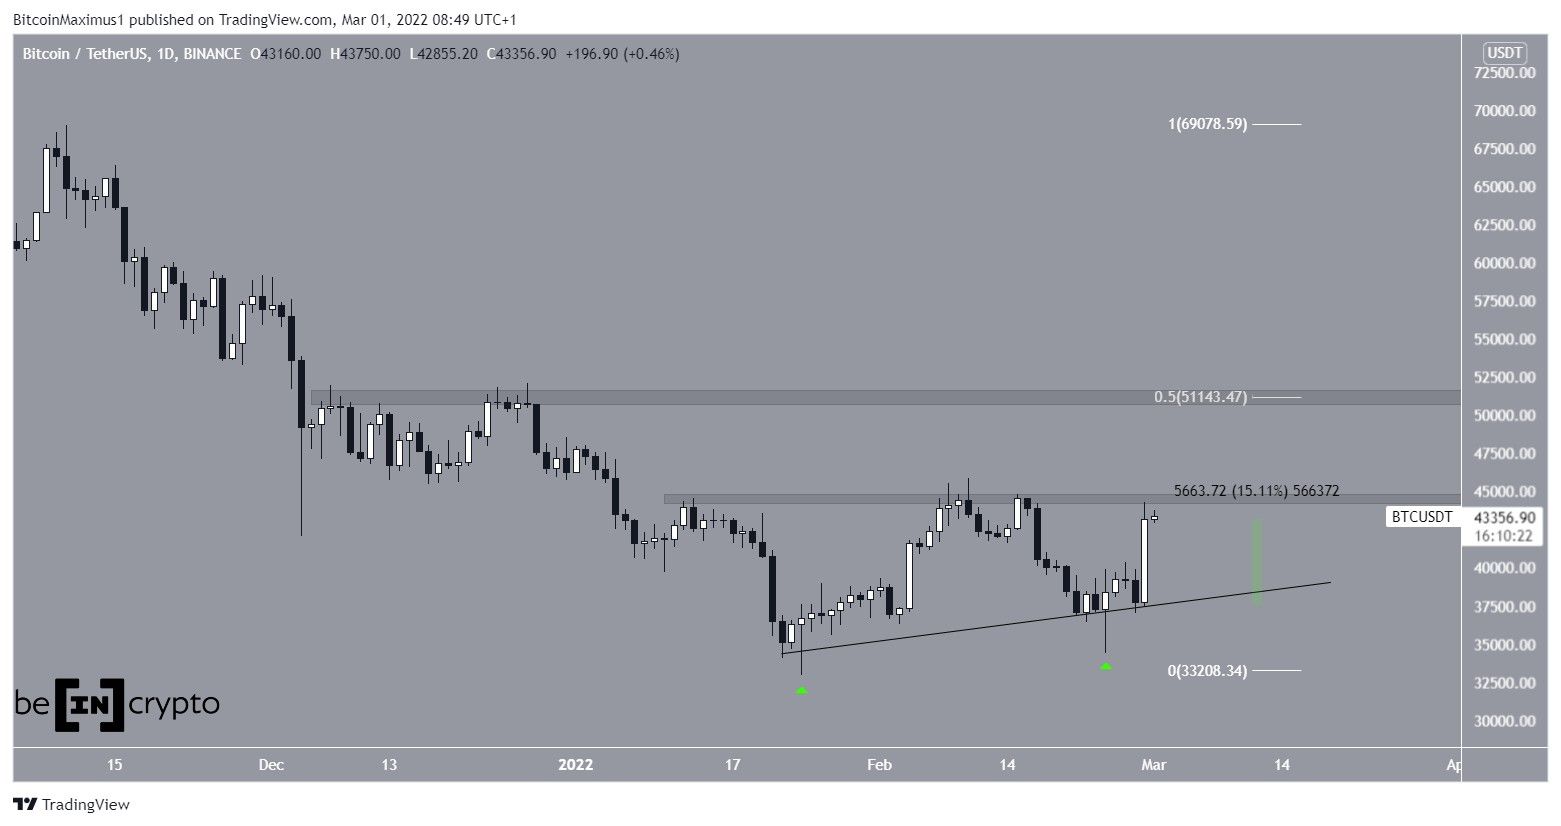
BTC
BTC has been trading above an ascending support line since Jan. 24. It created a very long lower wick after bouncing on Feb 24 and increased by 15% on Feb 28.
BTC has nearly reached the $44,400 resistance area which has so far marked the yearly highs.
If it manages to break out, the next closest resistance area would be found at $51,150. This is both a horizontal resistance area and the 0.5 Fib retracement resistance level.
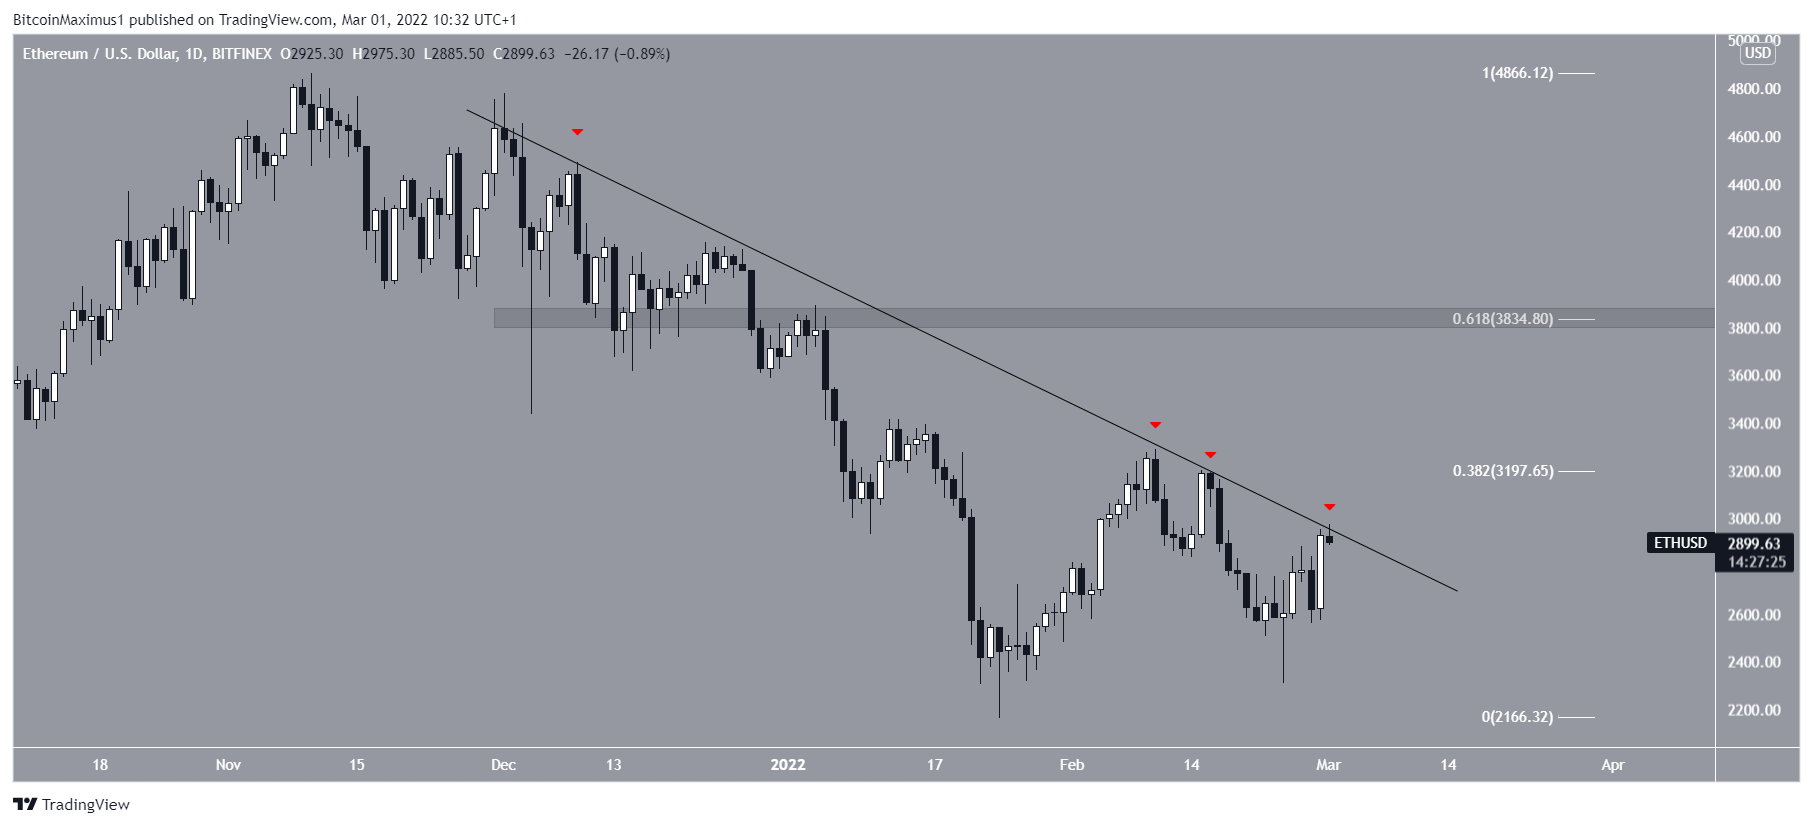
ETH
ETH has been decreasing underneath a descending resistance line since Dec. 1. So far, the line has rejected the price four times, most recently on March 1. Prior to this, ETH created a bullish engulfing candlestick on Feb. 28.
If ETH manages to break out, the next closest resistance area would be found at $3,200, created by the 0.382 Fib retracement resistance level.
However, the main resistance still remains at $3,830. This target is the 0.618 Fib retracement resistance level and a horizontal resistance area.
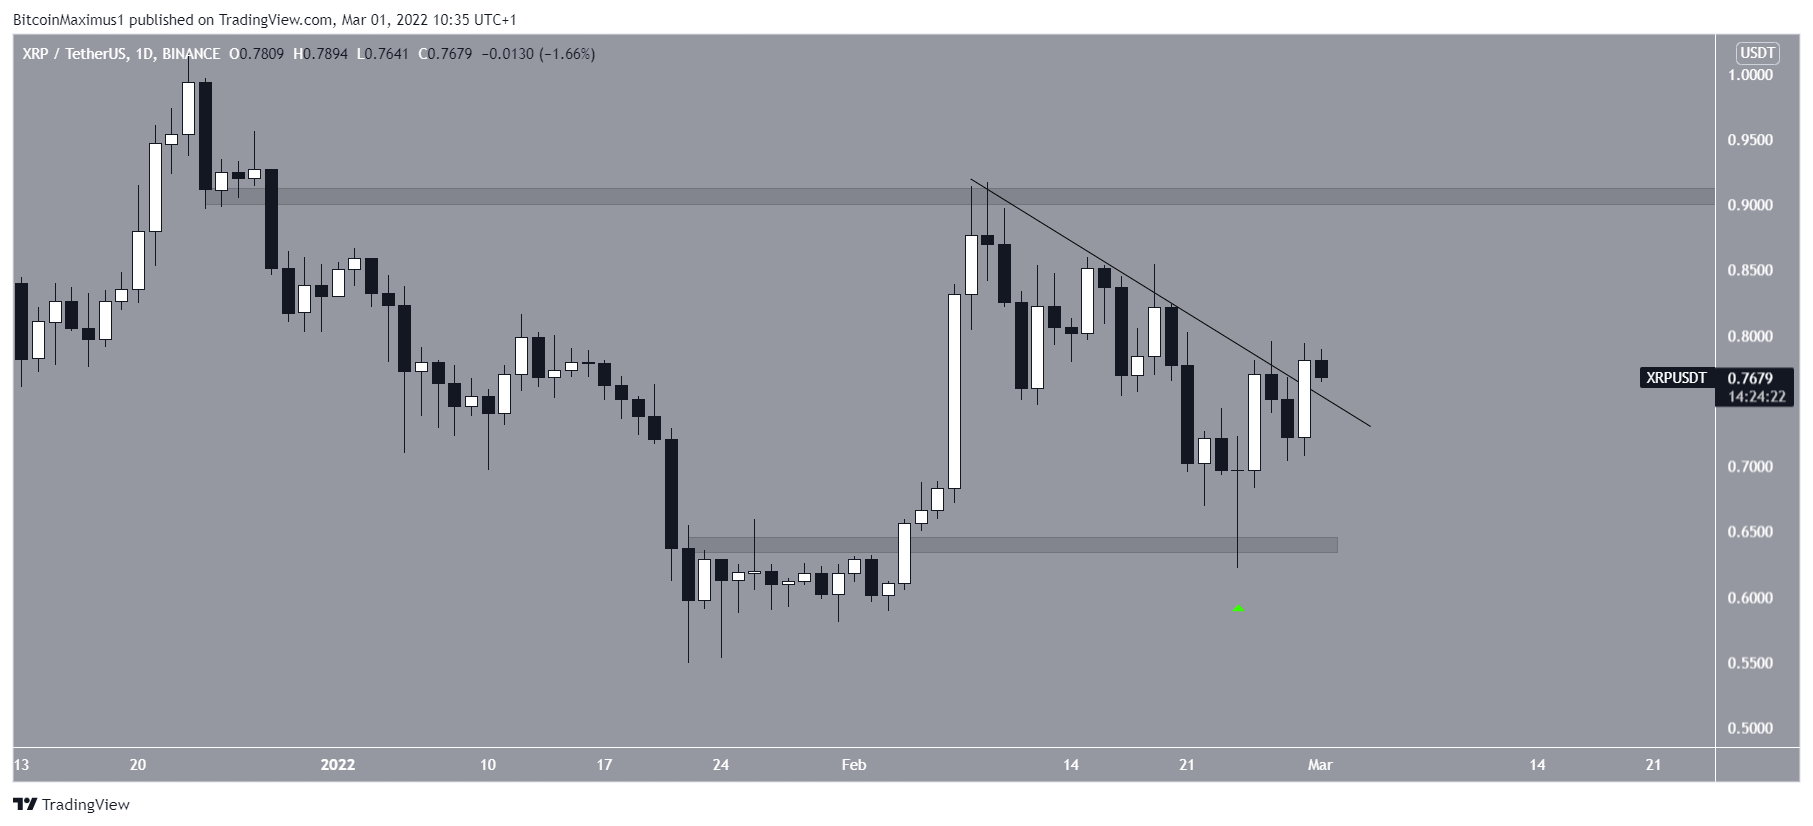
XRP
On Feb. 24, XRP reached the $0.64 horizontal support area and bounced (green icon), creating a very long lower wick in the process.
On Feb. 28, it created a bullish engulfing candlestick and broke out from a descending resistance line.
The next closest resistance area is found at $0.905.
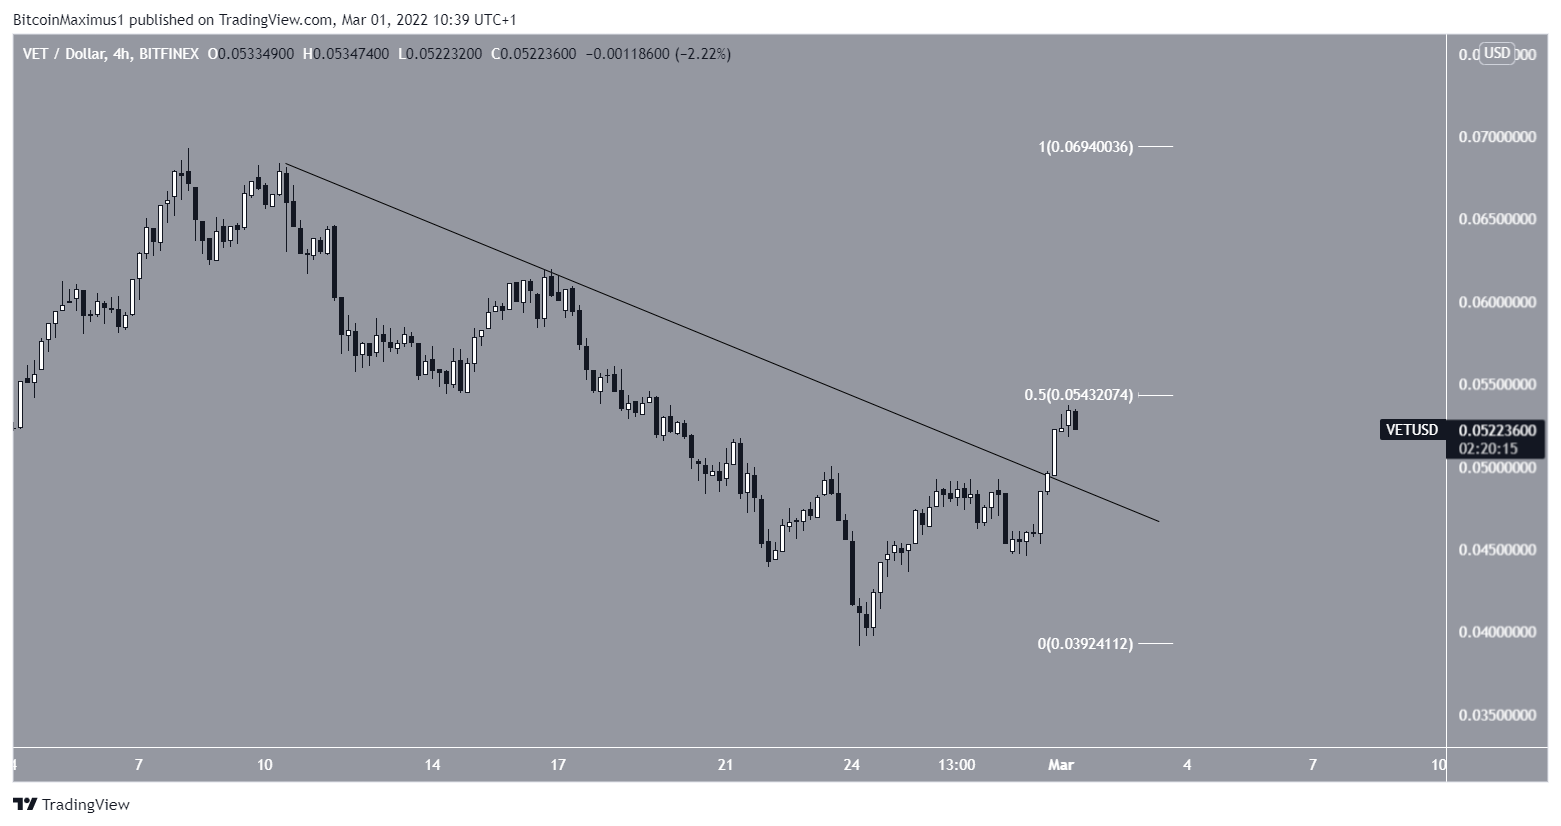
VET
VET had been decreasing under a descending resistance line since Feb 10. The downward move led to a local low of $0.039 on Feb. 24 before a trend reversal occurred.
VET broke out from the descending resistance on Feb. 28 but was rejected from the 0.5 Fib retracement resistance level at $0.054.
It’s possible that VET has completed a long-term correction.
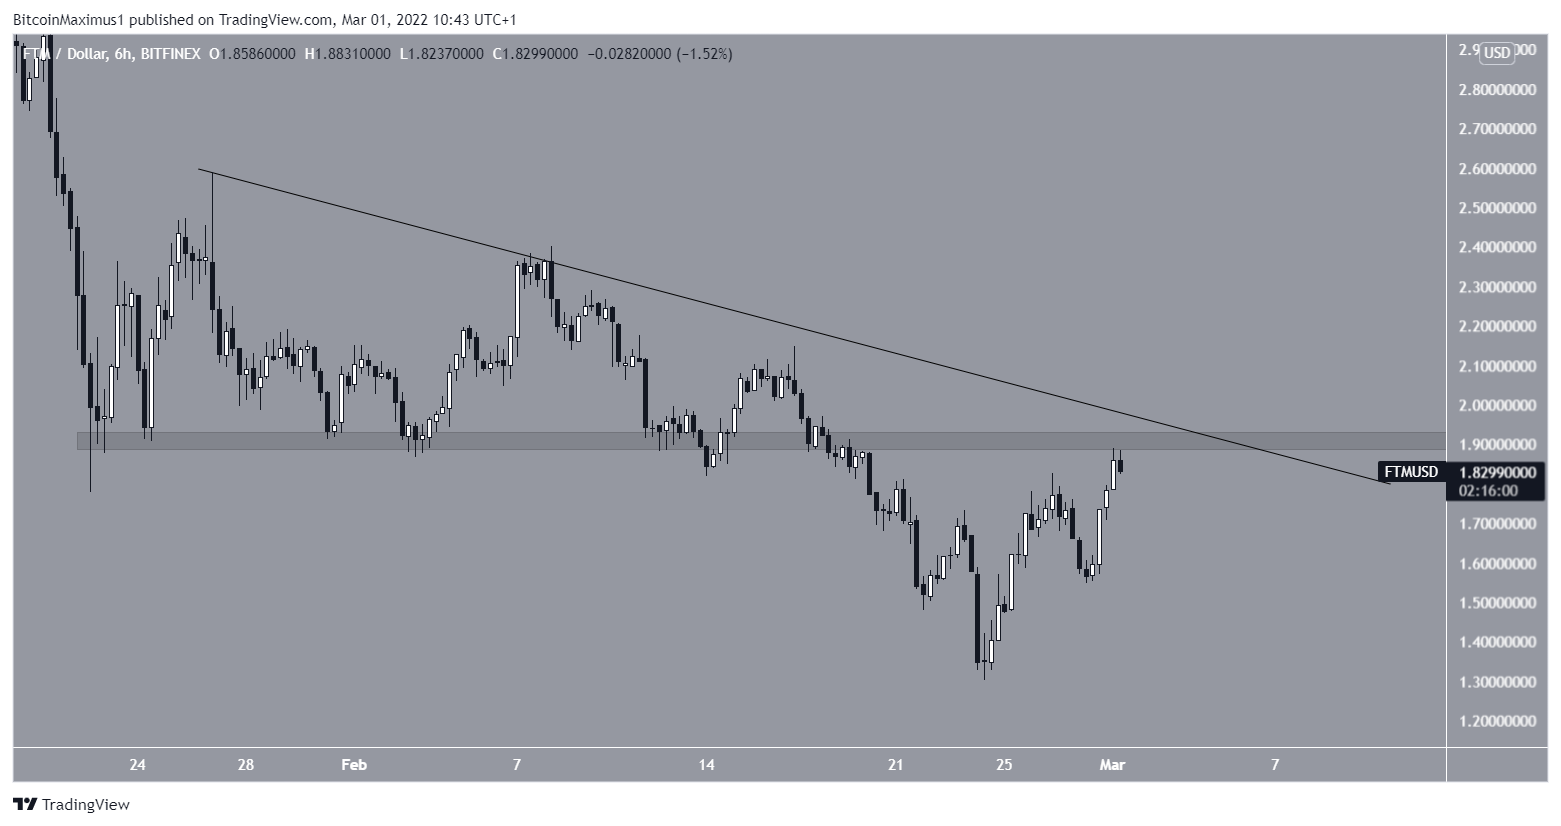
FTM
FTM has been increasing since Feb 24, when it reached a low of $1.30. The upward movement has so far led to a local high of $1.84.
However, FTM is still trading below a confluence of resistance levels at $1.90. The resistance is created by a descending resistance line and a horizontal resistance area.
A breakout above this line could cause the price to quickly accelerate.
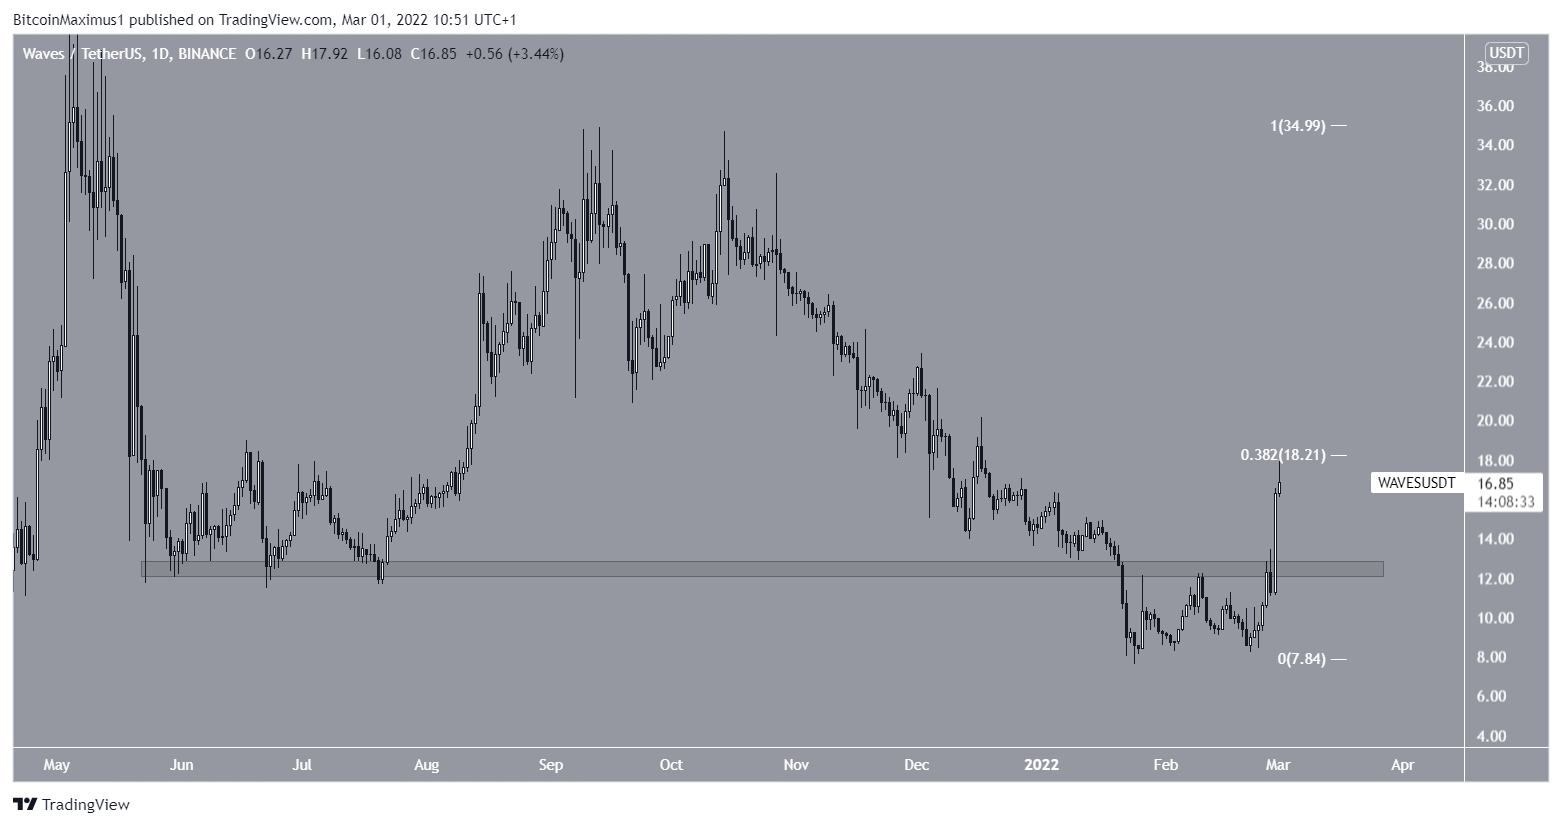
WAVES
WAVES has been moving upwards since Jan 24. On Feb. 28, it reclaimed the $12.50 horizontal resistance area. This was a crucial development, since the area had previously acted as support since May.
This likely means that the previous breakdown was only a deviation and the next closest resistance target to watch is at $18.21.
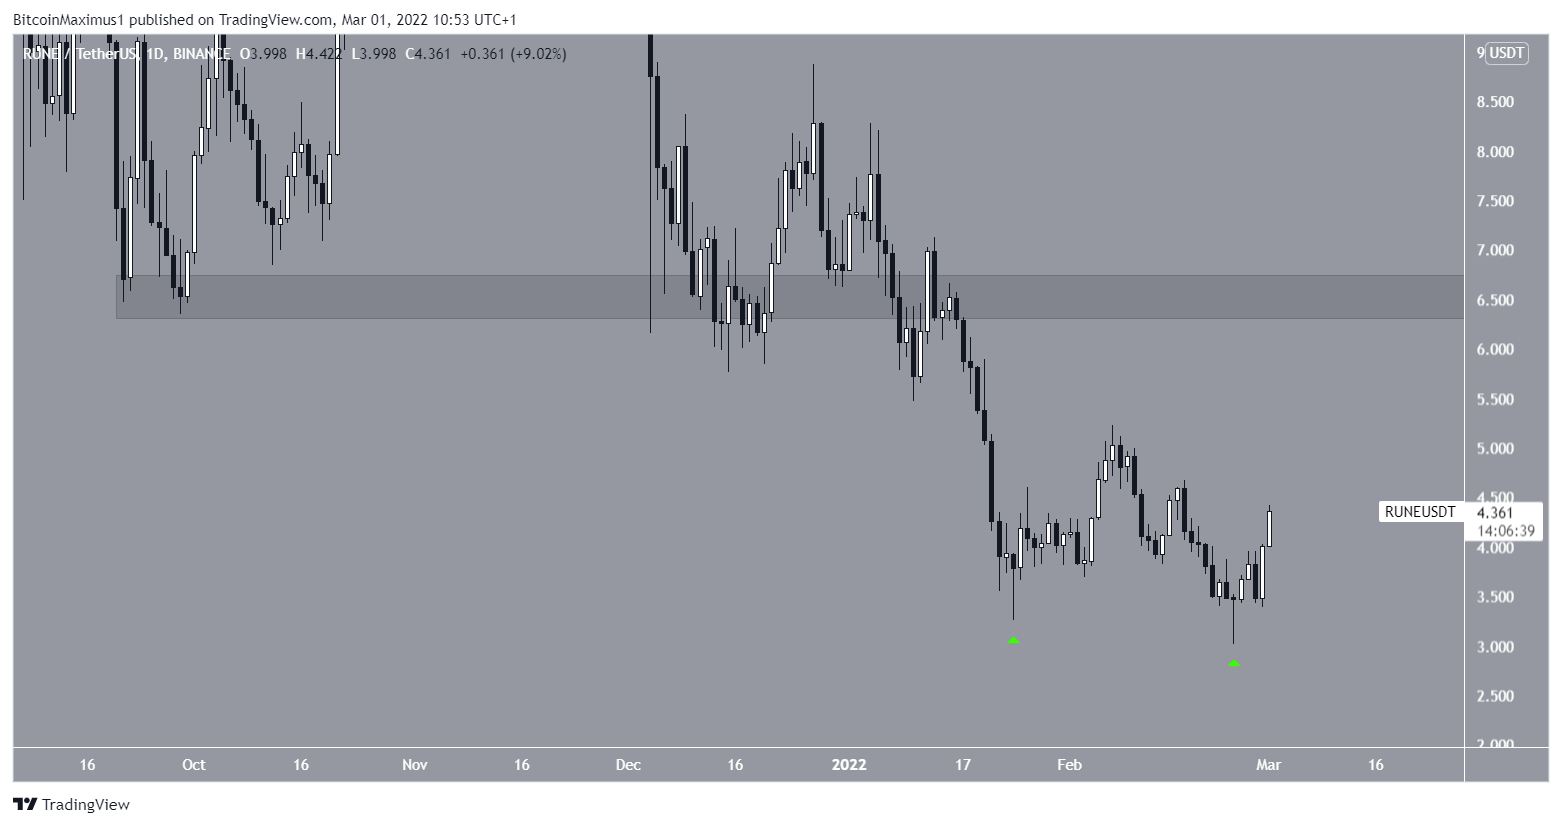
RUNE
On Jan. 24 and Feb. 24, RUNE created a double bottom close to the $3.50 region. The double bottom is often considered a bullish pattern. Furthermore, both bottoms were combined with long lower wicks (green icons).
If the upward movement continues, the next resistance will likely be reached at $6.60.