Despite a sharp drop at the beginning of September, the price move for Ethereum (ETH) is still intact. However, a short-term decline might occur before the price resumes its long-term upward movement.
Long-Term Indicators
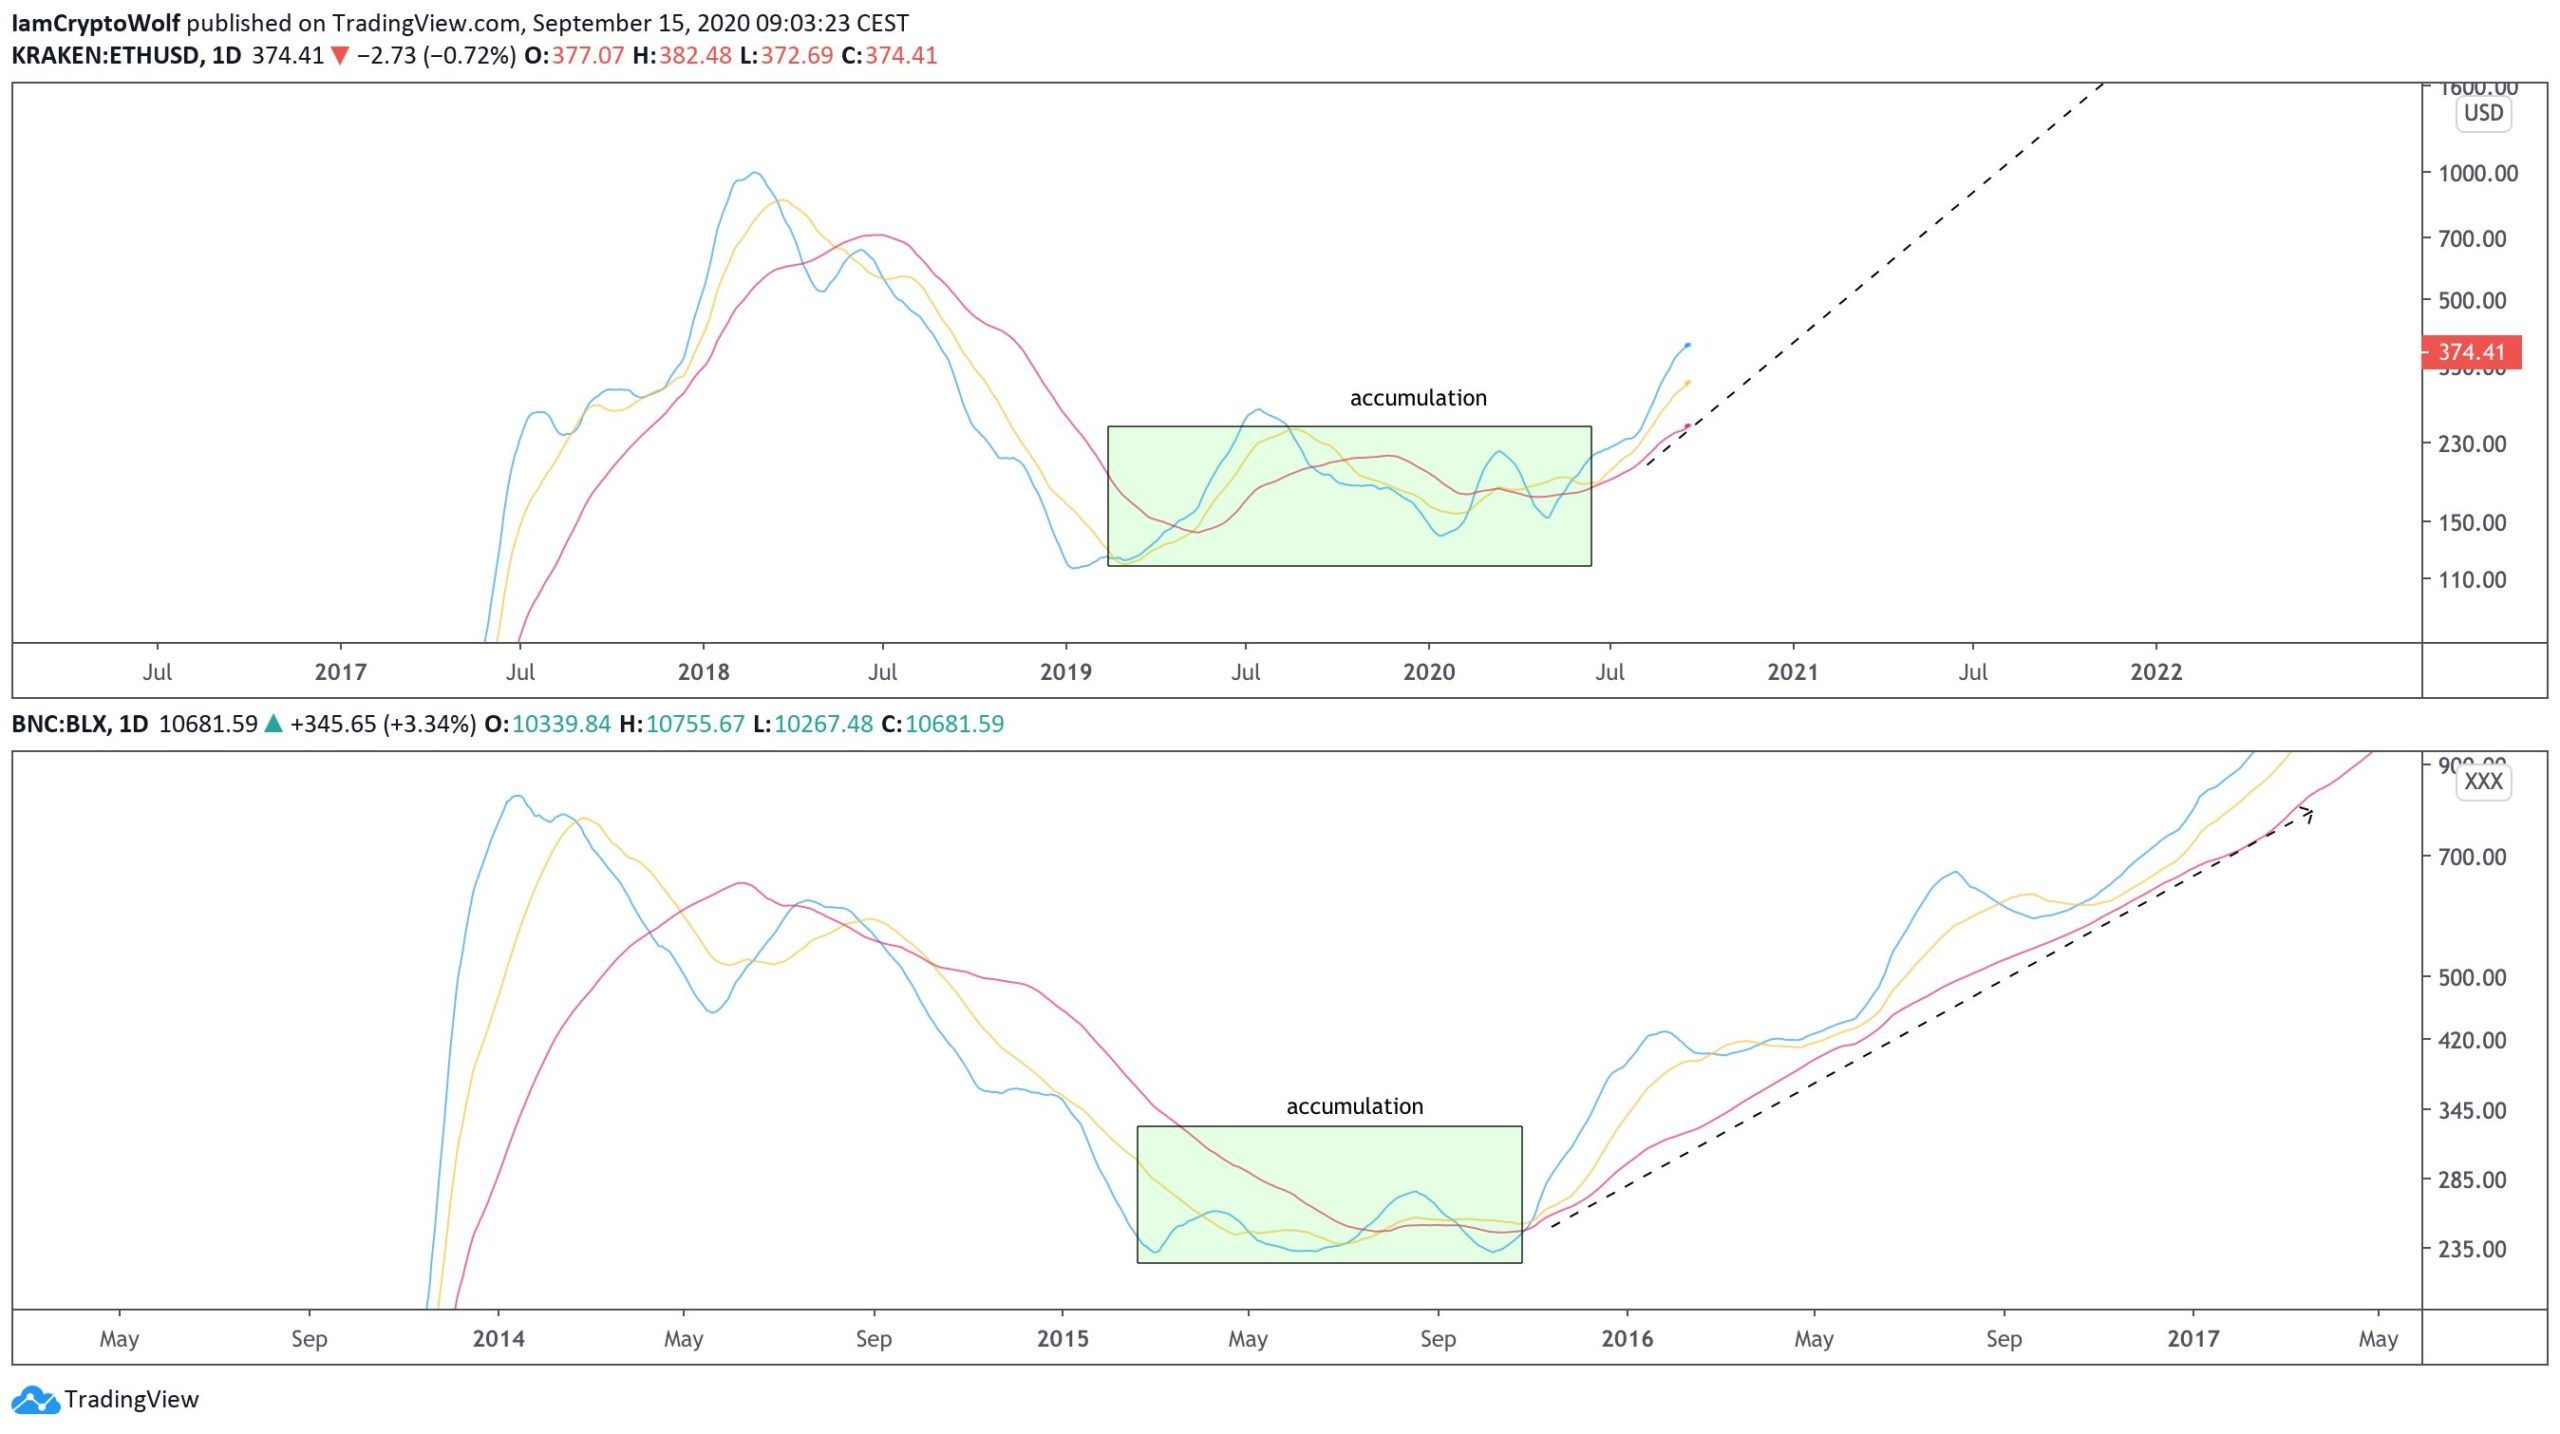
Cryptocurrency trader @Iamcryptowolf outlined an ETH chart noting that the moving average (MA) reading throughout the past year is eerily similar to that of BTC during 2015, before the massive bull run that lead to the eventual all-time high.
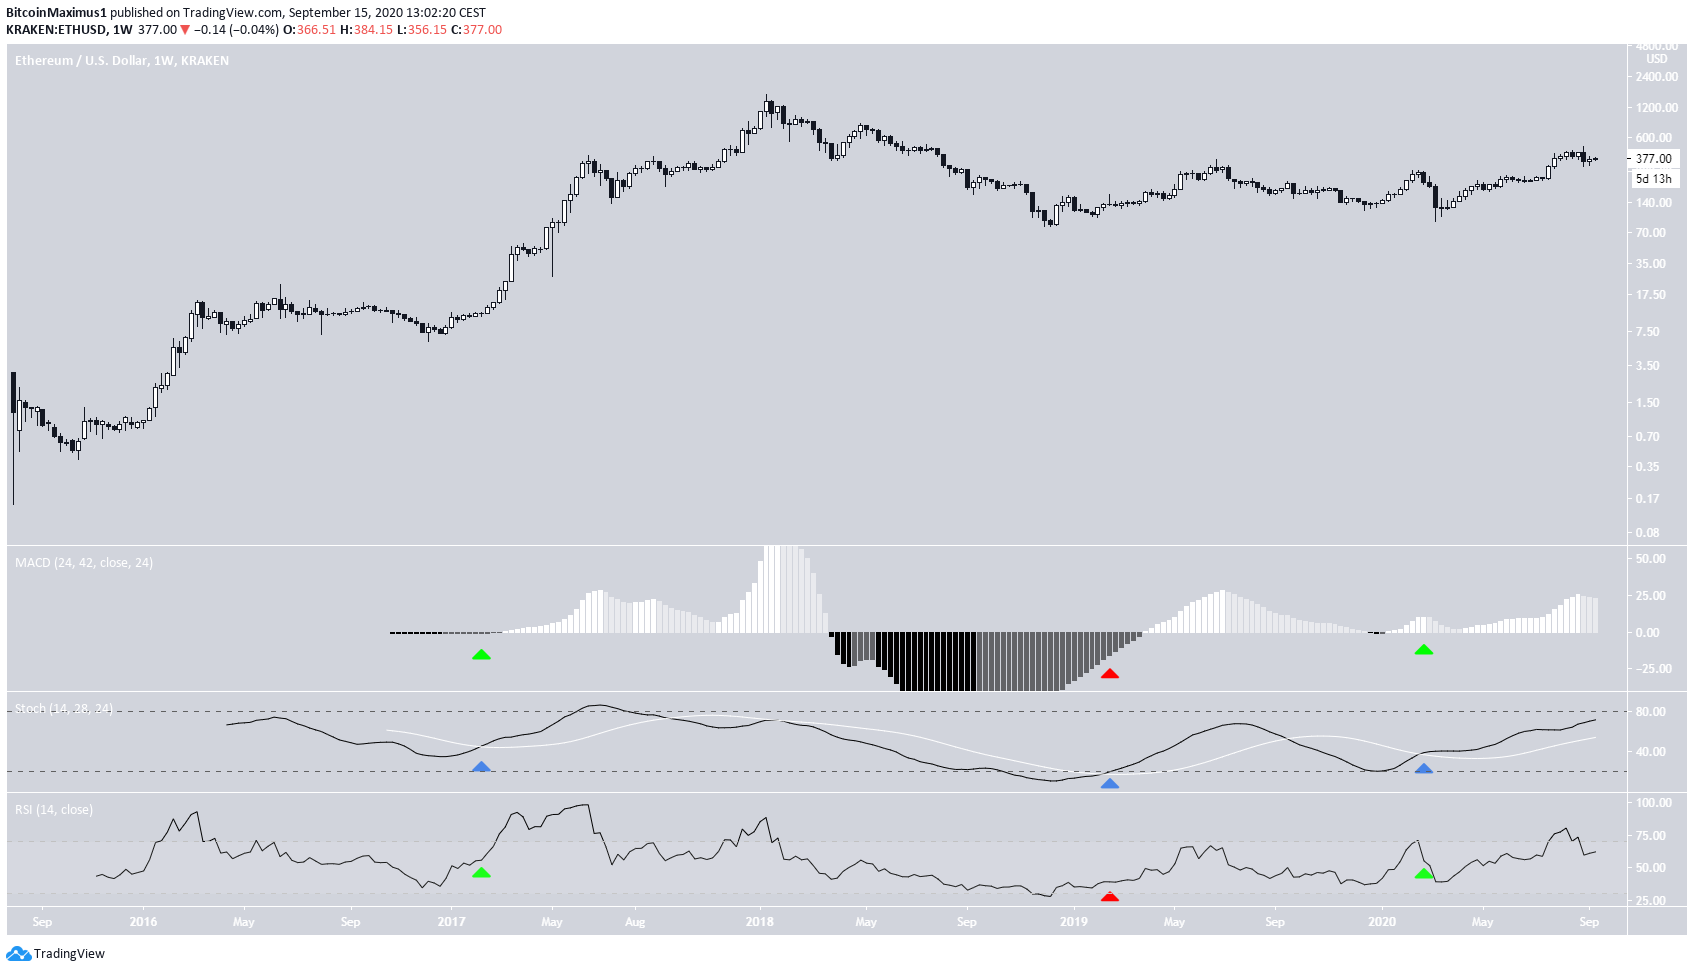
The bullish cross on the weekly stochastic has occurred three times until now (denoted by the blue arrows):
- January 2017
- March 2019
- March 2020
All three occurrences led to an upward move, but the extent and length of the upward move differed. While it only lasted a few months in 2019, the 2017 move lasted for more than a year, and the 2020 move is still ongoing.
The readings from the MACD and RSI are similar in the 2017 and 2020 crosses (green arrows), while they differ in the 2019 one (red). This makes it more likely that the 2017 and 2020 crosses were more similar to one another than the 2019 one, and supports the possibility of a sustained upward move.
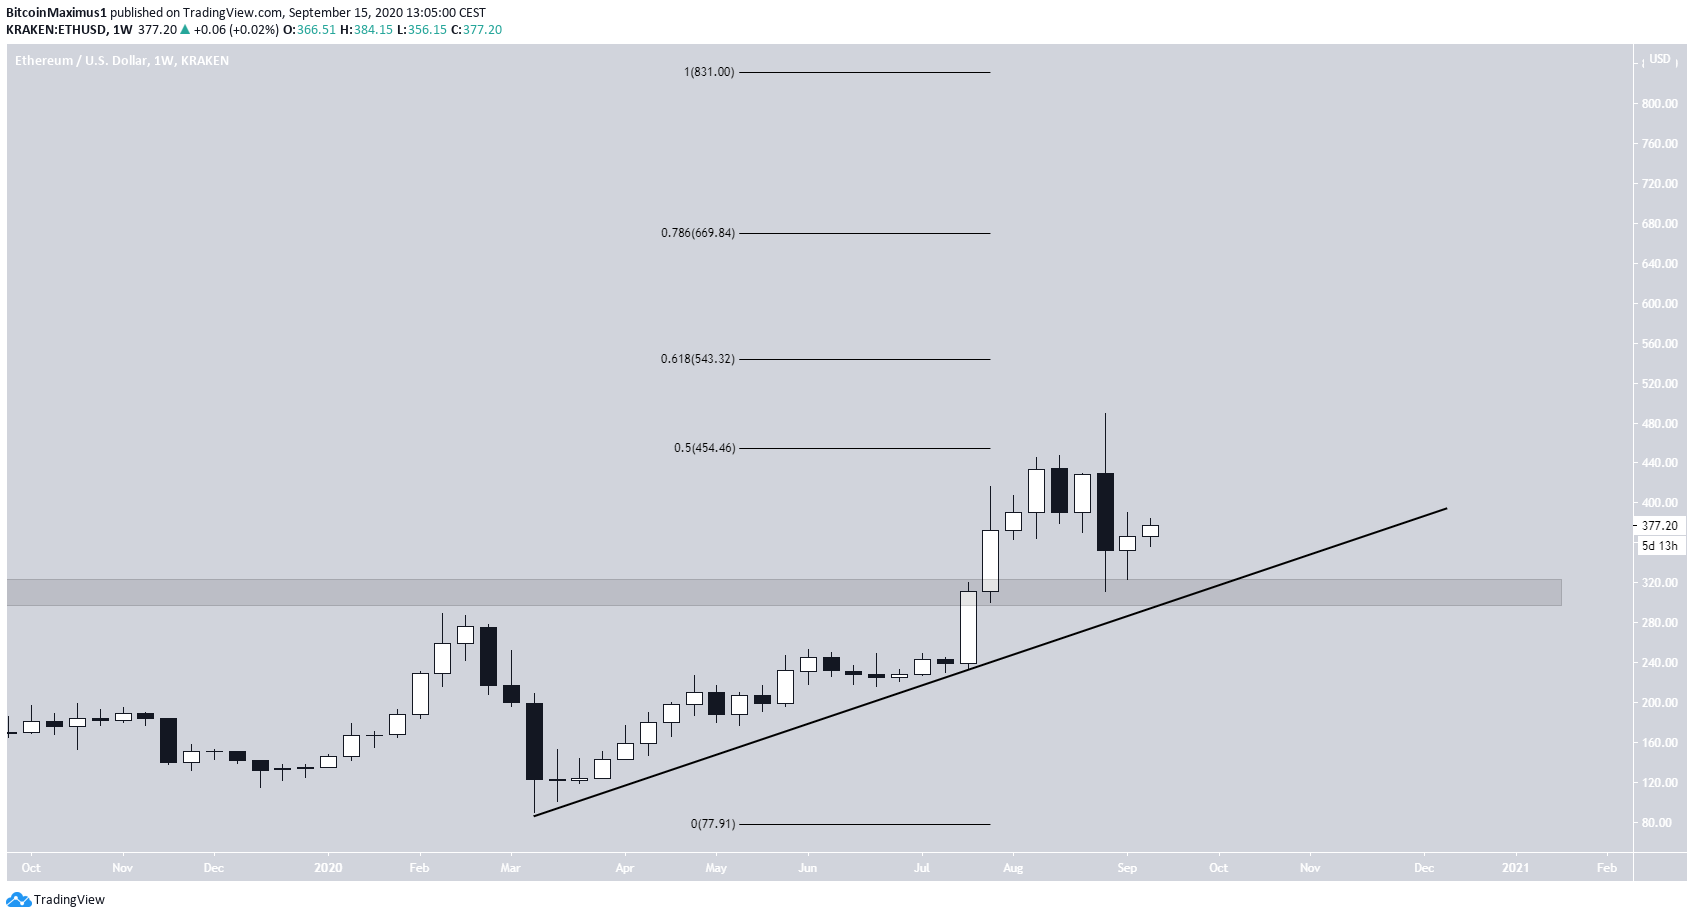
A closer look at this year’s movement reveals that the bullish structure is still intact. The price has been following an ascending support line since March, which is still intact. In addition, ETH has broken out above the $315 horizontal resistance area and validated it as support afterward.
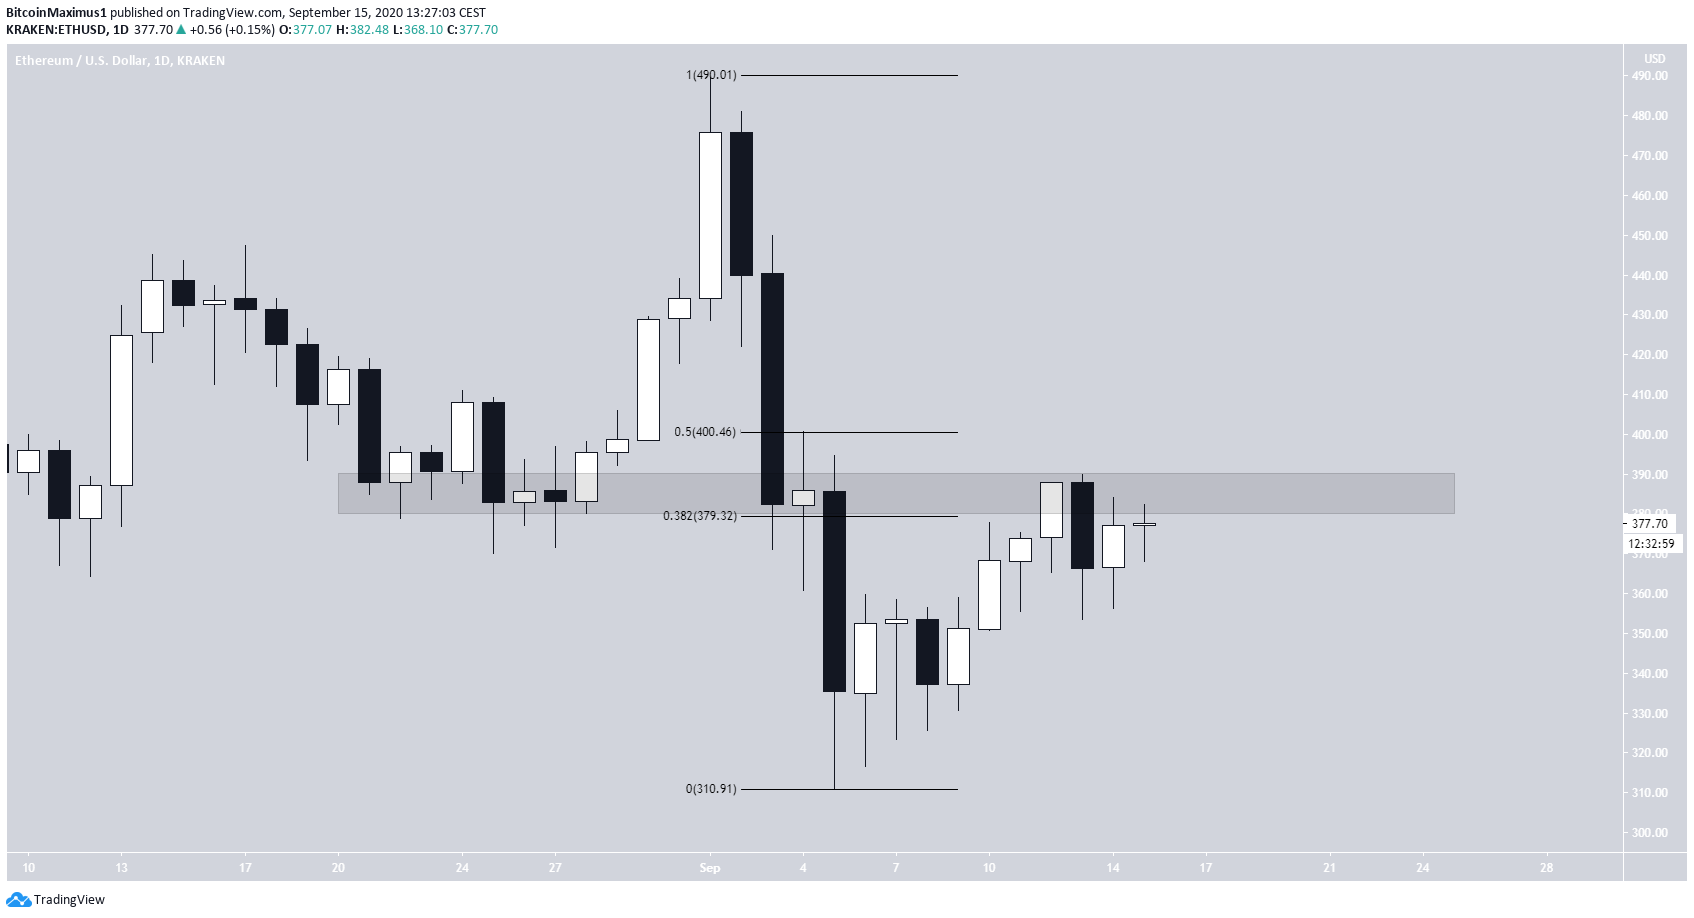
However, the price was rejected by the 0.5 Fib level of the previous downward move, creating a long upper wick. If the price were to break out above this level, the next resistance areas would be found at $545 and $690.
Current ETH Rejection
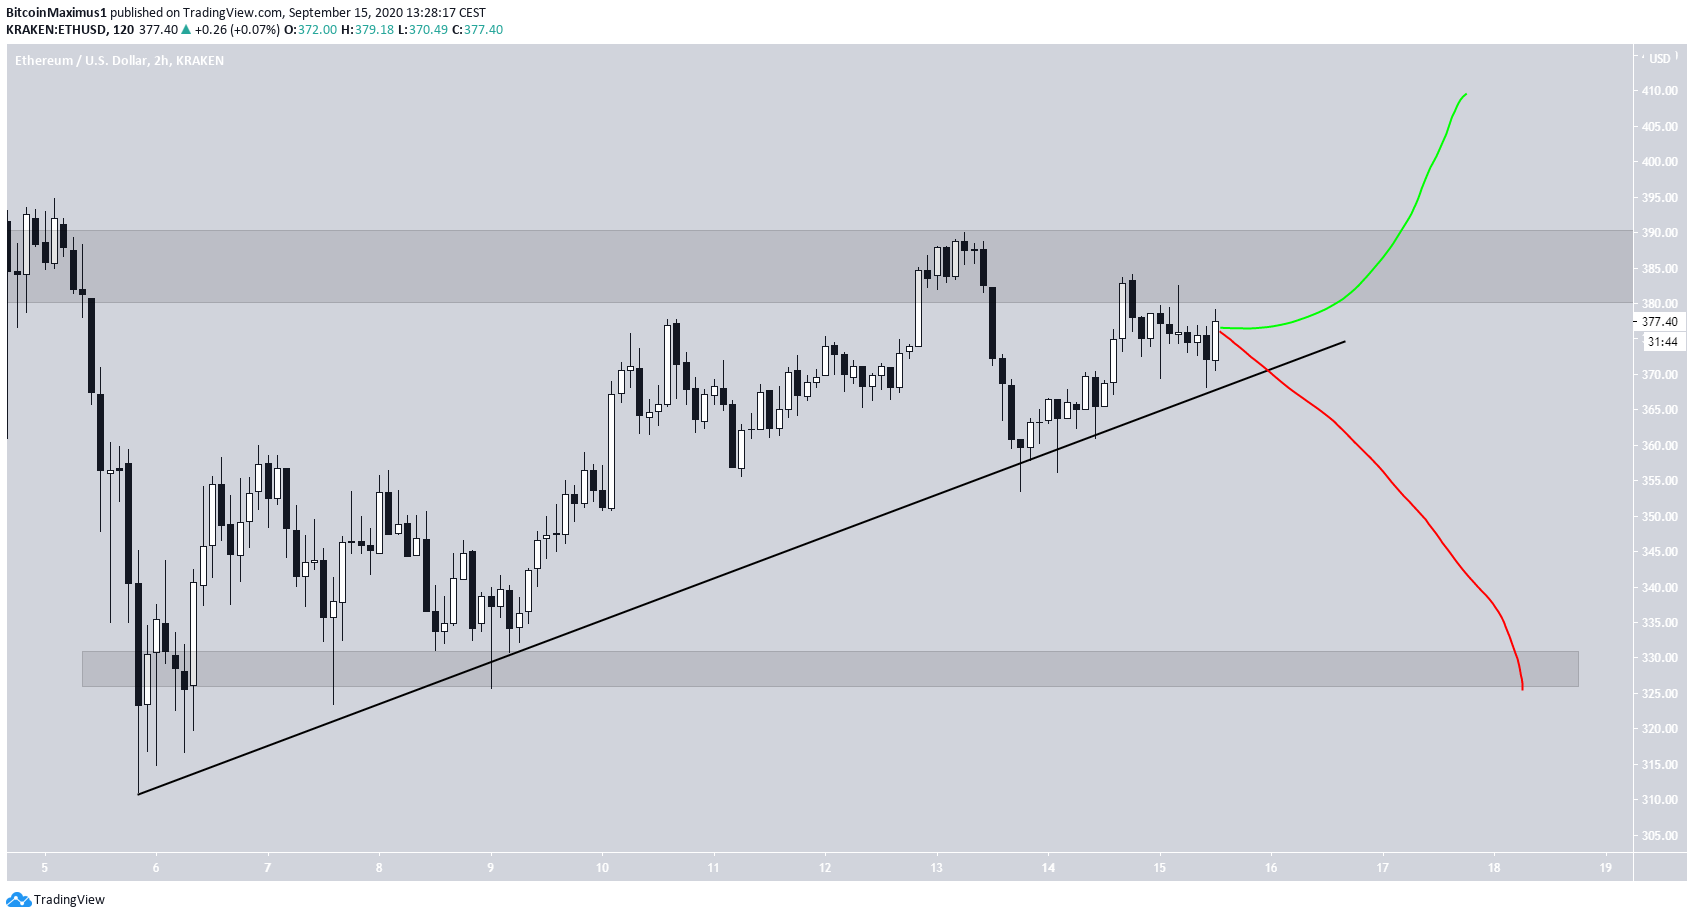
A closer look at the daily chart reveals that ETH has been rejected by the $390 area, which is both the previous support level now turned resistance and between the 0.382 – 0.5 Fib levels of the entire previous decline.
The level has already rejected the price once. Until ETH successfully breaks out above this level, it’s more likely that the recent rally from the September 5 lows is a retracement rather than the beginning of a new upward move.
The rejection would be confirmed by a breakdown from the short-term ascending support line, which has been in place since the previous lows. This would likely cause a price fall towards the minor wick support at $325.
ETH/BTC
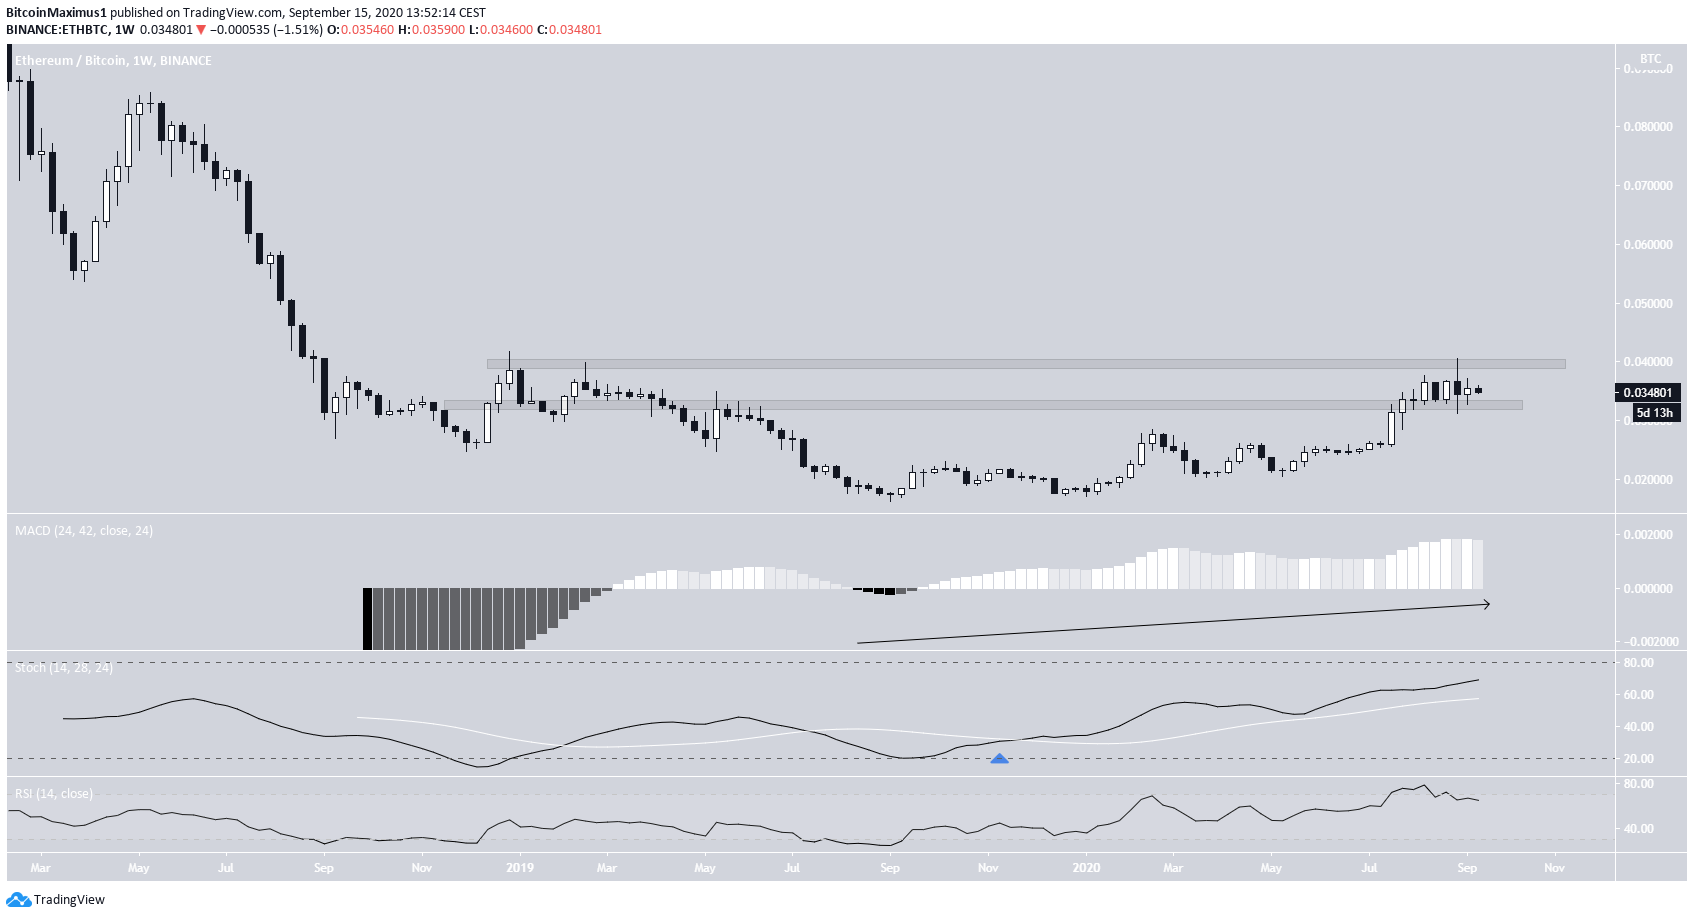
The ETH/BTC pair has very similar technical indicator readings on the weekly time-frame. The Stochastic oscillator has already made a bullish cross and the MACD is rising. While the RSI is oversold, it has not formed any bearish divergence yet.
At the time of writing, the price was trading between support and resistance at ฿0.0325 and ฿0.040, respectively, having validated the former as support several times.
A breakout above the resistance area could trigger a very rapid rise since there is almost no resistance all the way to ฿0.055.