
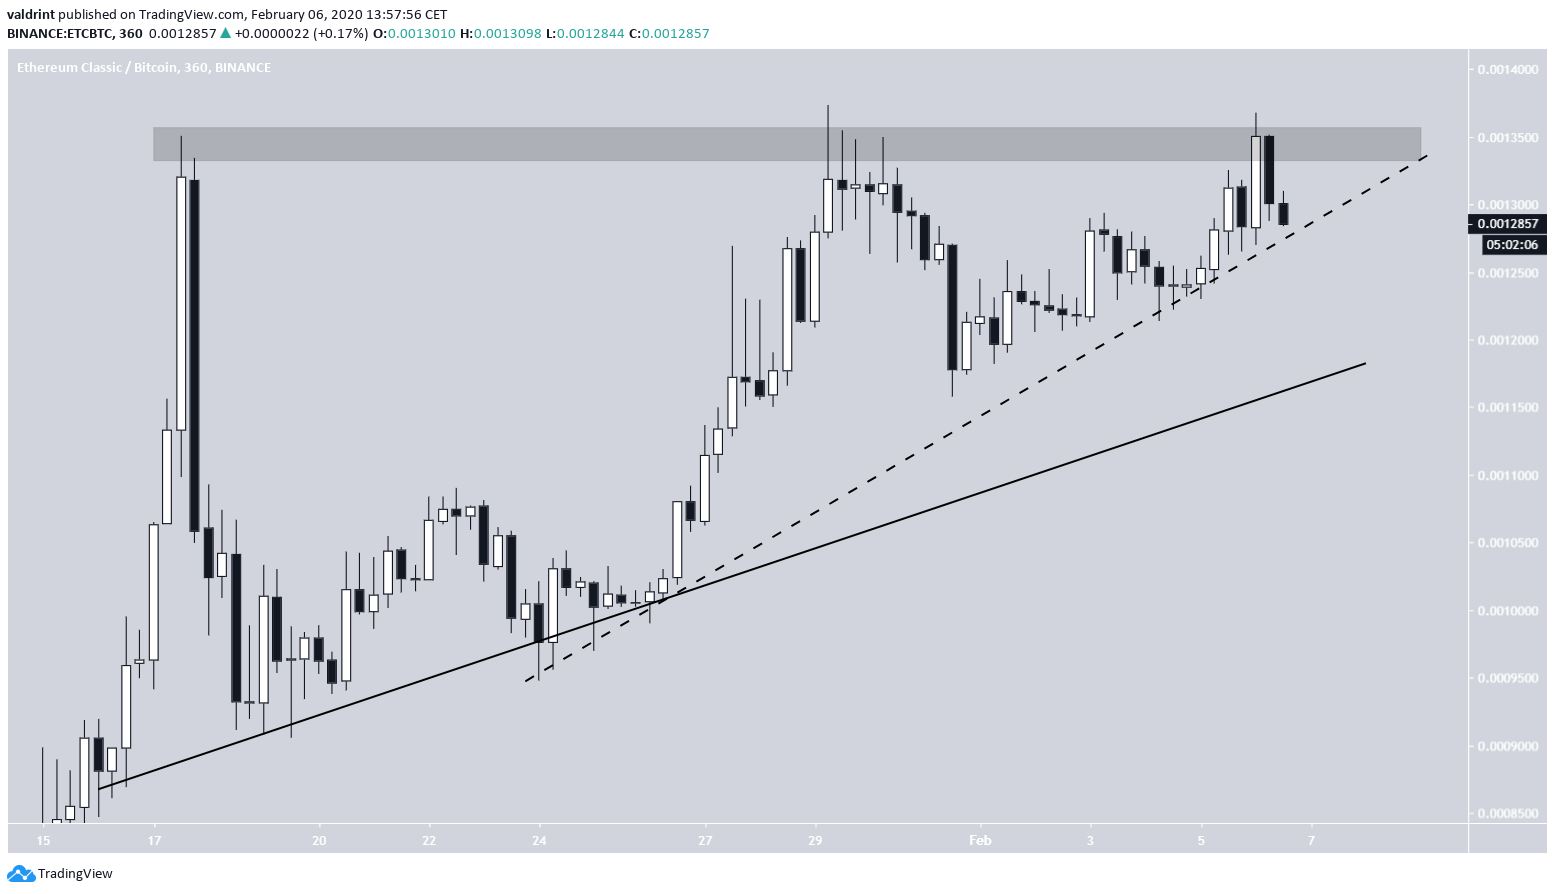
On January 17, the Ethereum Classic (ETC) price reached a high of ₿0.00135 before decreasing slightly. Since then, it has reached the same level twice more — but has failed to breakthrough.
Ethereum Classic Highlights
- ETC is trading inside an ascending triangle.
- There is resistance at ₿0.0013 and ₿0.0015.
- Short-term technical indicators are bearish.
Trader @PostyXBT tweeted an ETC price chart which shows that the price is trading inside an ascending triangle. He stated that the “price goes up, volume goes down.” What is expected afterward is a breakout.
Price goes up, volume goes down.
What's next? pic.twitter.com/rixZmy2az3
— Posty (@PostyXBT) February 6, 2020
Will ETC break out? If so, what target will it reach? Continue reading below if you are interested in finding out.
Ethereum Classic in an Ascending Triangle
The ETC price is indeed trading inside an ascending triangle. While the resistance line is clearly at ₿0.00135, there are two possible ascending support lines in place — one steeper than the other.
If the price is following the dashed-ascending support, we should expect a rapid movement within the next two days. If, however, the correct line is the solid one, then the price will continue consolidating for several more weeks.
We believe that the dashed line has a higher probability of being the correct one.
When combined, the RSI and price movement suggest that a breakout is unlikely — at least not in the short-term.
The RSI has created a descending triangle, which is a bearish pattern. A breakdown from this pattern would take the RSI to the 50-line, above which it has been trading since the upward move began.
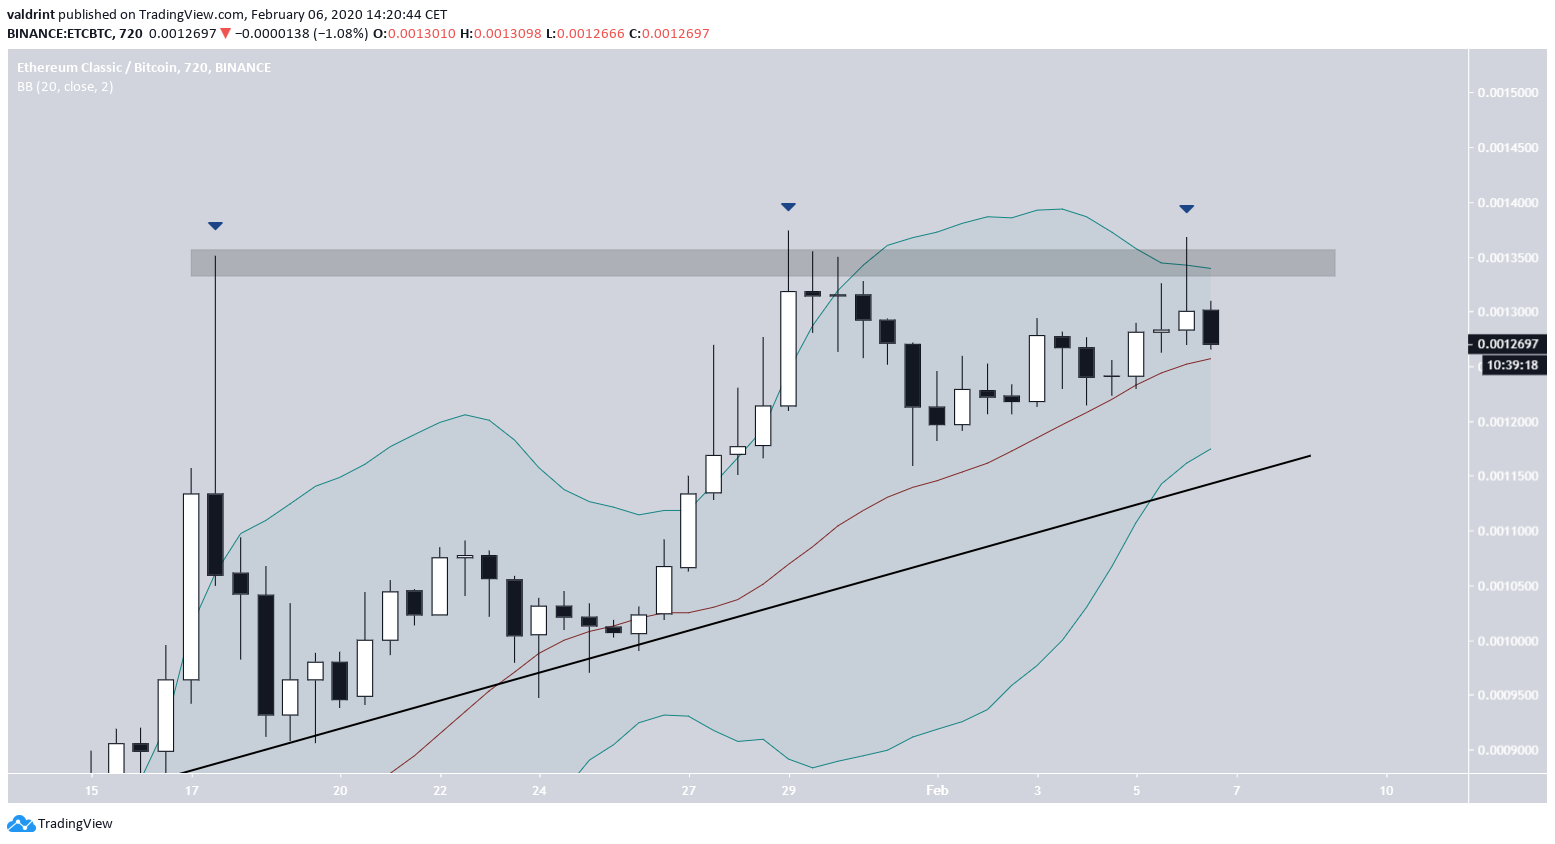
The Ethereum Classic price has shown some weakness in the form of a possible triple top. Thrice has the price reached the ₿0.00135 resistance area and was rejected, creating long upper wicks each time.
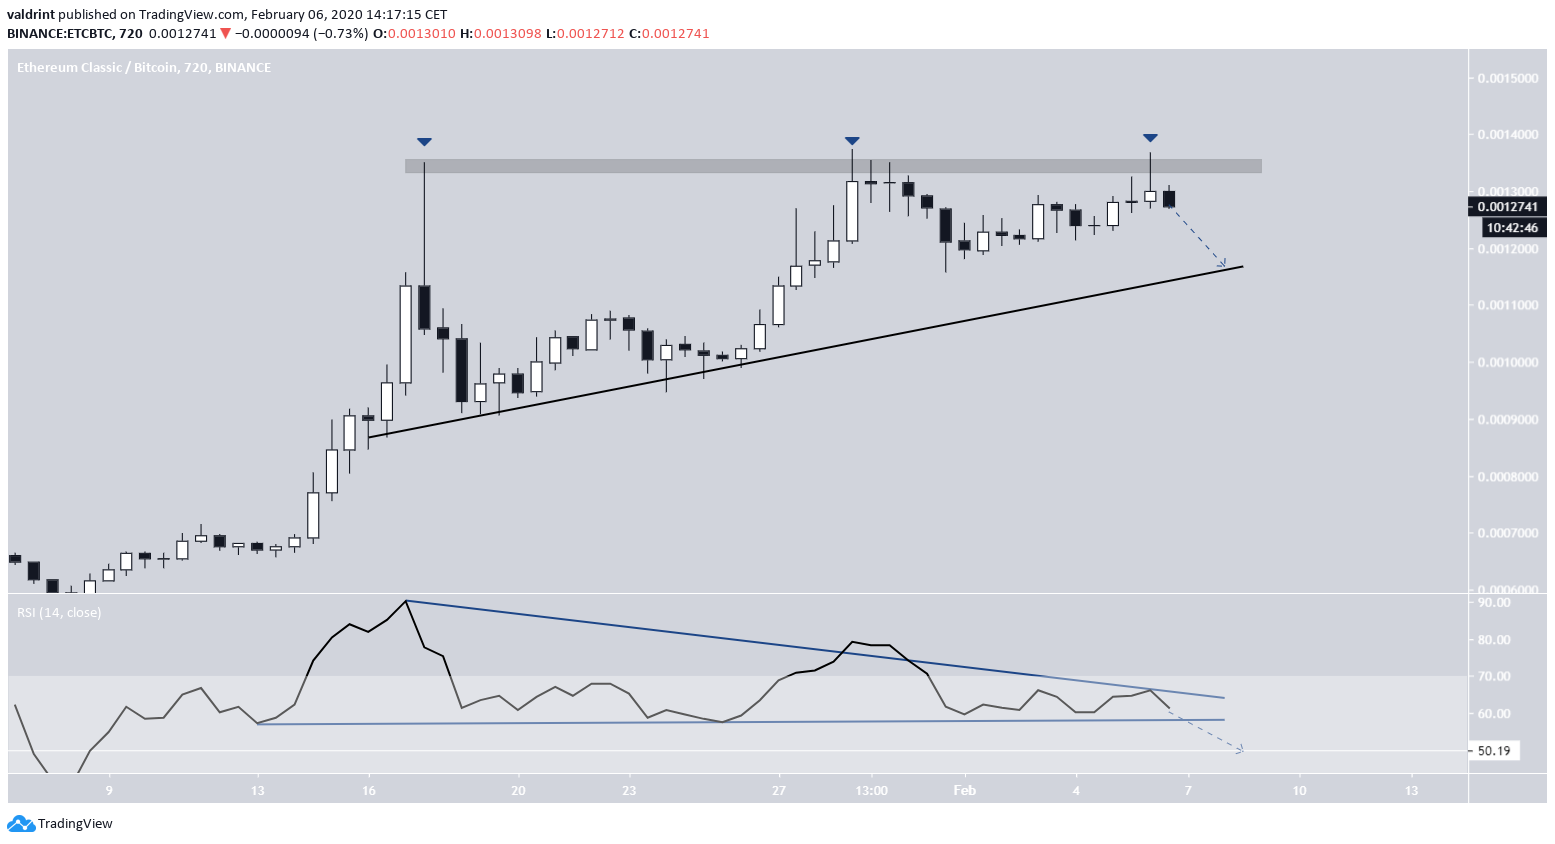
Staying with the same time-frame, we can see that the price moved above the upper Bollinger Band during the creation of the latest upper wick. This movement caused a reversal the other two times it happened — which also coincided with this resistance area.
Therefore, the same could occur now, especially since a decrease is also predicted by the RSI and the creation of a triple top.
The ascending support line is currently at ₿0.0012.
Future Movement
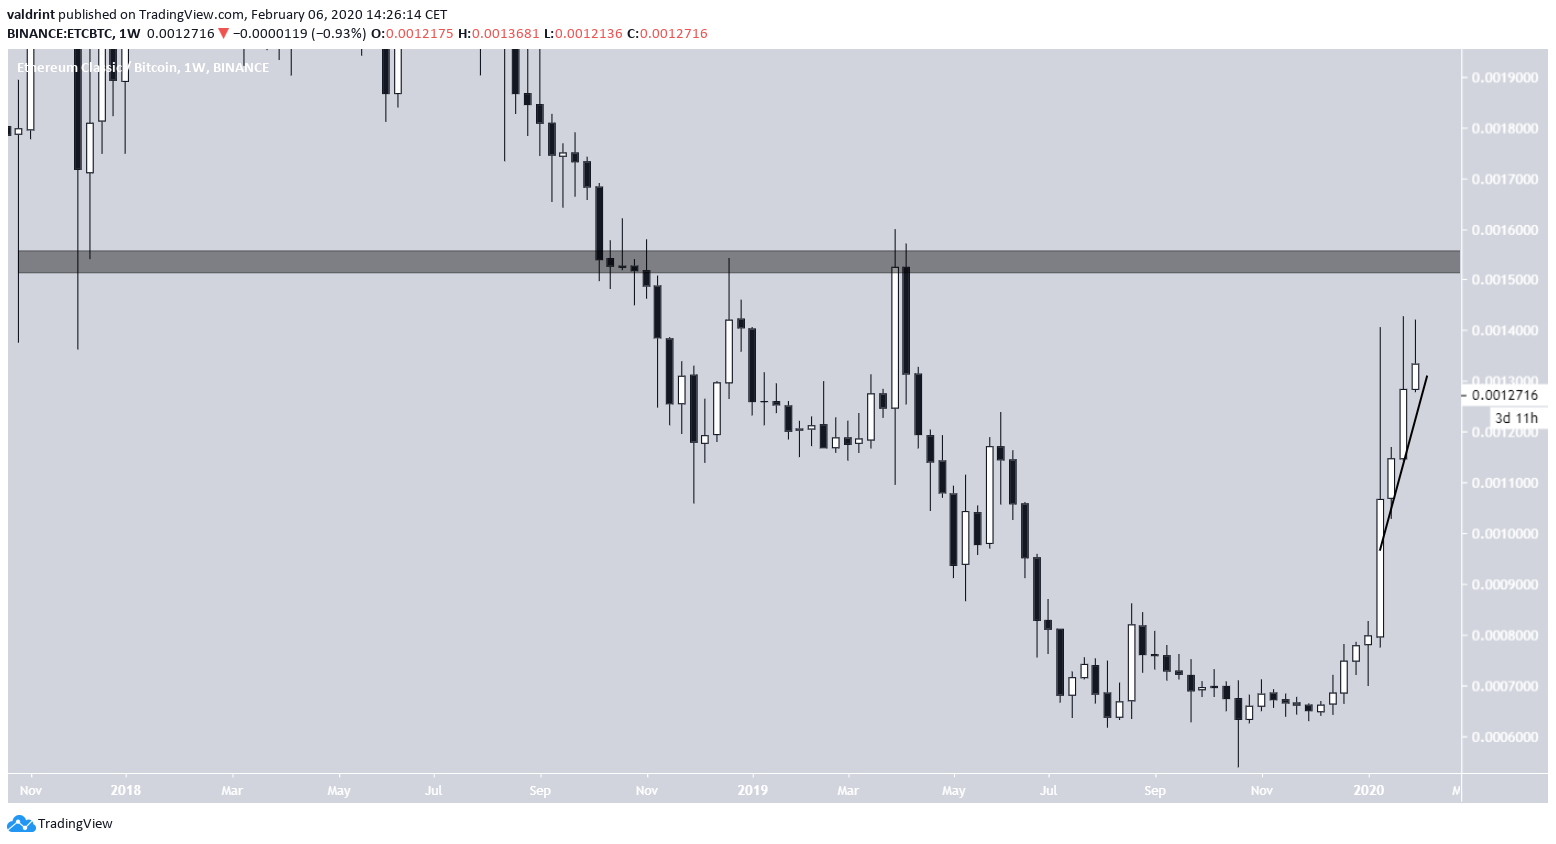
As for the future movement, the most significant resistance area is found at ₿0.0015. So, after a decrease in the support line of the triangle and consolidation, the ETC price could break out.
However, due to the weakness it has already generated, we believe that the ₿0.0015 resistance area will act as the absolute upper limit for the price movement. Therefore, we do not expect the price to continue moving above it.
The weakness is further accentuated by the creation of three long upper wicks in a row.
To conclude, the Ethereum classic price is trading inside an ascending triangle. We believe it will continue to consolidate in this triangle. If it breaks out, the upside potential is limited, since we are not expecting the price to increase above ₿0.0015.
