
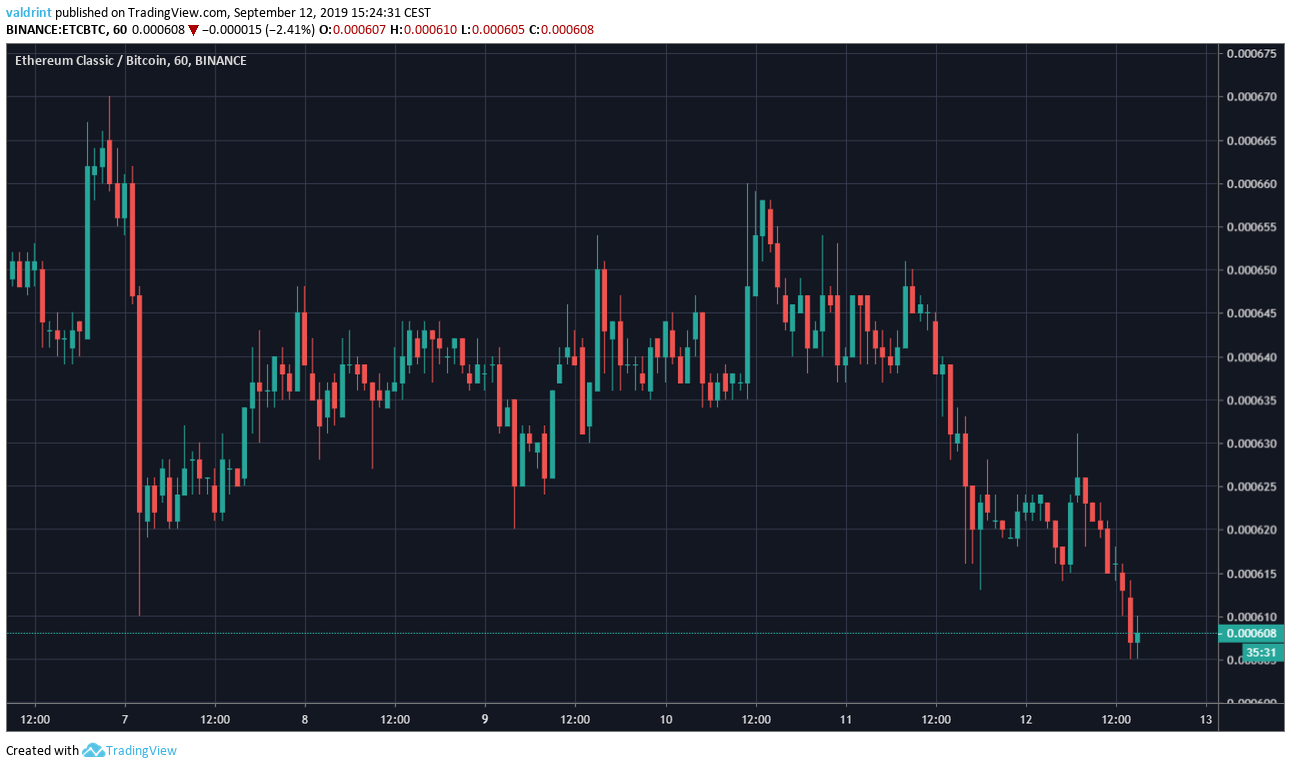
On September 6, 2019, the Ethereum Classic price reached a high of 670,000 satoshis. A rapid decrease followed, and ETC made a low of 626,000 satoshis the same day. After an upward move that lasted until September 10, ETC began another downtrend and reached a lower low of 605,000 satoshis on September 12.
How long will ETC continue to decrease? Keep reading below if you are interested in finding out.
For our previous analysis click here.
Ethereum Classic Price: Trends and Highlights for September 12
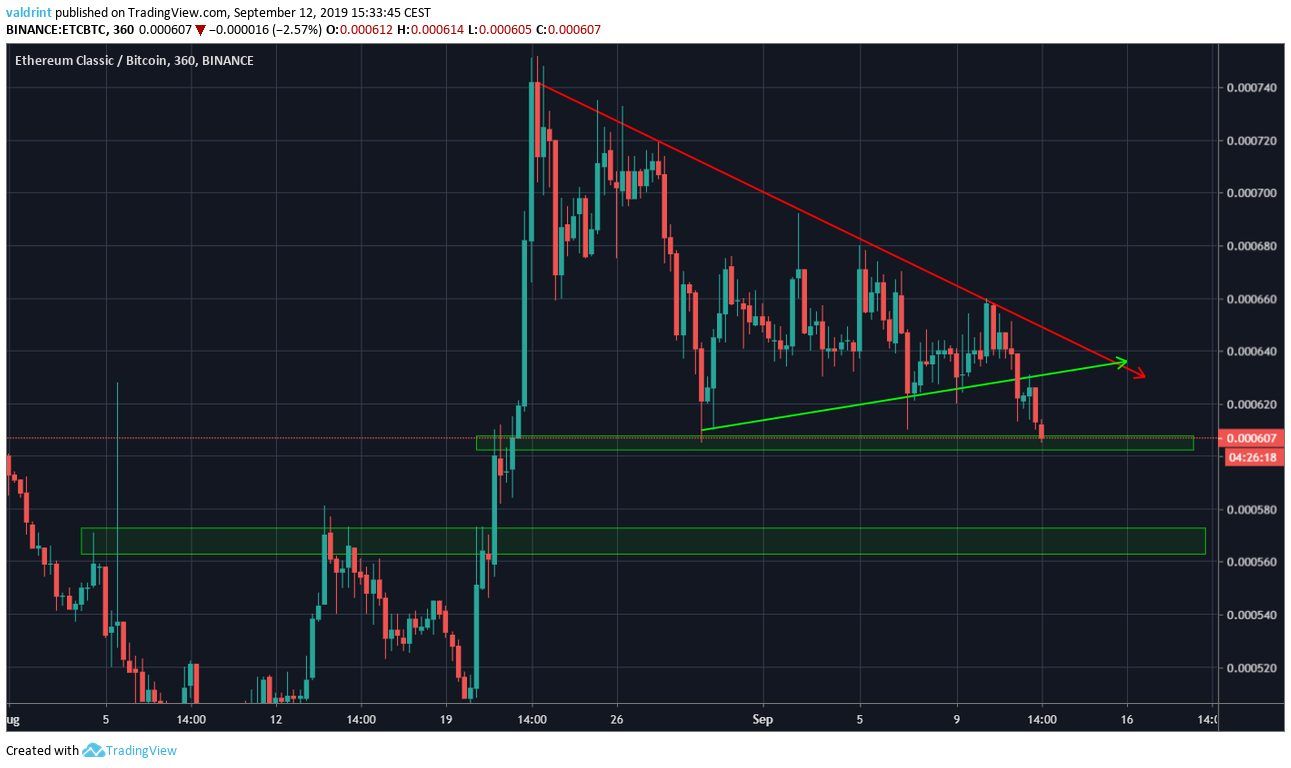
- ETC broke down from a symmetrical triangle.
- There is support at 600 and 570 satoshis.
- Daily candlesticks give a bearish outlook.
- The daily moving averages are very close to making a bearish cross.
- Daily MACD has almost crossed into negative territory.
Previous Movement
A look at the six-hour chart shows that ETC had been trading inside a symmetrical triangle since August 22.
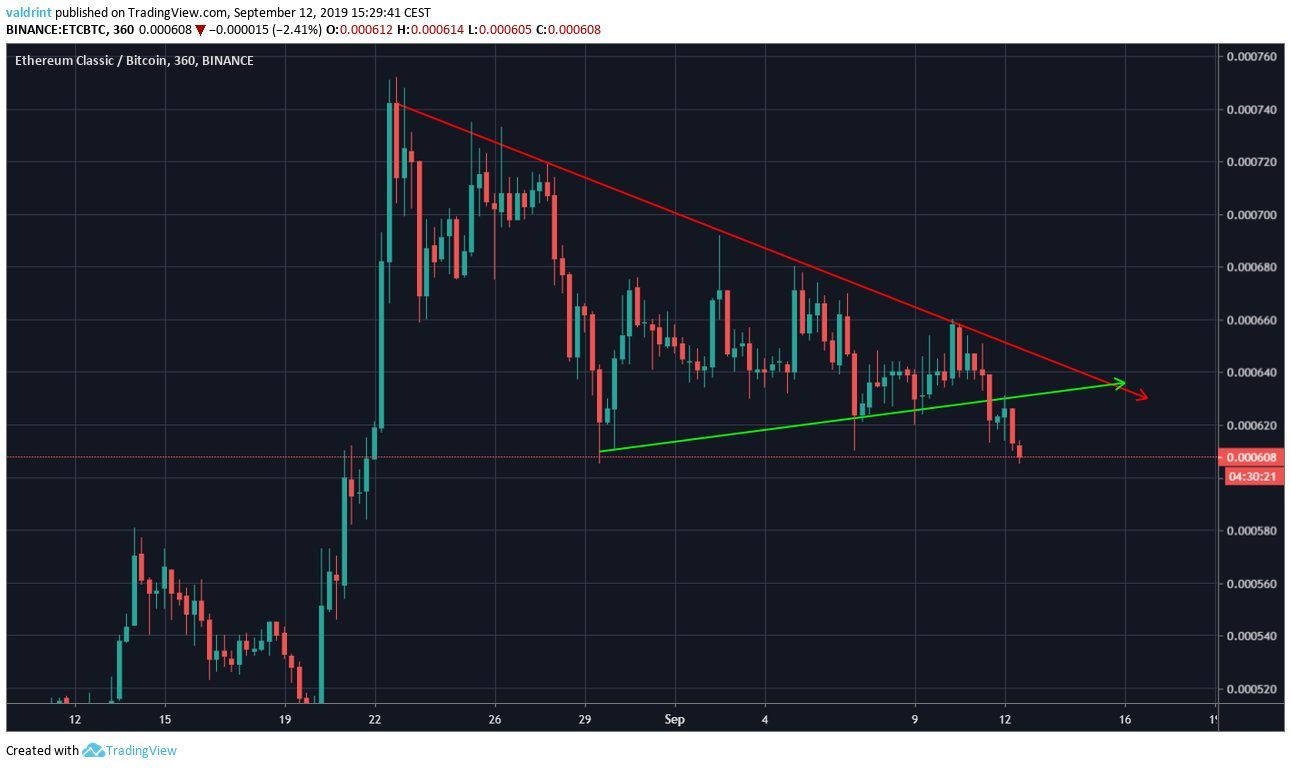
On September 11, it broke down from the triangle.
It is currently decreasing without following a trading pattern.
Candlestick Analysis
A look at the daily candlesticks suggests that a decrease is already under way and is likely to continue.
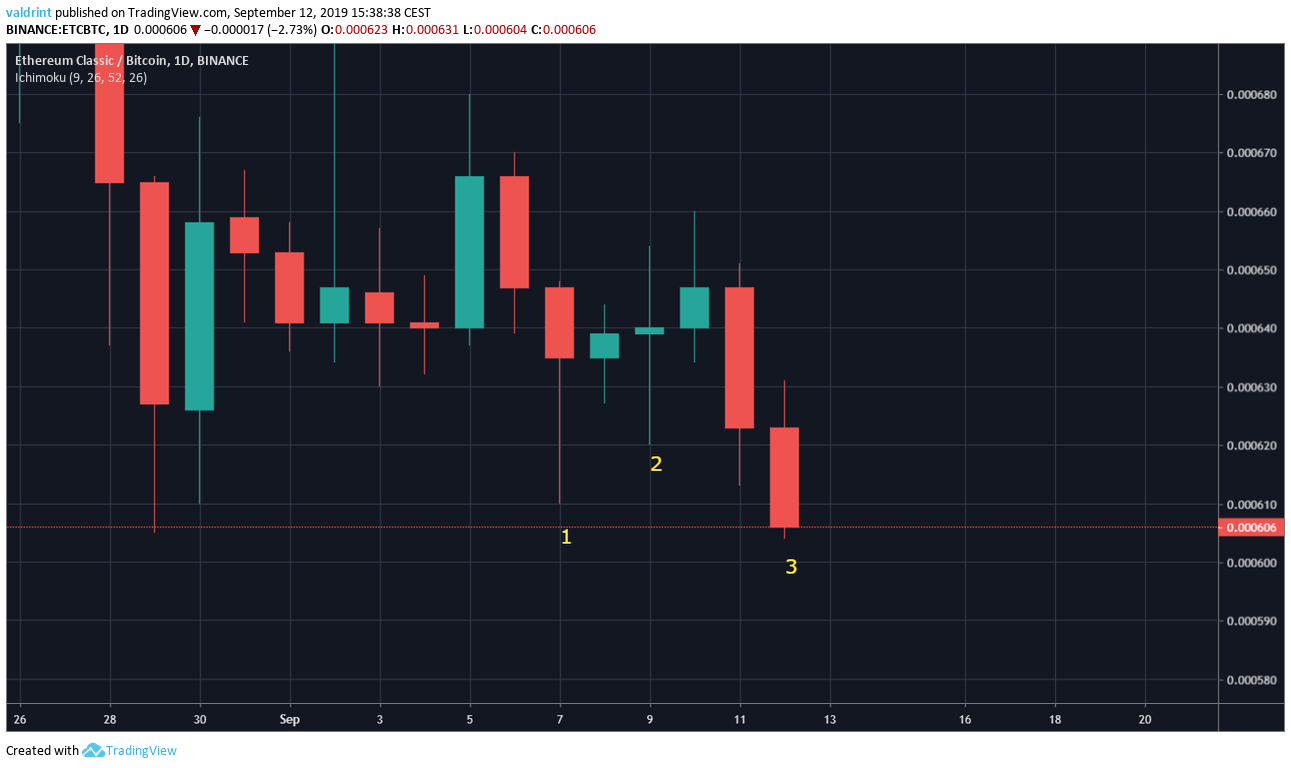
On September 7, at (1), the price created a hammer. Even though the close was bearish, it indicated that buyers are starting to enter the market.
This was followed by three bullish dojis (2). While the bulls were starting to gain power, the market was still undecided.
The breakdown point came at (3) when the price created two bearish engulfing candlesticks in a row and decreasing below the low of (1).
Ethereum Classic Price Downtrend Confirmation
In order to confirm whether a downtrend has begun, we will look at the daily moving averages (MA) and the MACD.
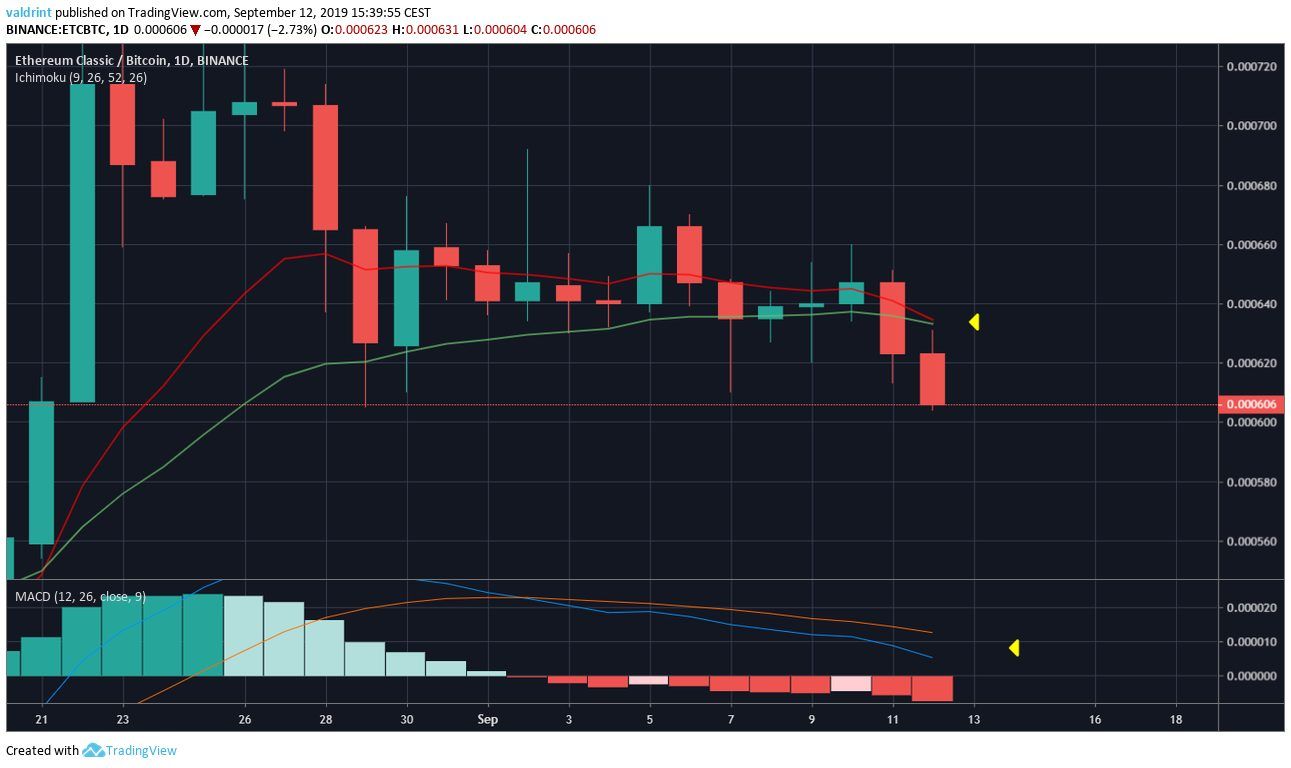
The price is trading below the 10- and 20-day MAs, facing very close resistance from both. The MAs have almost made a bearish cross.
Additionally, the MACD is rapidly decreasing, nearly crossing into negative territory.
If both these were to occur, it would be a confirmation that the downtrend is under way.
Support Areas
Two support areas are outlined below.
The first one is at 600 satoshis, identified by the long lower wicks created once the price got there on August 29 and September 7. It is a minor support area.
The second one is at 570 satoshis, found by the highs of August 4 and 14. Conversely, it is a major support area.
While the price is currently inside the minor area, we do not believe that will be successful in reversing the price.
Rather, we expect ETC to decrease towards the second area.
Ethereum Classic Price Summary
The ETC price recently broke down from a symmetrical triangle.
According to our analysis, it is likely to continue decreasing until it reaches 570 satoshis.
For hypothetical trading purposes, we would consider initiating a long on ETC once/if it reaches the 570 satoshi area, depending on if there are reversal signs.
Do you think ETC will reach the support area? Let us know in the comments below.
Disclaimer: This article is not trading advice and should not be construed as such. Always consult a trained financial professional before investing in cryptocurrencies, as the market is particularly volatile.
Images are courtesy of TradingView, Shutterstock.
