


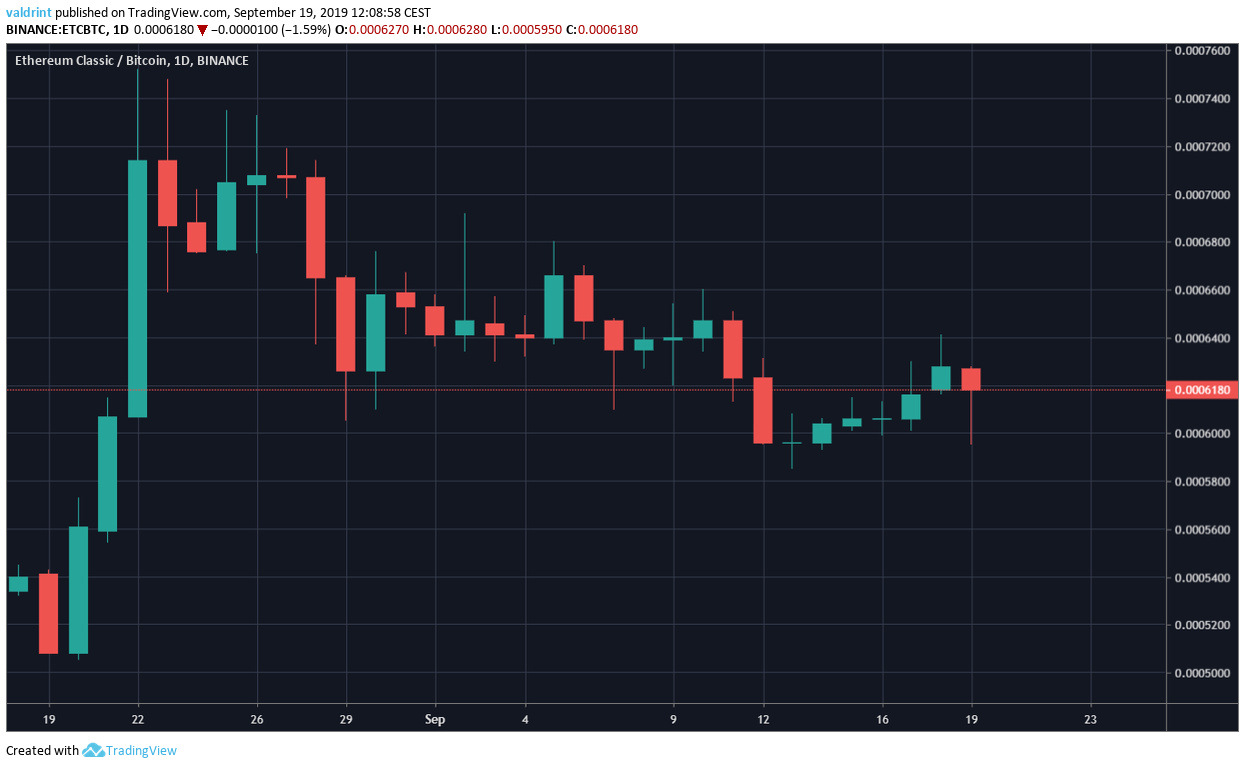
On August 19, the ETC price reached a low of 50,500 satoshis. Over the next three days, a rapid upward move followed. ETC reached a high of 75,200 satoshis on August 22. It has been decreasing since.
How long will ETC continue to decrease? Keep scrolling below if you are interested in finding out.
For our previous analysis click here.
Ethereum Classic Price: Trends and Highlights for September 19
- ETC broke down from a symmetrical triangle.
- There is support at 56,000 satoshis.
- 10- and 20-day moving averages have made a bearish cross.
- ETC is facing resistance from its 100-day moving average.
- The RSI has developed hidden bearish divergence.
Previous Ethereum Classic Price Movement
A look at the Ethereum Classic price movement for the past 30 days shows that ETC was trading inside a symmetrical triangle since August 22.
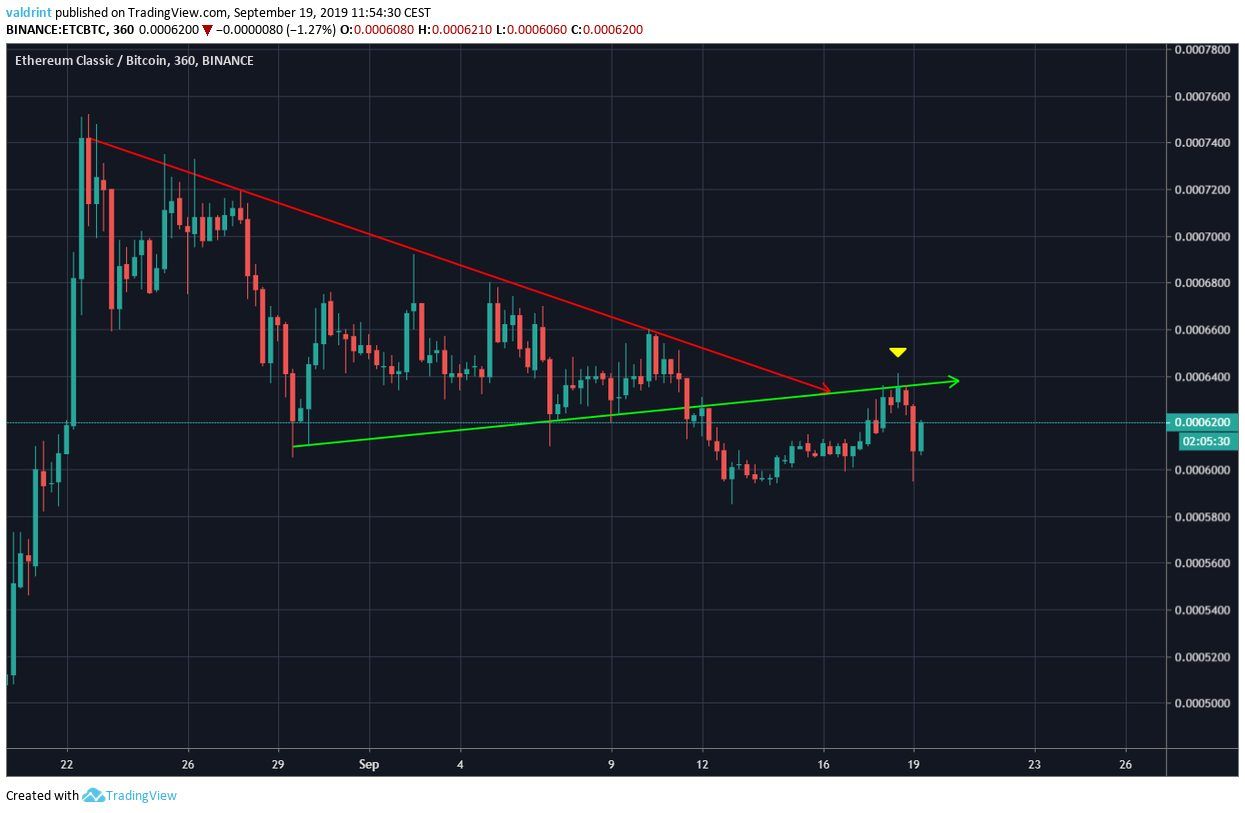
On September 12, it broke down below the support line, before increasing and validating it as resistance on September 18.
Where will the ETC price go next?
Retracement Levels
Looking at the daily chart we can identify one support area, which is a suitable level for the initiation of a reversal.
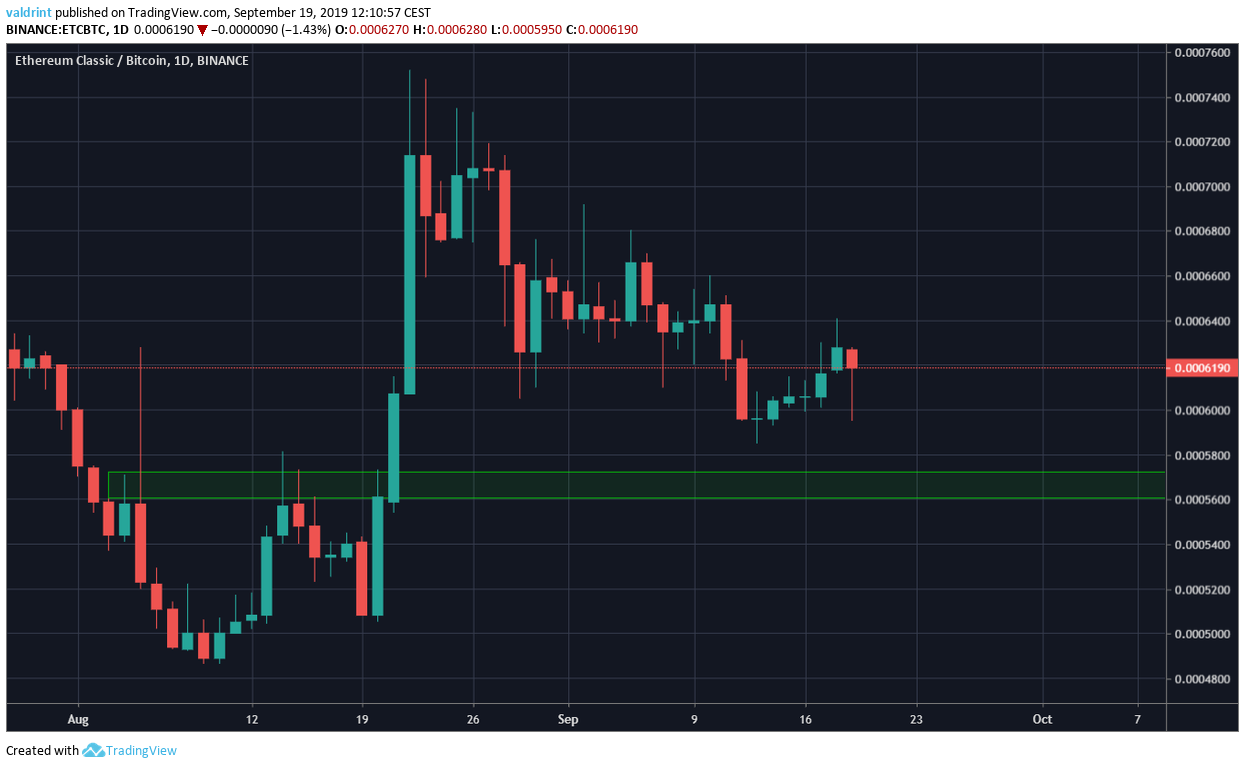
It is found at 56,000 satoshis.
This are would be a very suitable level to mark the end of the retracement and allow the price to continue with its upward move.
Moving Averages
A look at the daily moving averages (MA) suggests that the ETC price is likely to reach it in the near future.
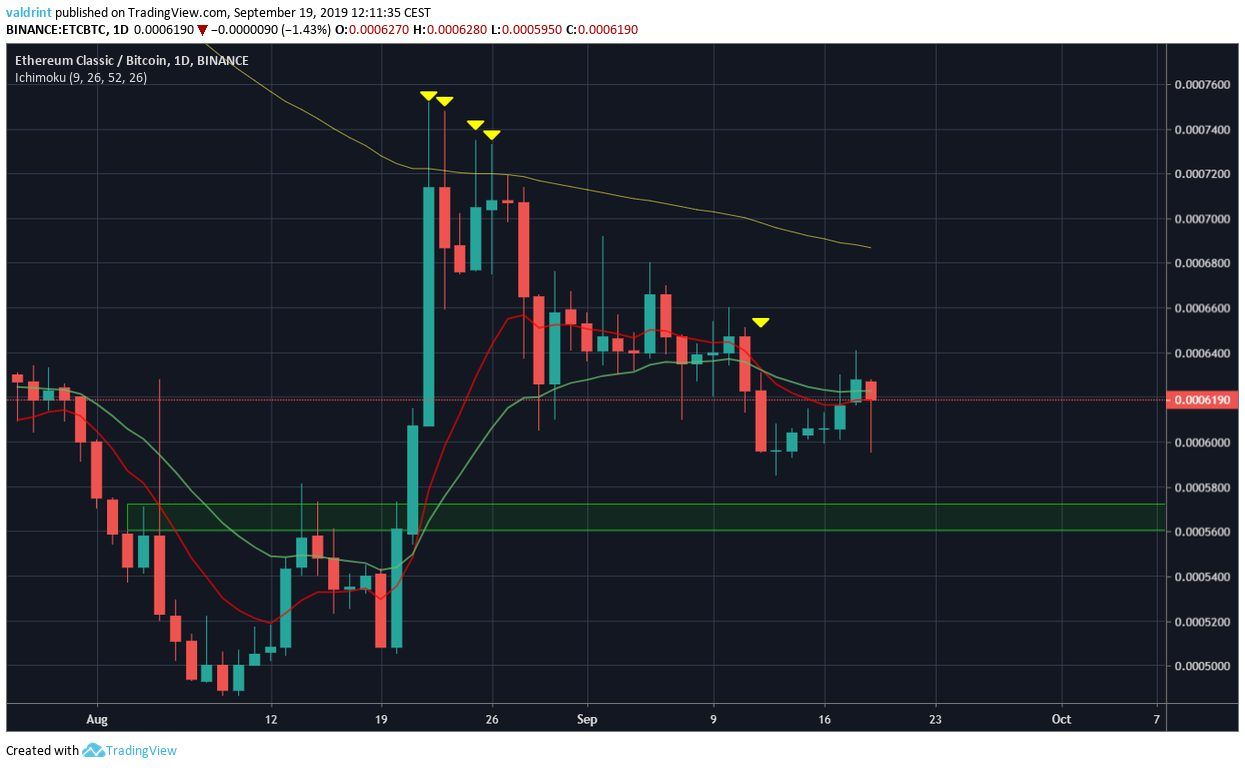
A bearish cross between the 10- and 20-day MAs transpired on September 10.
Since then, the Ethereum Classic price has been trading below both, facing very close resistance from the former.
At the time of writing, ETC was making an attempt at moving above the MAs. If this movement turns out unsuccessful, ETC is likely to decrease and reach the support area.
Additionally, we can see that the upward move beginning on August 20 (discussed in the introduction) ended once the price reached the 100-day MA. There, it created long upper wicks, indicating strong selling pressure before decreasing rapidly. This reiterates the strong resistance above the current prices.
Hidden Divergence
The bearish sentiment is strengthened once we take a look at the RSI.
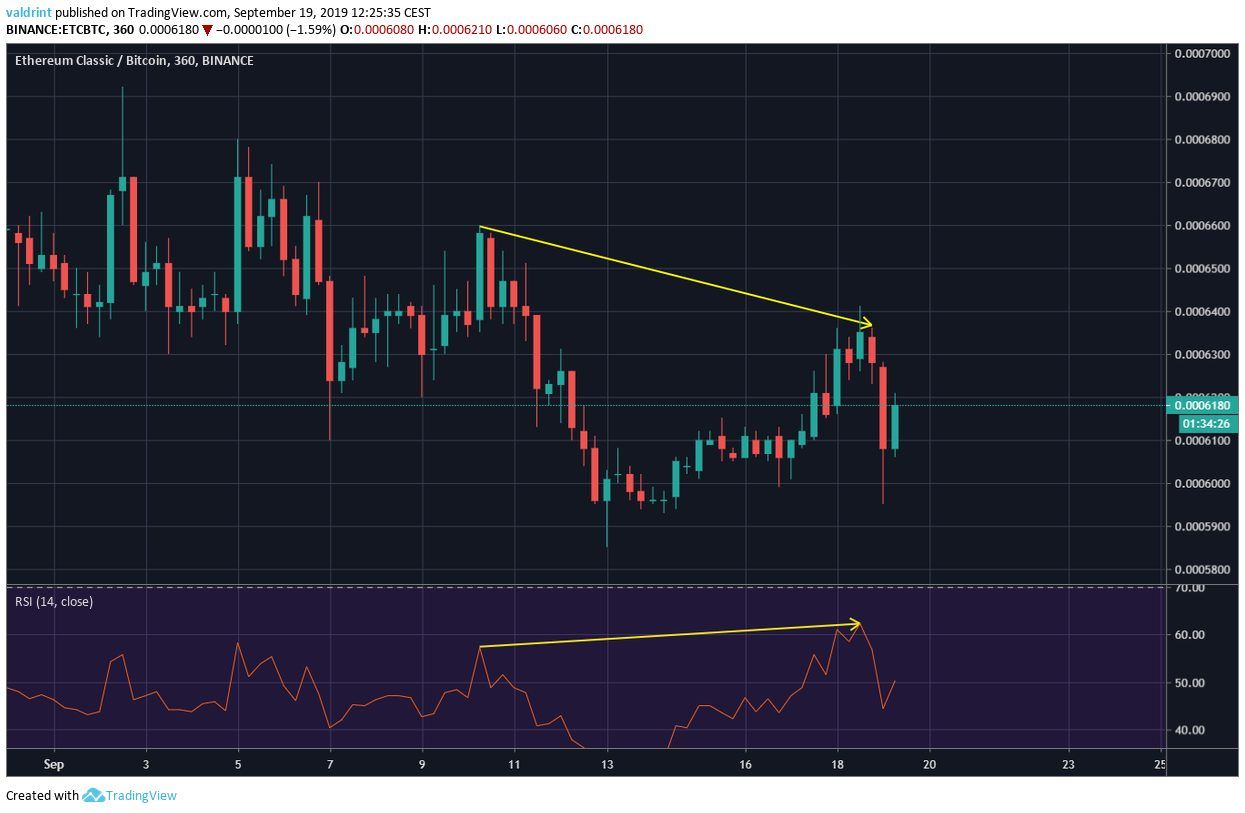
It has generated hidden bearish divergence between the two lower high of September 10 and 19.
While this is not as significant as regular divergence and does not often precede a reversal, it is a sign of continuation of the prior trend.
Since the underlying medium-term trend is bearish, we believe the trend is likely to continue.
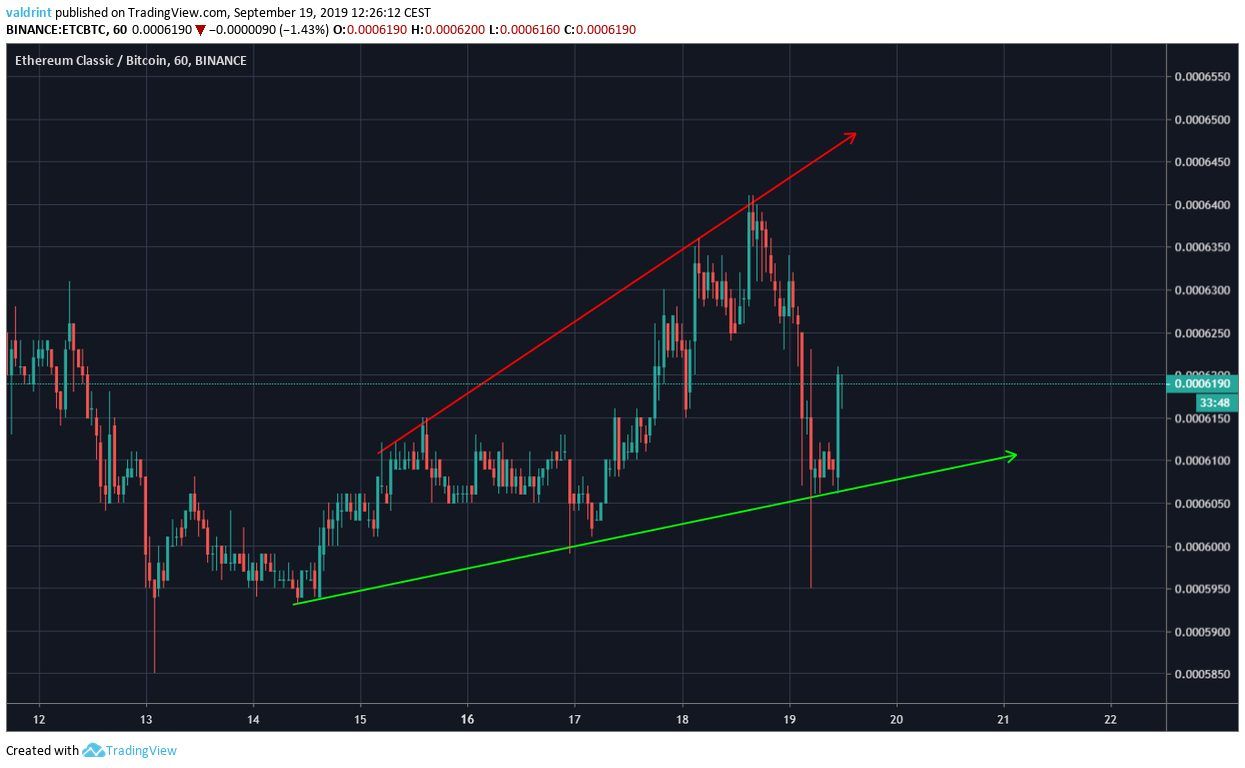
Future Movement
The hourly chart shows that the ETC price is trading inside an ascending broadening wedge.
Ethereum Classic Summary
The ETC price recently broke down from a symmetrical triangle.
According to our analysis, it is likely to continue decreasing until it reaches the support area at 56,000 satoshis.
For hypothetical trading purposes, even though we believe ETC will decrease, the current price structure does not allow for the identification of a profitable trade.
If the ETC price reaches our support area, initiating longs will be considered.
Do you think ETC will reach the support area? Let us know in the comments below.
Disclaimer: This article is not trading advice and should not be construed as such. Always consult a trained financial professional before investing in cryptocurrencies, as the market is particularly volatile.
Images are courtesy of TradingView, Shutterstock.


