


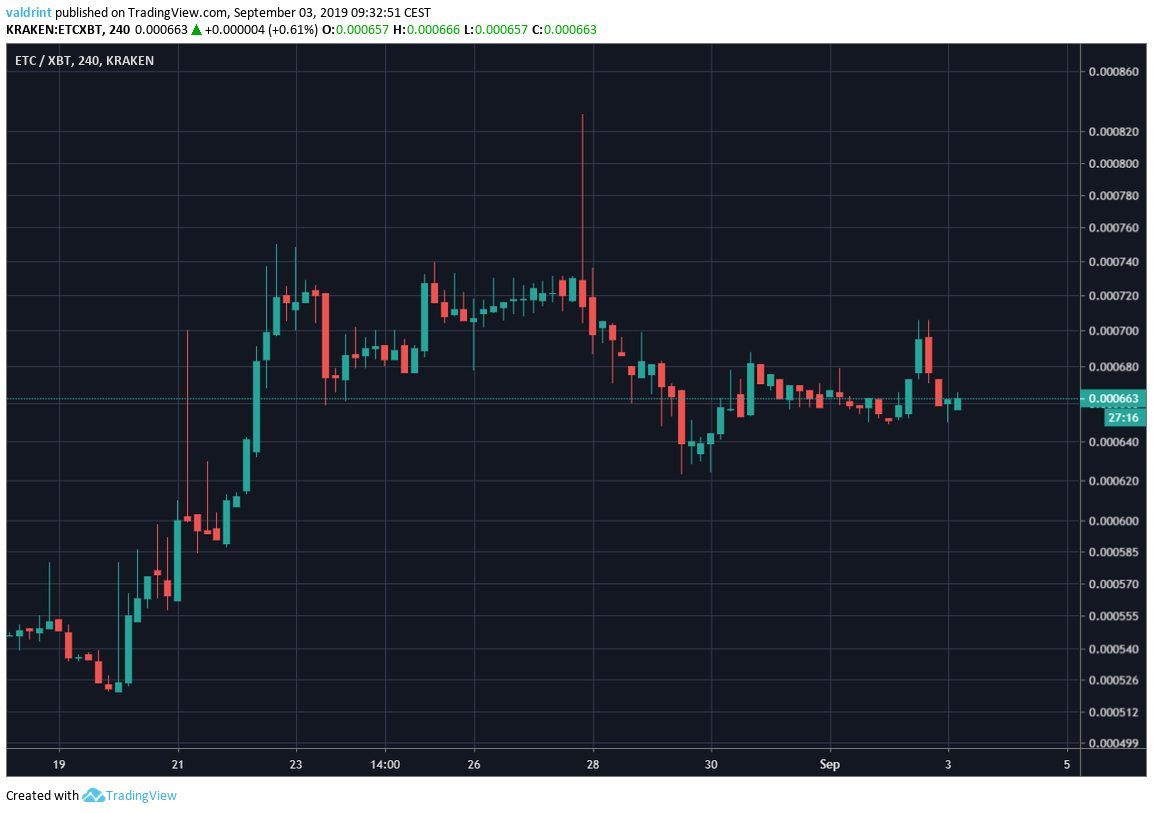
On August 20, 2019, the Ethereum Classic price reached a low of ₿0.000521. An upward move ensued. On August 22, it reached a high of ₿0.000750. After reaching a higher high on August 27, the ETC price has been decreasing.
How long will this Ethereum Classic price decrease continue? Continue reading below if you want to find out.
For those of you who would prefer a video analysis, please click below:
Ethereum Classic Price: Trends and Highlights for September 3
- ETC is trading at an all-time low.
- The weekly RSI has generated bullish divergence.
- The price is struggling to move above the weekly moving averages.
- ETC is trading inside a descending channel.
- There is support at ₿0.000500.
Long-Term
A look at the weekly time-frame for ETC shows that the price is trading at an all-time low.
The logarithmic chart is used to better visualize price fluctuations.
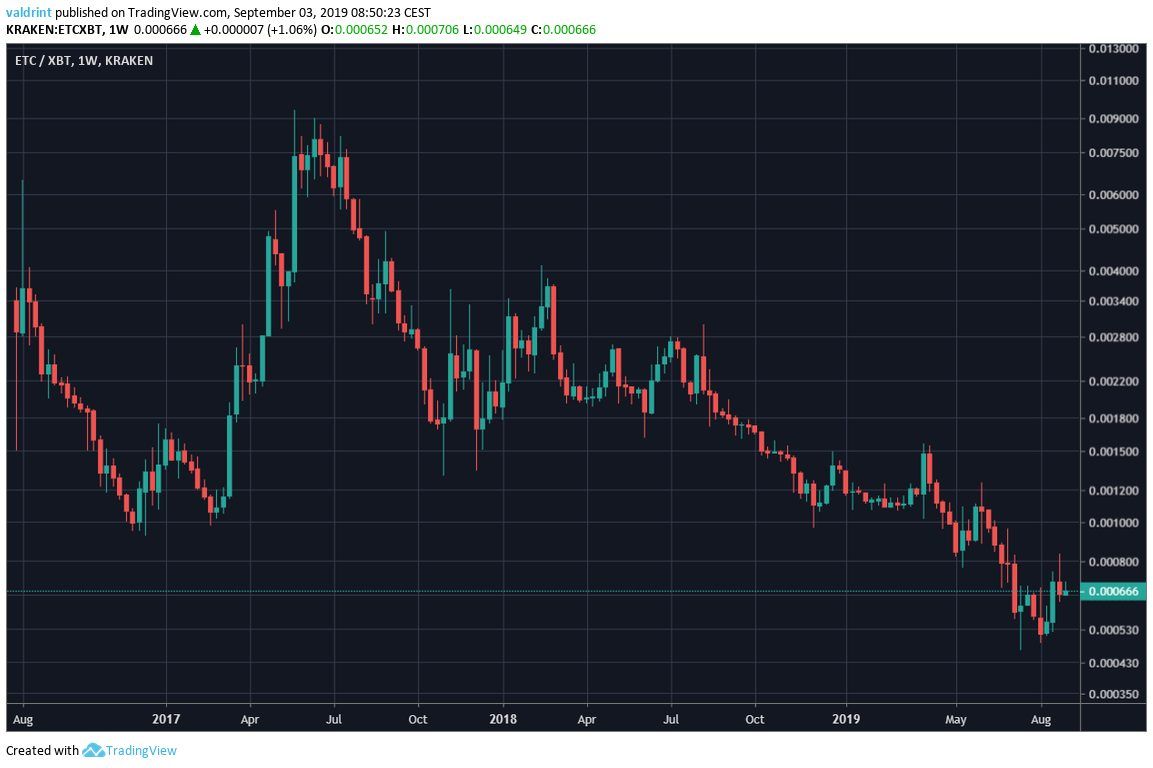
It has been doing so since April of 2019.
Since there are no support areas, it is hard to predict where ETC will make a bottom.
In order to do that, however, we will look for possible reversal signs.
Reversal Signs
A closer look at candlestick characteristics shows us that ETC has shown some signs of reversal in the form of :
- Bullish doji
- Bullish engulfing pattern
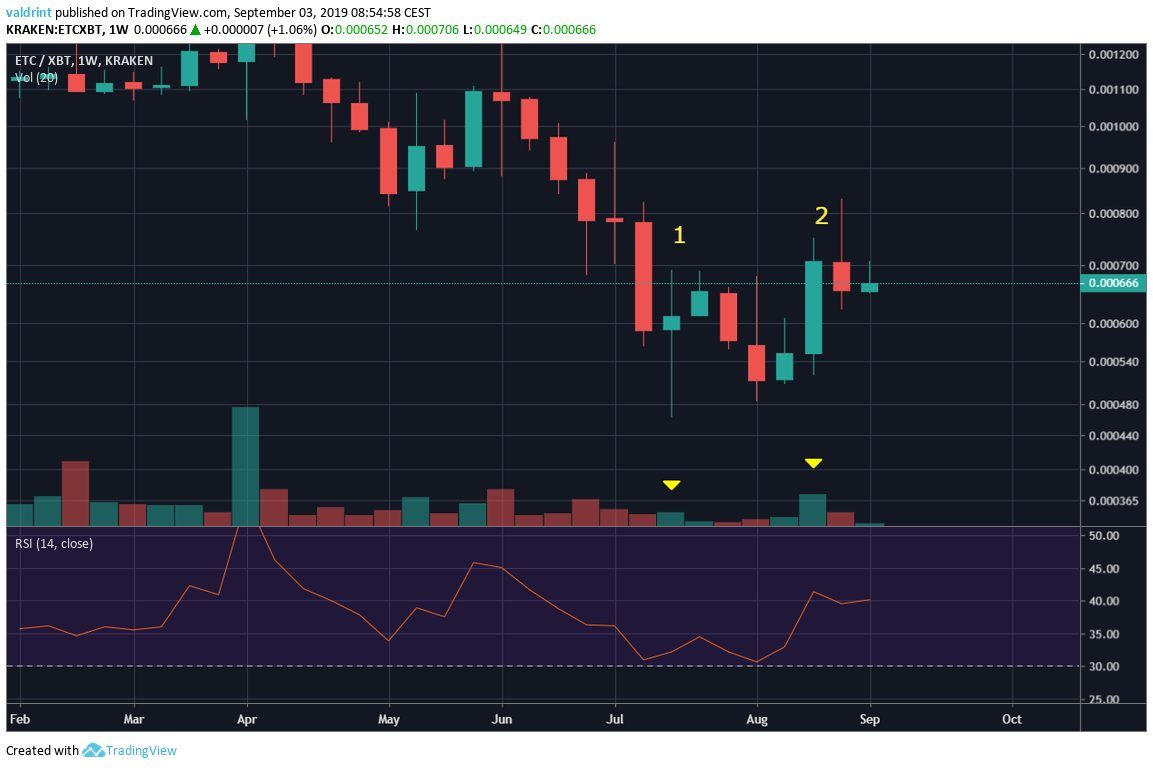
While the doji did not transpire with significant volume, it indicates that buyers have started to come alive, since it is occurring after six bearish weekly candles in a row.
Afterward, ETC created a bullish engulfing candle, confirming our possible reversal hypothesis.
A look at the RSI further validates the reversal.
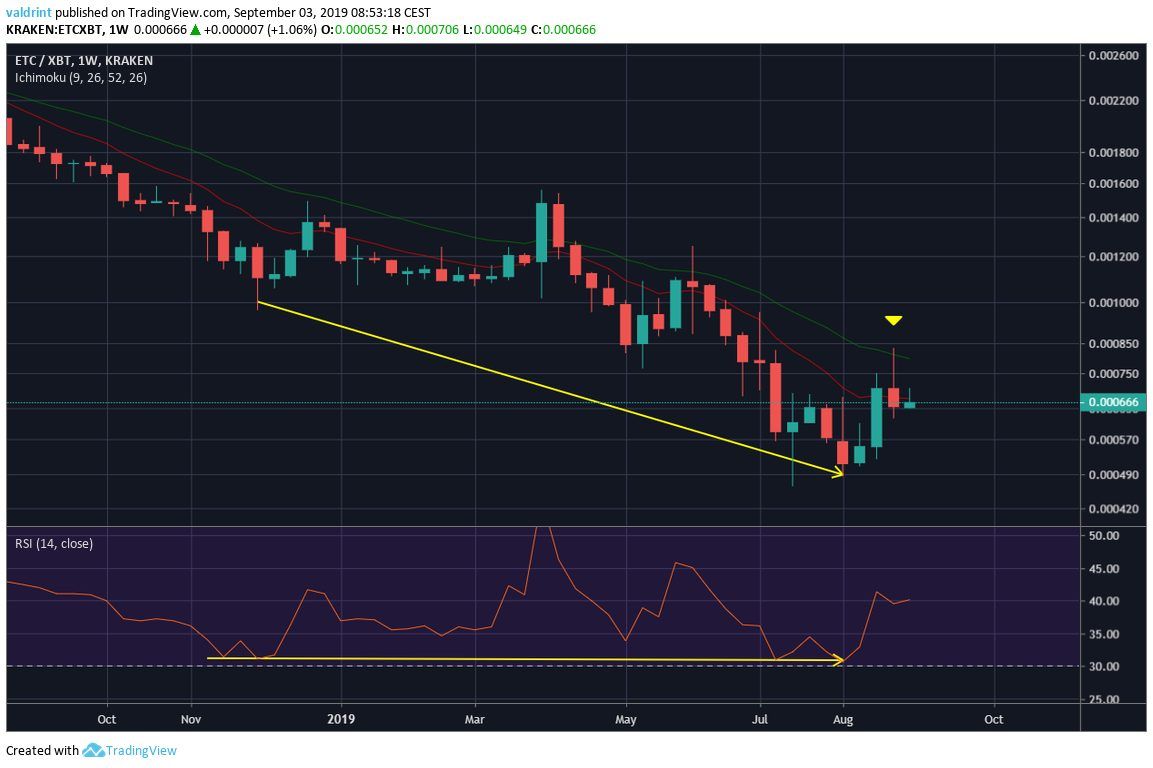
Additionally, it has not dropped into oversold territory. Rather, it has created a support area at 30.
However, the upward move stopped once the price reached the 20-week moving average (MA).
This is a sign that even though ETC wants to begin an upward move, there is significant resistance above.
Will ETC be successful in breaking out above?
Descending Channel
A look at the daily time-frame shows that ETC is trading inside a descending channel.
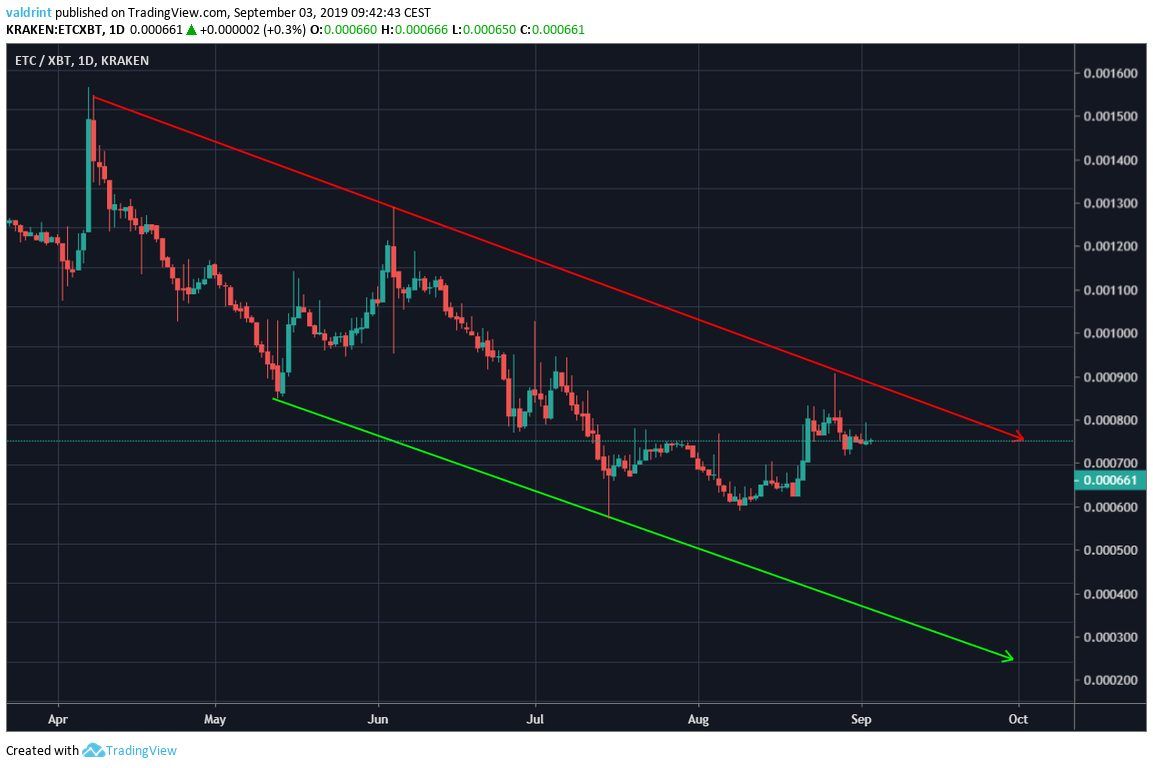
Additionally, we can see that the aforementioned upward move failed to break out above the descending resistance line.
To the contrary, ETC created a long upper wick and began to decrease.
The previous two times this happened, downward moves of varying magnitudes followed.
A look at the daily moving averages reiterates the strong resistance immediately above the price.
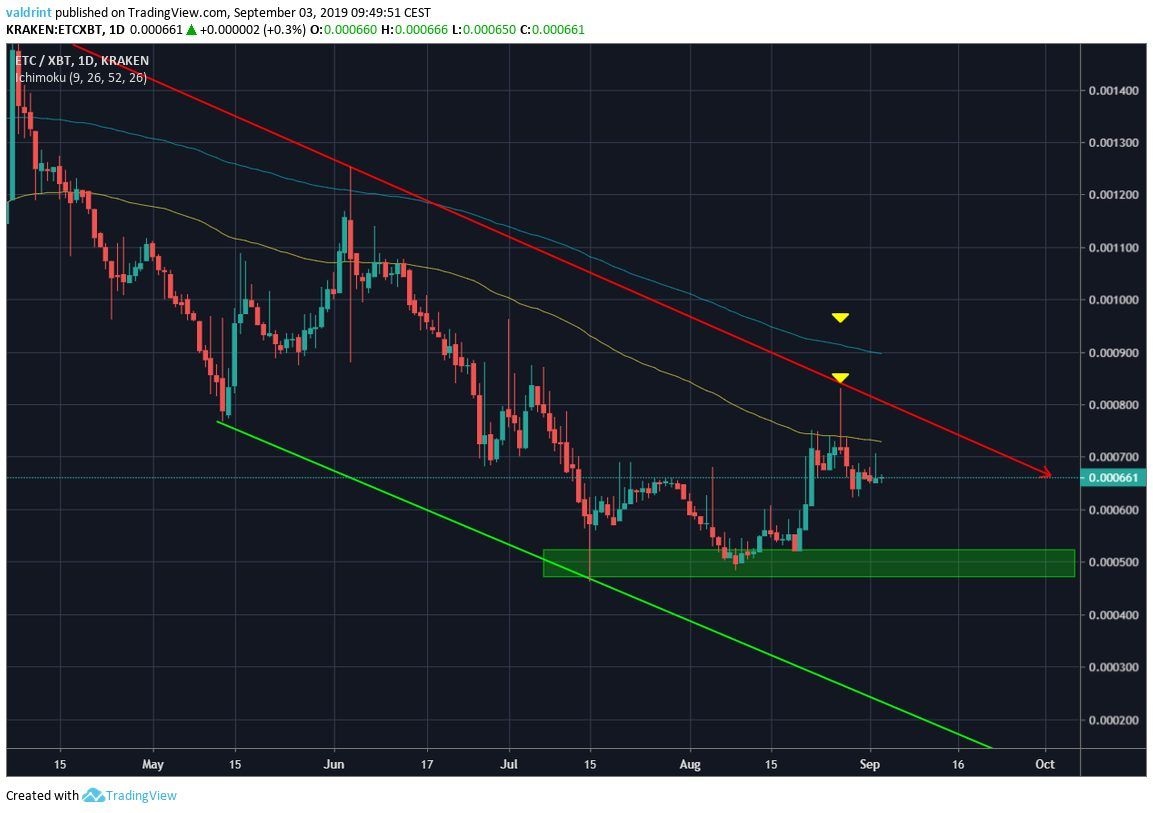
ETC is facing close resistance from the 100- and 200-day moving averages, which have previously made a bearish cross.
This makes us believe that the price will not be successful in breaking out, rather decreasing before making another attempt.
The closest support area is found at ₿0.000500.
We believe the price will eventually reach it.
Summary
The ETC price is trading at an all-time low. It is following a descending channel.
According to our analysis, it is likely to decrease towards the support line of the channel.
Before it does, it should find support at ₿0.000500.
Do you think ETC will reach the support area? Let us know in the comments below.
Disclaimer: This article is not trading advice and should not be construed as such. It is for educational purposes only and represents the typical trades the author would make himself. Always consult a trained financial professional before investing in cryptocurrencies, as the market is particularly volatile.
Images are courtesy of Shutterstock, TradingView.


