

The Ethereum Classic (ETC) price has been unable to close a higher-high since breaking down on Aug 2.
Another short-term move to the downside is expected before the price can resume its bullish trend.
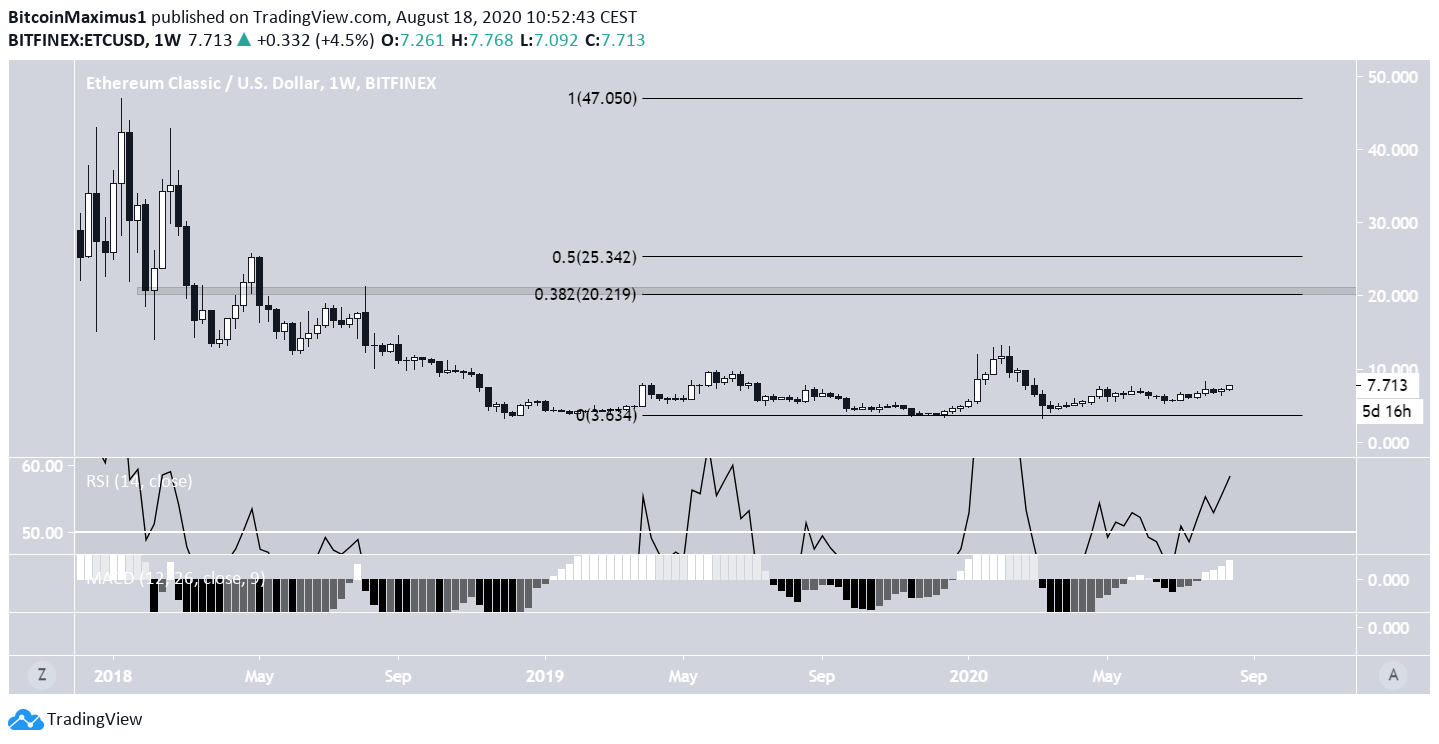
ETC Long-Term Resistance
On Aug 2, the ETC price reached a high of $8.29 but dropped sharply to a low of $6.27 during the same day. The price found support above the 50 and 200-day moving averages (MA), which had just made a bullish cross. ETC has yet to close above the $8.25 area, which is both a previous resistance area and the approximate 0.5 Fib level of the entire downward move from February and March. If the price is successful in breaking out, the next resistance area would be found near $11. Technical indicators are bullish. The RSI is increasing without any type of bearish divergence, and the MACD has made a bullish reversal, crossing into positive territory.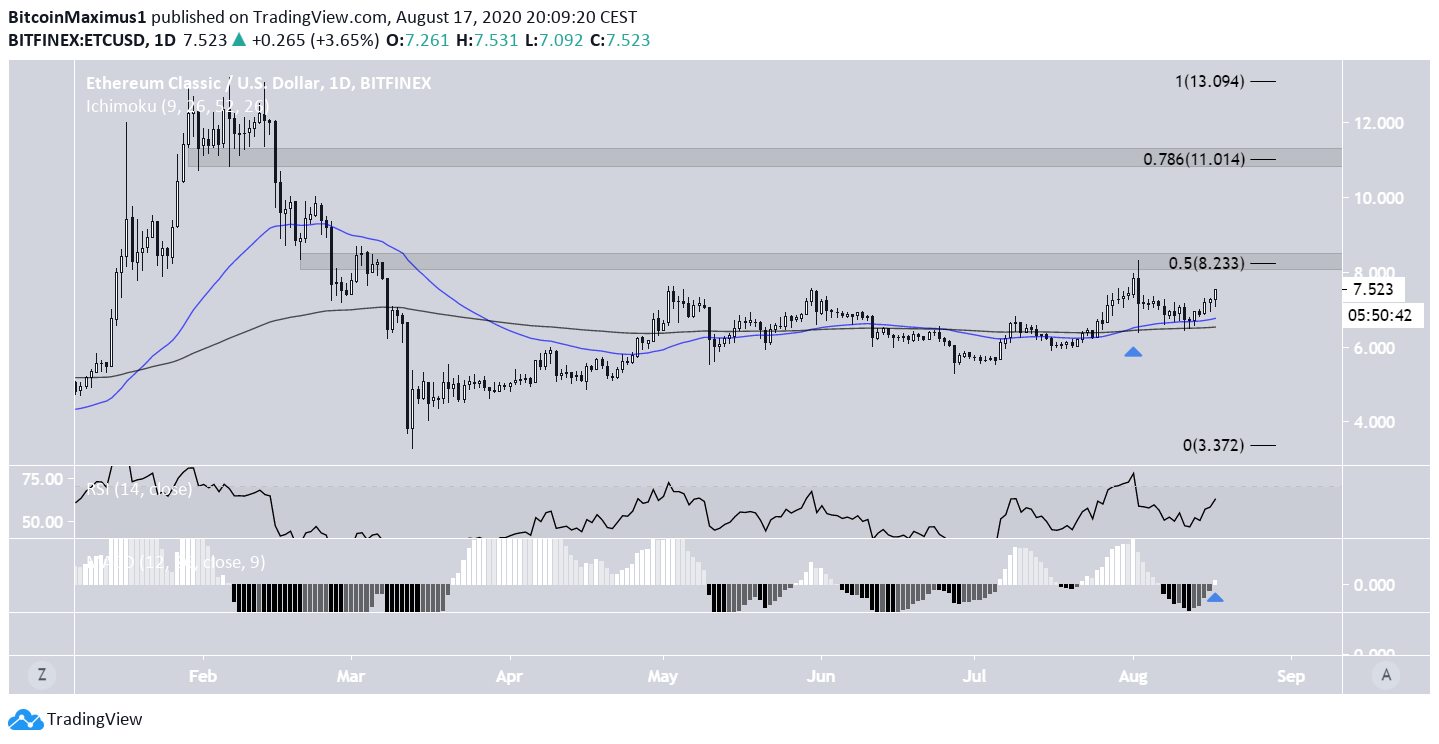
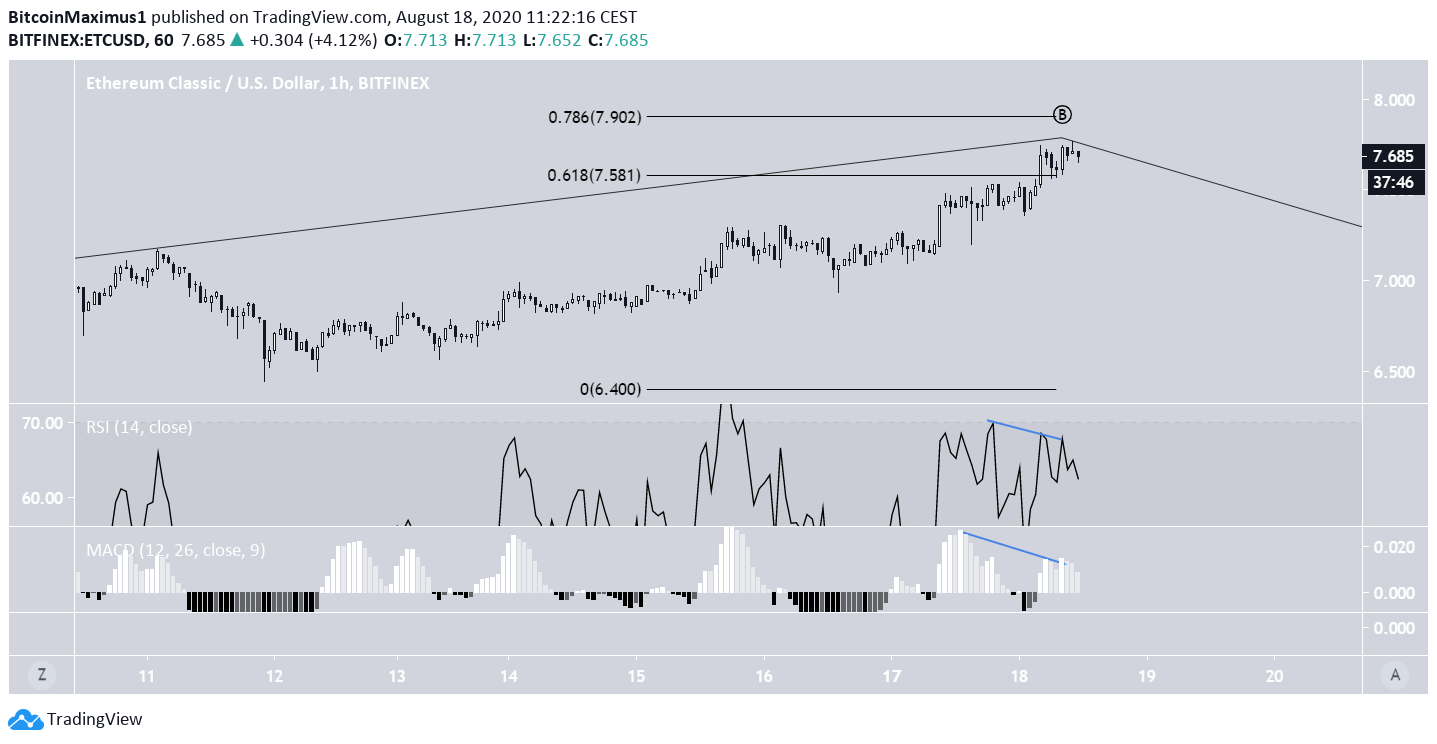
Wave Count
It is possible that beginning on June 26, the ETC price had already begun and completed a five-wave formation (black), reaching a high on Aug 2. Since then, the price has likely been correcting inside an A-B-C formation. While it is possible that the correction ended on Aug 12, the daily low fell short of the 1.382 Fib time level. Therefore, ETC may still be in the B wave, with a corrective C wave to follow shortly after. The likeliest time for the correction to end would be between Aug 24 and Sept 7 at a price of $5.90-$6.40. Considering the previous downward movements (waves 2 and 4) lasted nearly eight days, the low is likely to be closer to Aug 24 than Sept 7.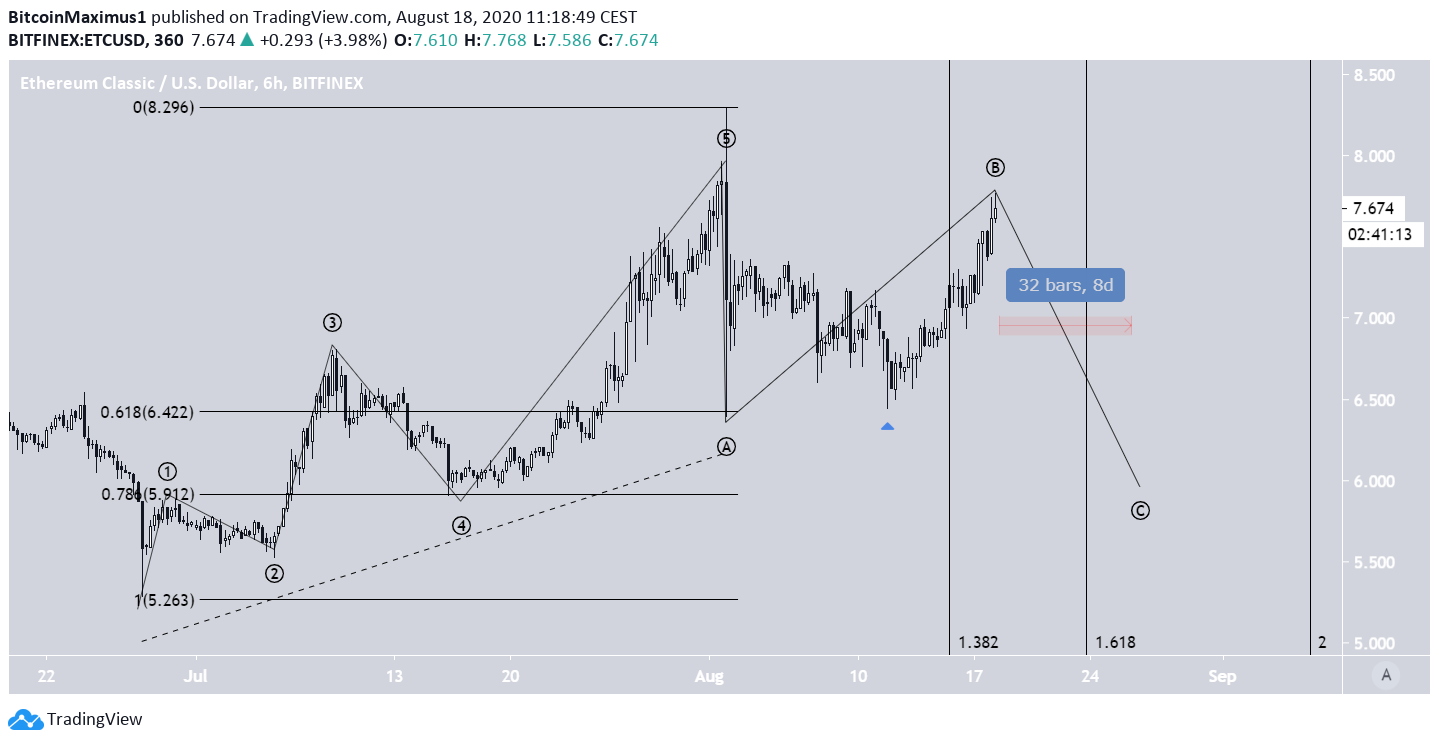
Top crypto platforms in the US
Disclaimer
In line with the Trust Project guidelines, this price analysis article is for informational purposes only and should not be considered financial or investment advice. BeInCrypto is committed to accurate, unbiased reporting, but market conditions are subject to change without notice. Always conduct your own research and consult with a professional before making any financial decisions. Please note that our Terms and Conditions, Privacy Policy, and Disclaimers have been updated.

Valdrin Tahiri
Valdrin discovered cryptocurrencies while he was getting his MSc in Financial Markets from the Barcelona School of Economics. Shortly after graduating, he began writing for several different cryptocurrency related websites as a freelancer before eventually taking on the role of BeInCrypto's Senior Analyst.
(I do not have a discord and will not contact you first there. Beware of scammers)
READ FULL BIO
Sponsored
Sponsored