


The Ethereum Classic (ETC) price has been unable to close a higher-high since breaking down on Aug 2.
Another short-term move to the downside is expected before the price can resume its bullish trend.
ETC Long-Term Resistance
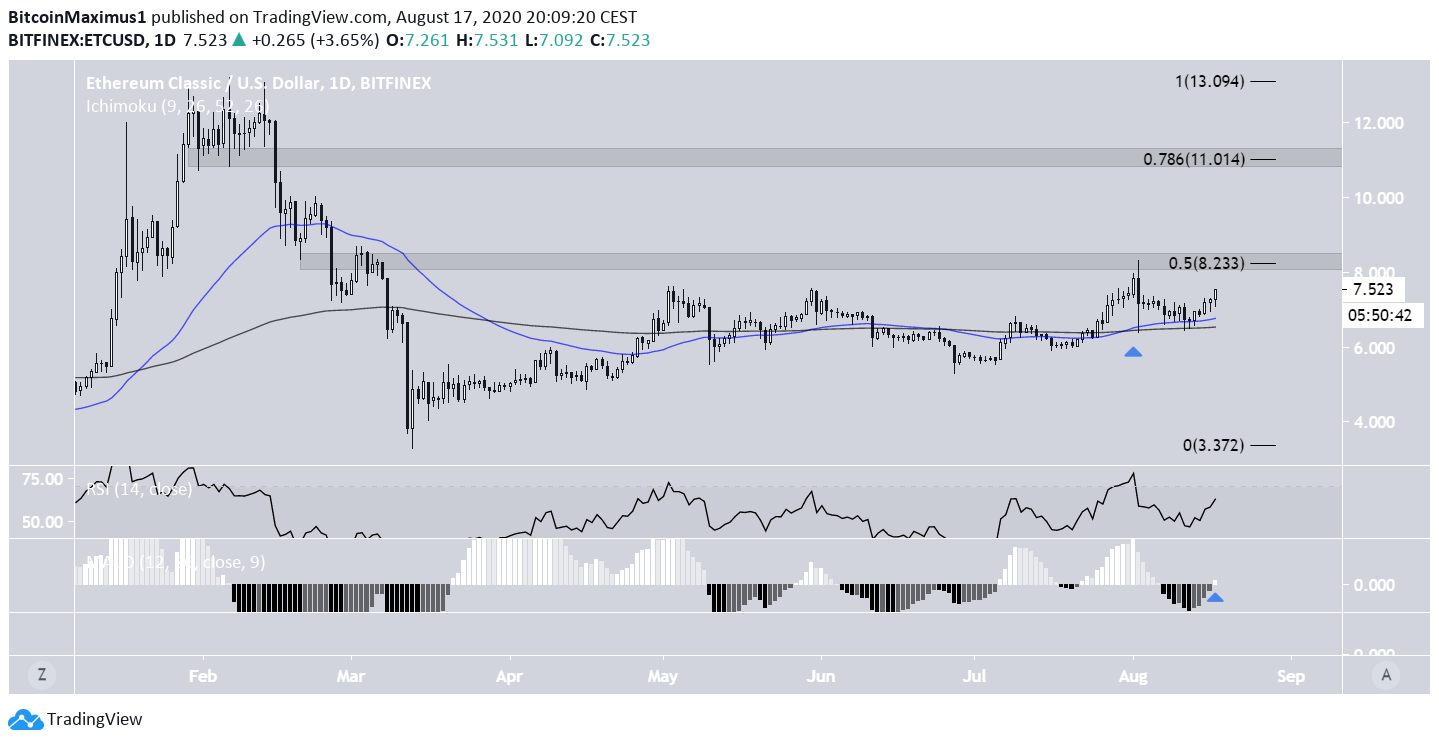
On Aug 2, the ETC price reached a high of $8.29 but dropped sharply to a low of $6.27 during the same day. The price found support above the 50 and 200-day moving averages (MA), which had just made a bullish cross.
ETC has yet to close above the $8.25 area, which is both a previous resistance area and the approximate 0.5 Fib level of the entire downward move from February and March. If the price is successful in breaking out, the next resistance area would be found near $11.
Technical indicators are bullish. The RSI is increasing without any type of bearish divergence, and the MACD has made a bullish reversal, crossing into positive territory.
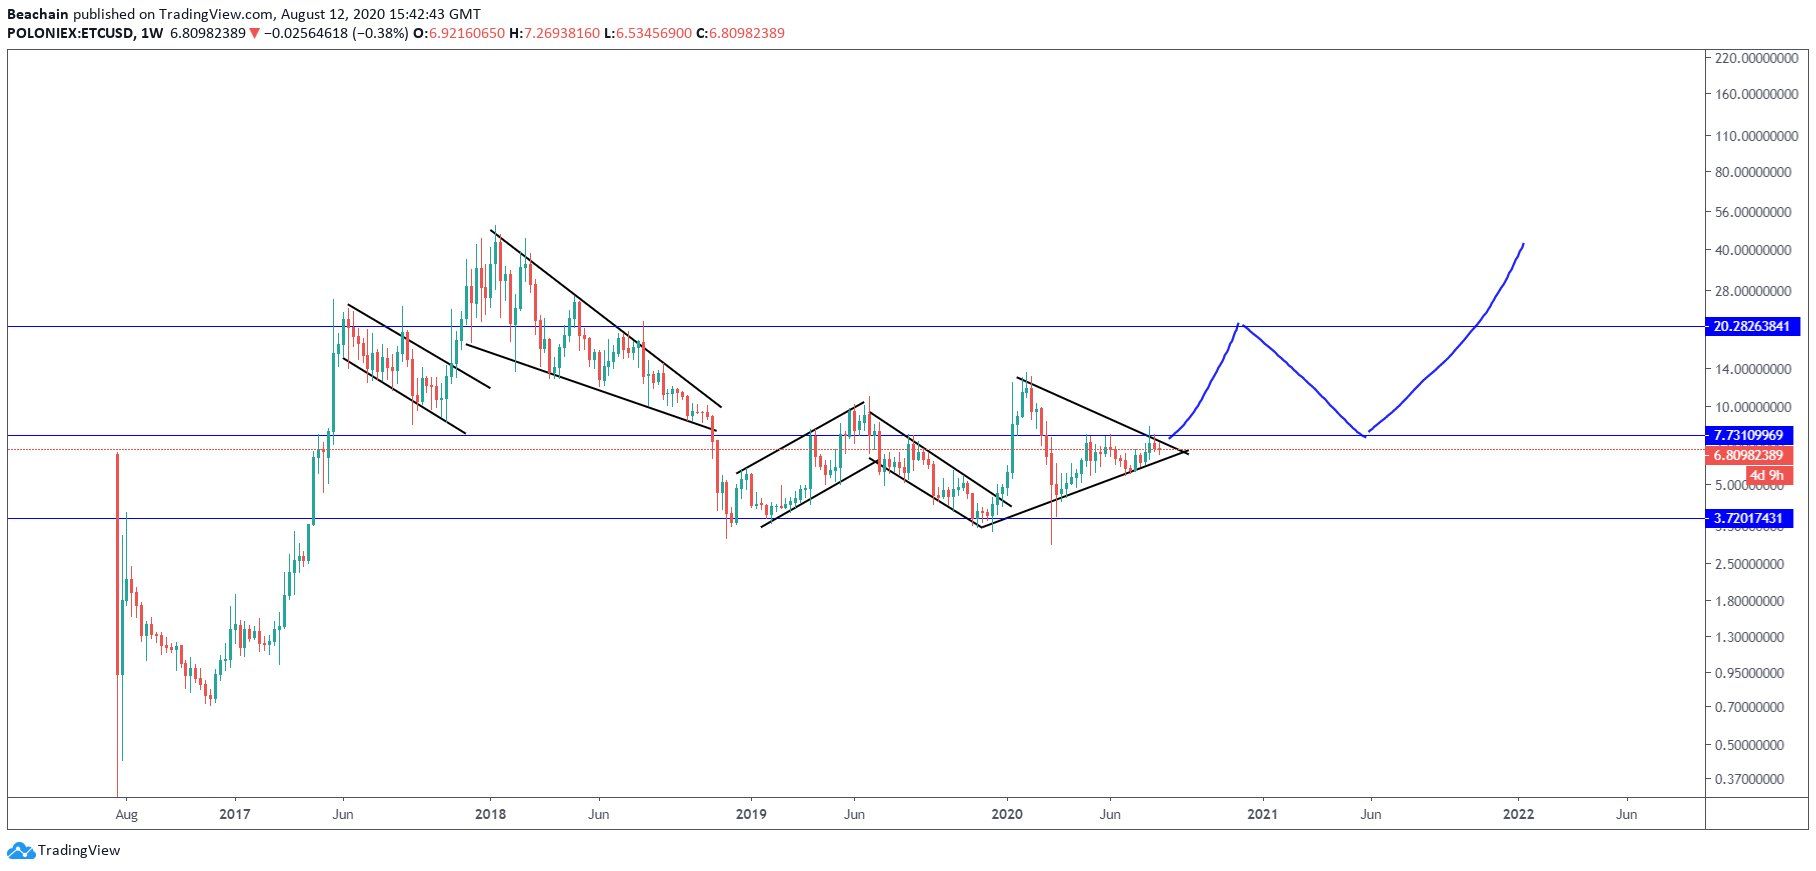
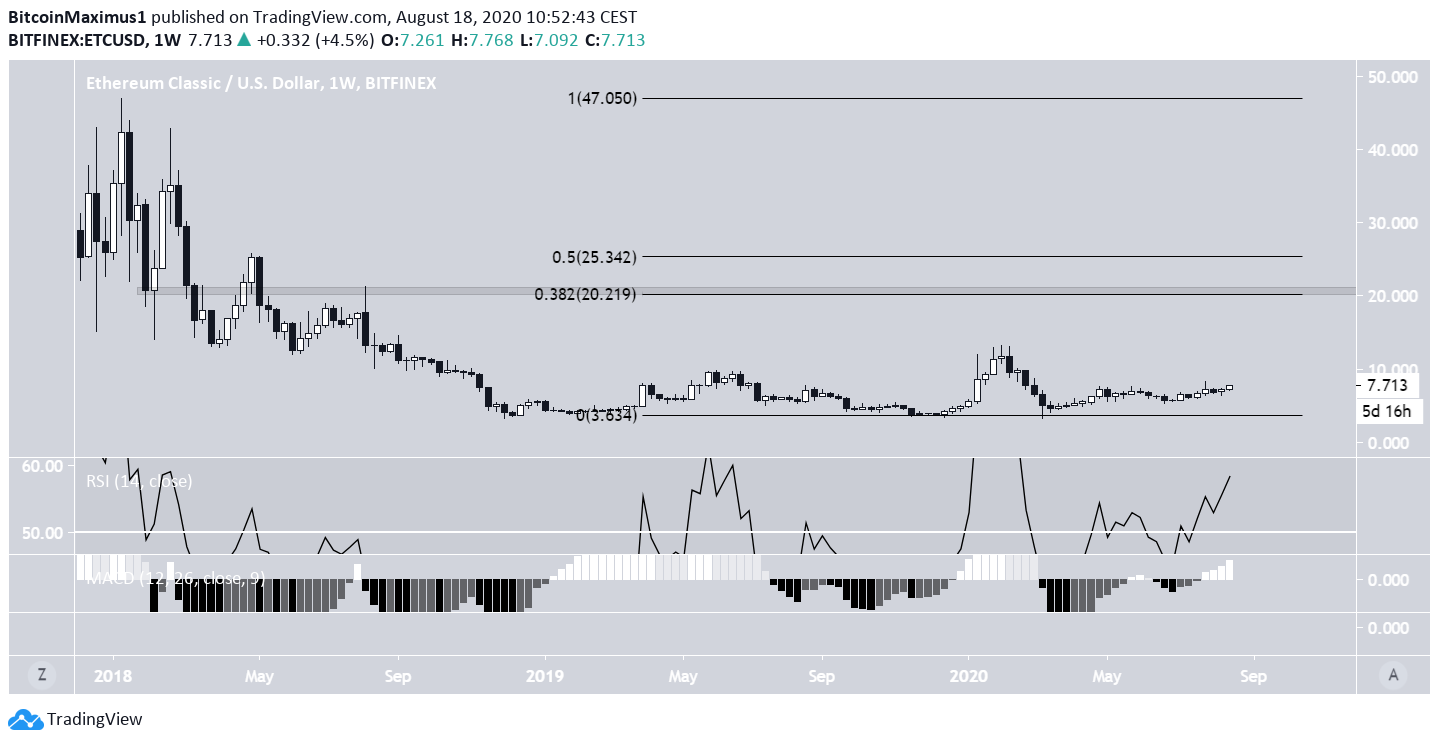
Cryptocurrency trader @beachainbtc said that ETC could go to $20, which is the 0.382 Fib level of the entire downward move beginning in January 2017 and also a previous resistance area.
Long-term technical indicators are also bullish, so it is possible that ETC could reach that target. Both the RSI and MACD have been increasing without generating any trace of bearish divergence.
If successful in breaking past $20, the next resistance area to the upside would likely be found at $25.
Wave Count
It is possible that beginning on June 26, the ETC price had already begun and completed a five-wave formation (black), reaching a high on Aug 2. Since then, the price has likely been correcting inside an A-B-C formation.
While it is possible that the correction ended on Aug 12, the daily low fell short of the 1.382 Fib time level. Therefore, ETC may still be in the B wave, with a corrective C wave to follow shortly after.
The likeliest time for the correction to end would be between Aug 24 and Sept 7 at a price of $5.90-$6.40.
Considering the previous downward movements (waves 2 and 4) lasted nearly eight days, the low is likely to be closer to Aug 24 than Sept 7.
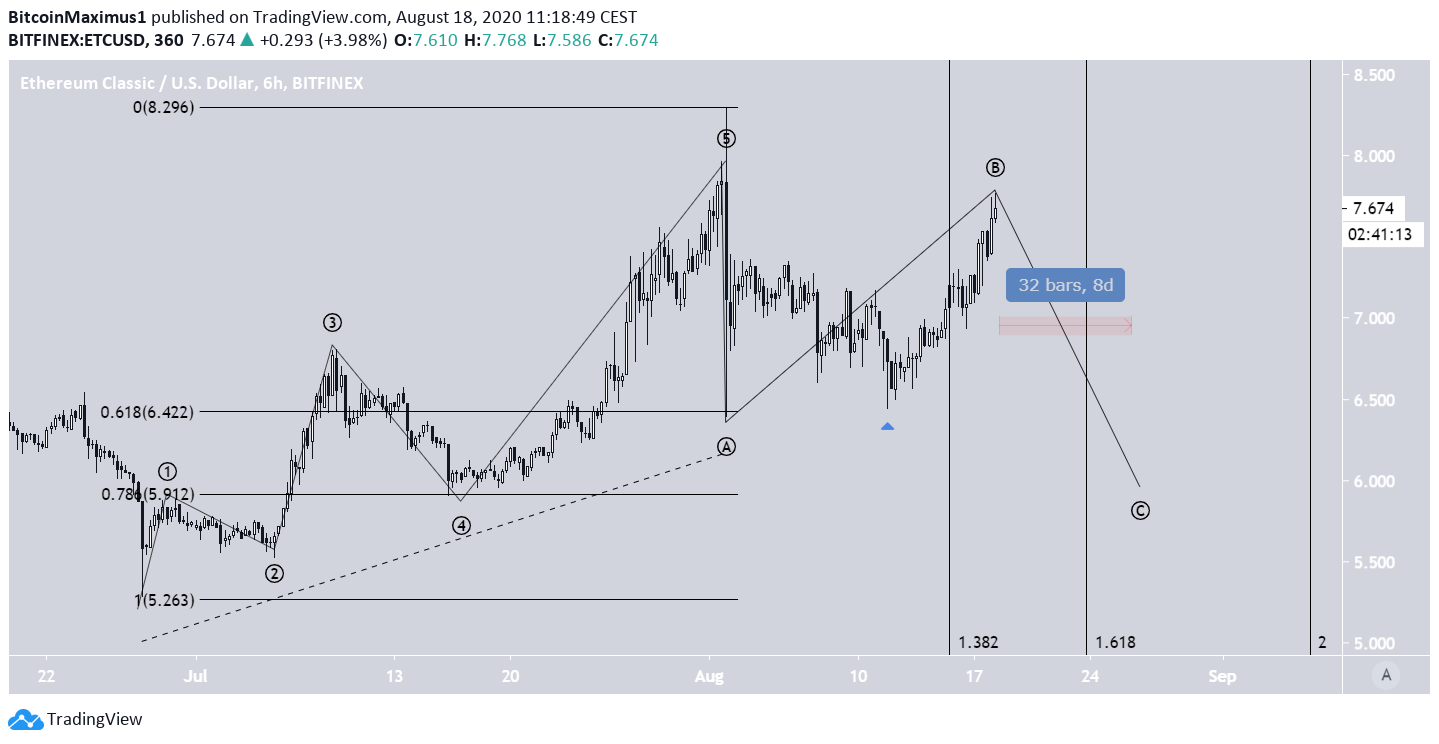
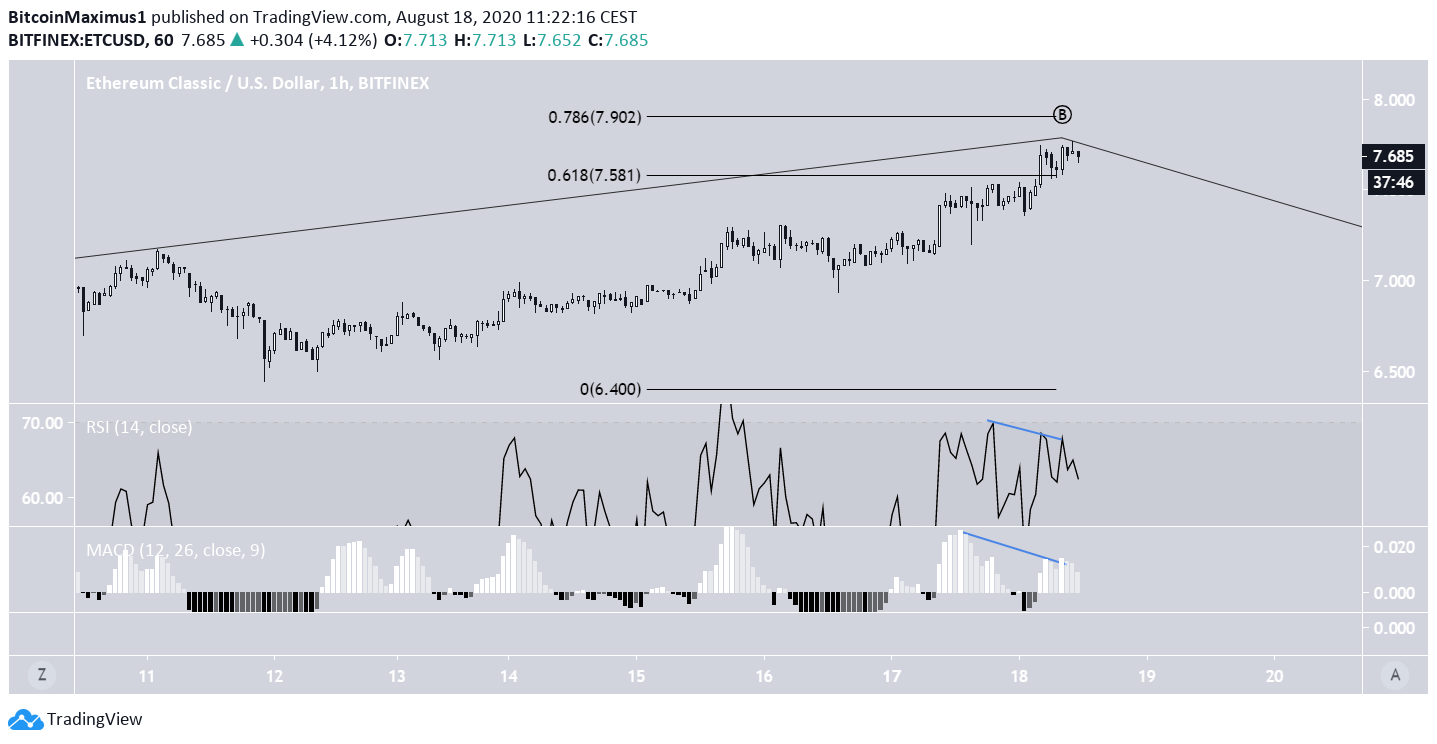
The hourly chart reveals that the price is trading between the 0.618-0.786 Fib levels of the entire downward move, beginning on Aug 2. This is a normal level for assets to reverse trends.
In addition, there is a bearish divergence in both the RSI and the MACD, a sign that the price wants to move lower.
To conclude, while the ETC price has already shown strong signs of a bullish rally, a correction is expected before it is able to resume any upward movement.


