


Ethereum Classic (ETC) is nearing the end of its corrective movement, after which a prolonged and significant upward move is expected.
Trading Range
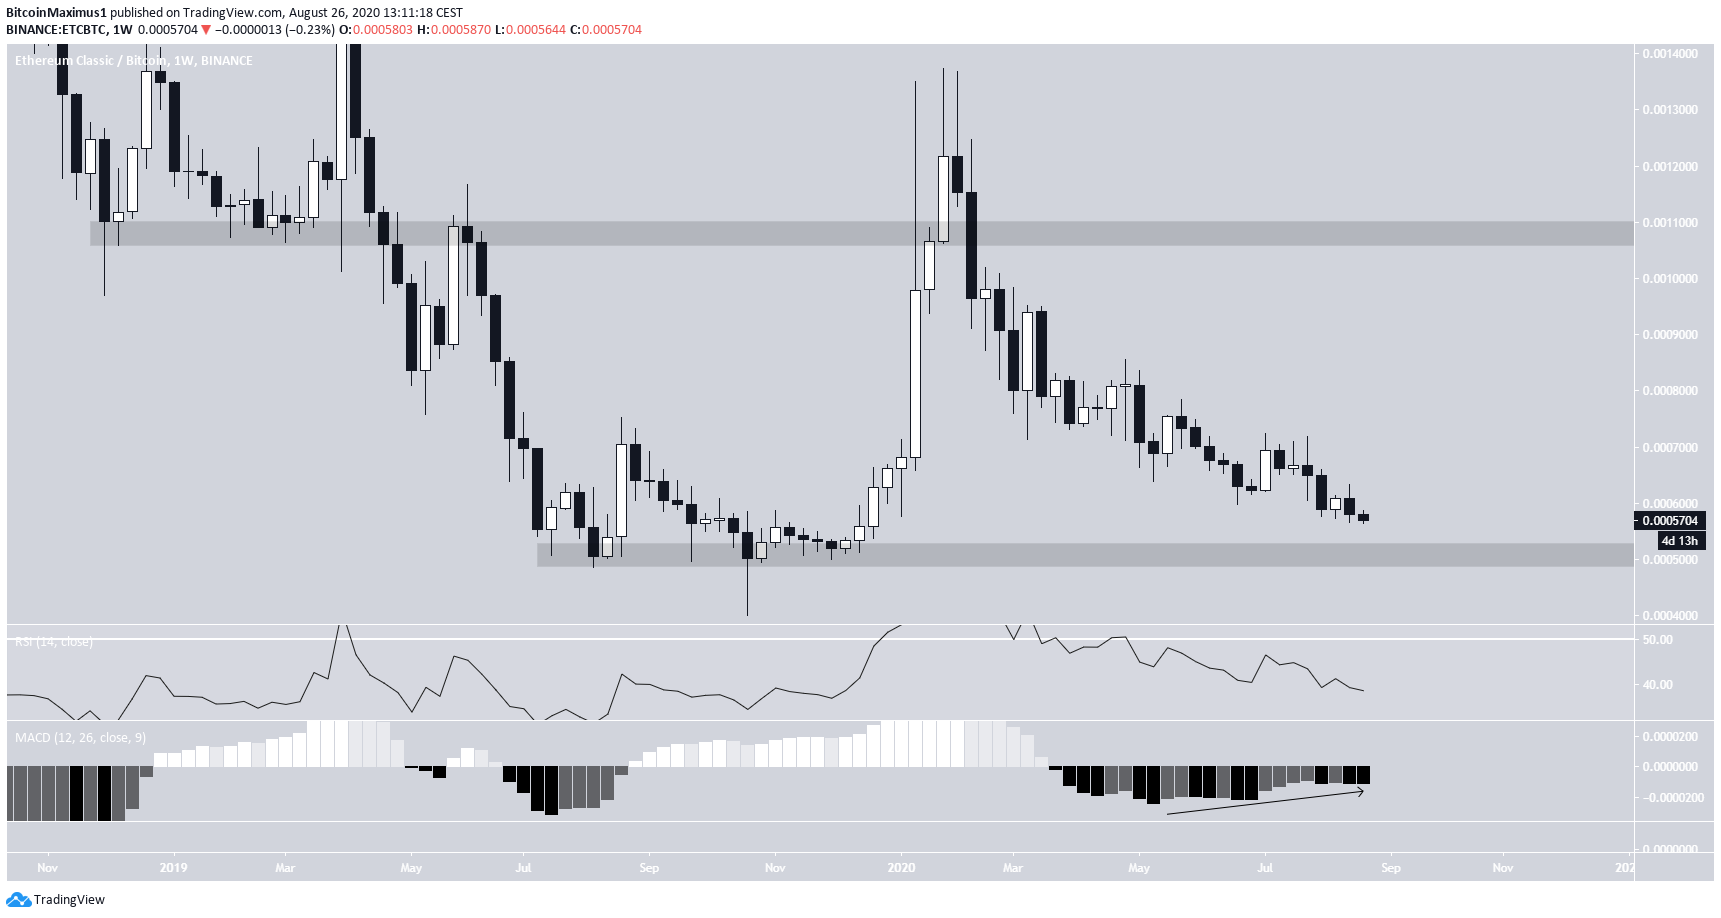
The ETC price began an upward move in September 2019, one that eventually led to a high of 137,360 satoshis on 29 January 2020. This move caused a breakout from the 110,000 satoshi area, which had previously acted as support and was expected to act as resistance afterward.
However, the higher prices could not be sustained, and ETC fell back below the range shortly afterward. The decline has continued and the price is approaching the 55,000 satoshi support area. While the RSI is falling, the MACD has been forming bullish divergence.
Therefore, after a possible re-test of this support area, a bounce is likely.
Descending Wedge Breakout
Cryptocurrency trader @Venturecoinist stated that the ETC price is trading inside a long-term descending wedge and should eventually break out.
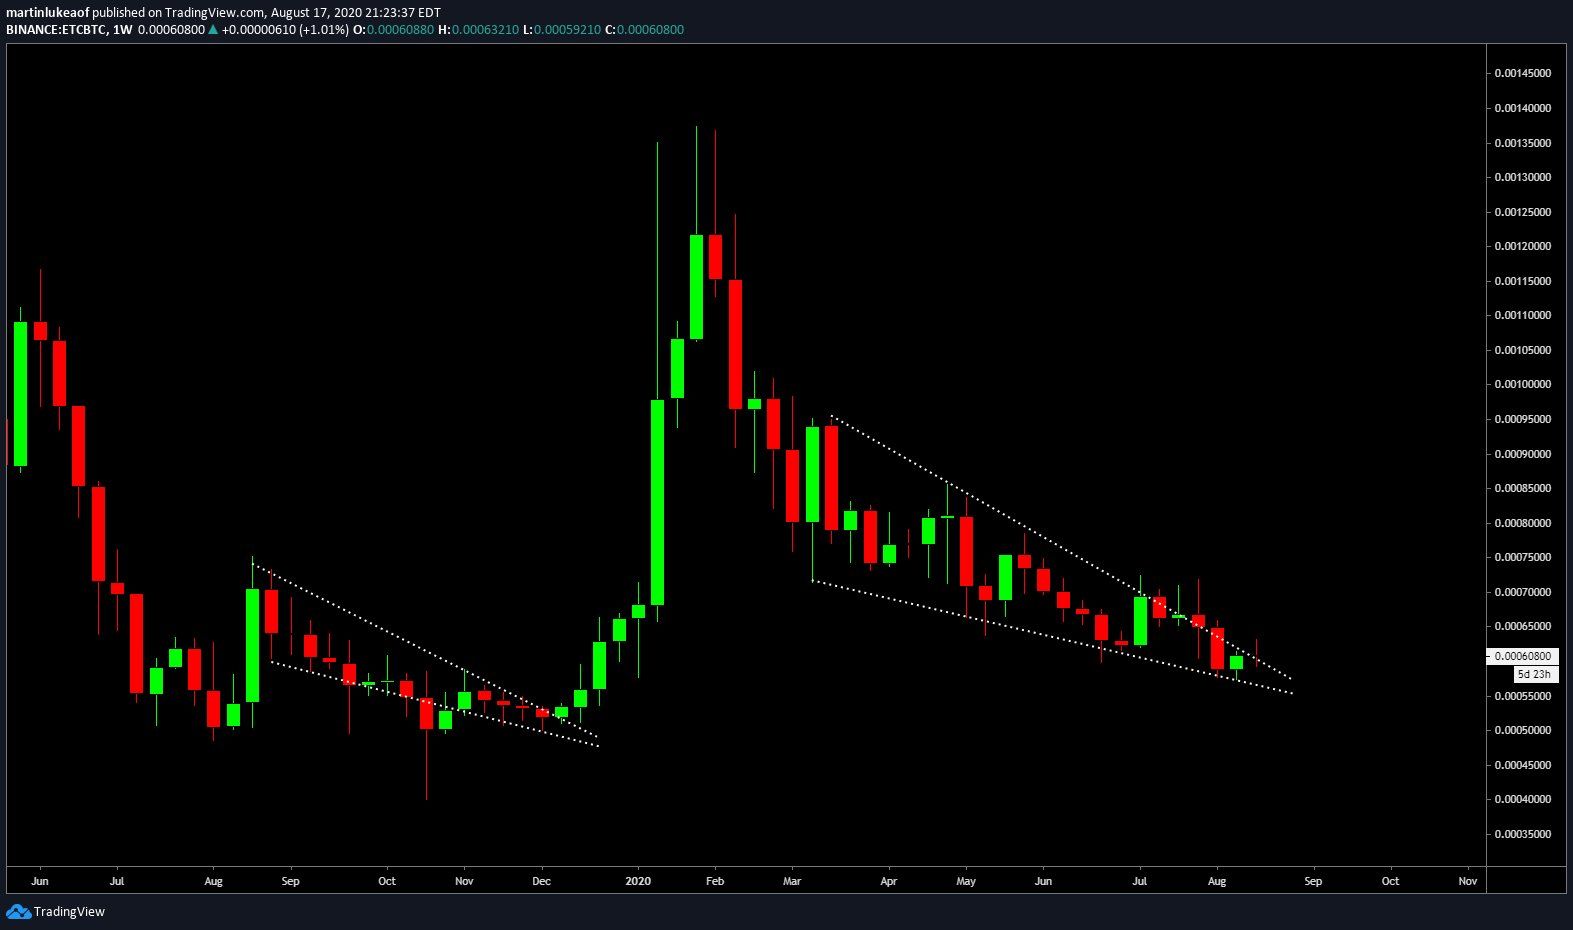
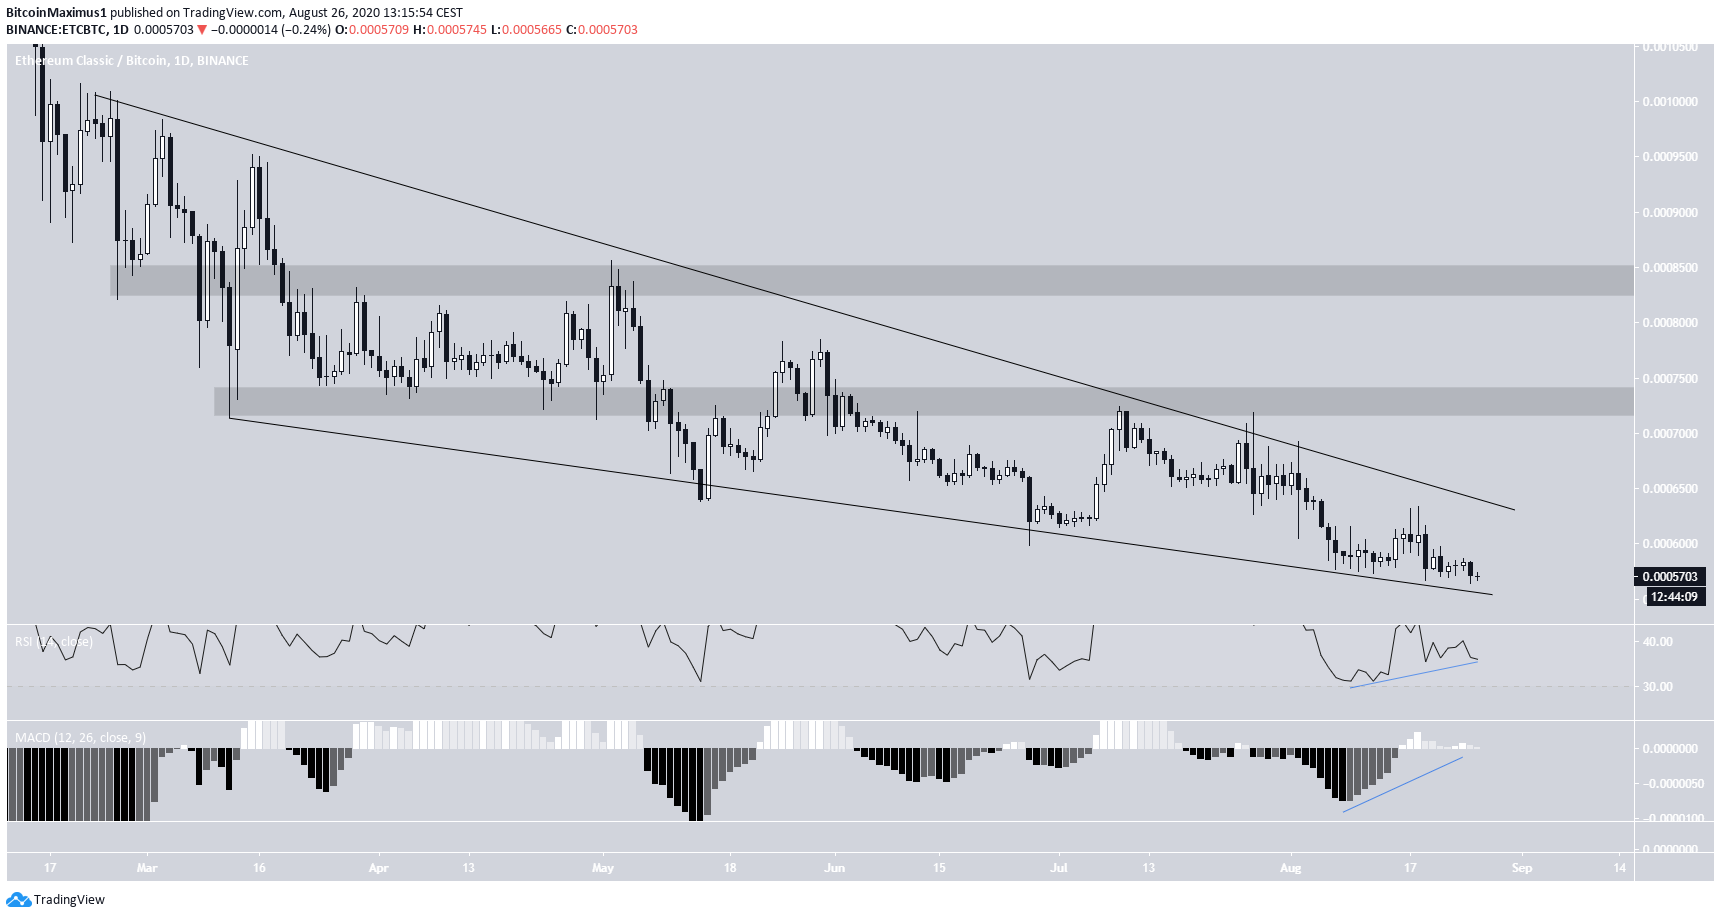
Indeed, ETC has been trading inside a descending wedge, which is a bullish reversal pattern. The price has been doing so since the beginning of March, currently trading very near the support line of the pattern.
Furthermore, there is bullish divergence on both the RSI and the MACD, a sign that the price is likely to break out and move towards the medium-term targets at 74,000 and 84,000 satoshis.
ETC Wave Count
Beginning in March, the ETC price has likely begun a five-wave impulsive formation (in black below), currently trading in the third wave. A breakout above $7.50 would confirm that the price is in an upward trend.
However, besides the fact that the price is trading above the 200-day moving average (MA), there are no other bullish reversal signs. Both the MACD and RSI are decreasing, and there is no bullish divergence present.
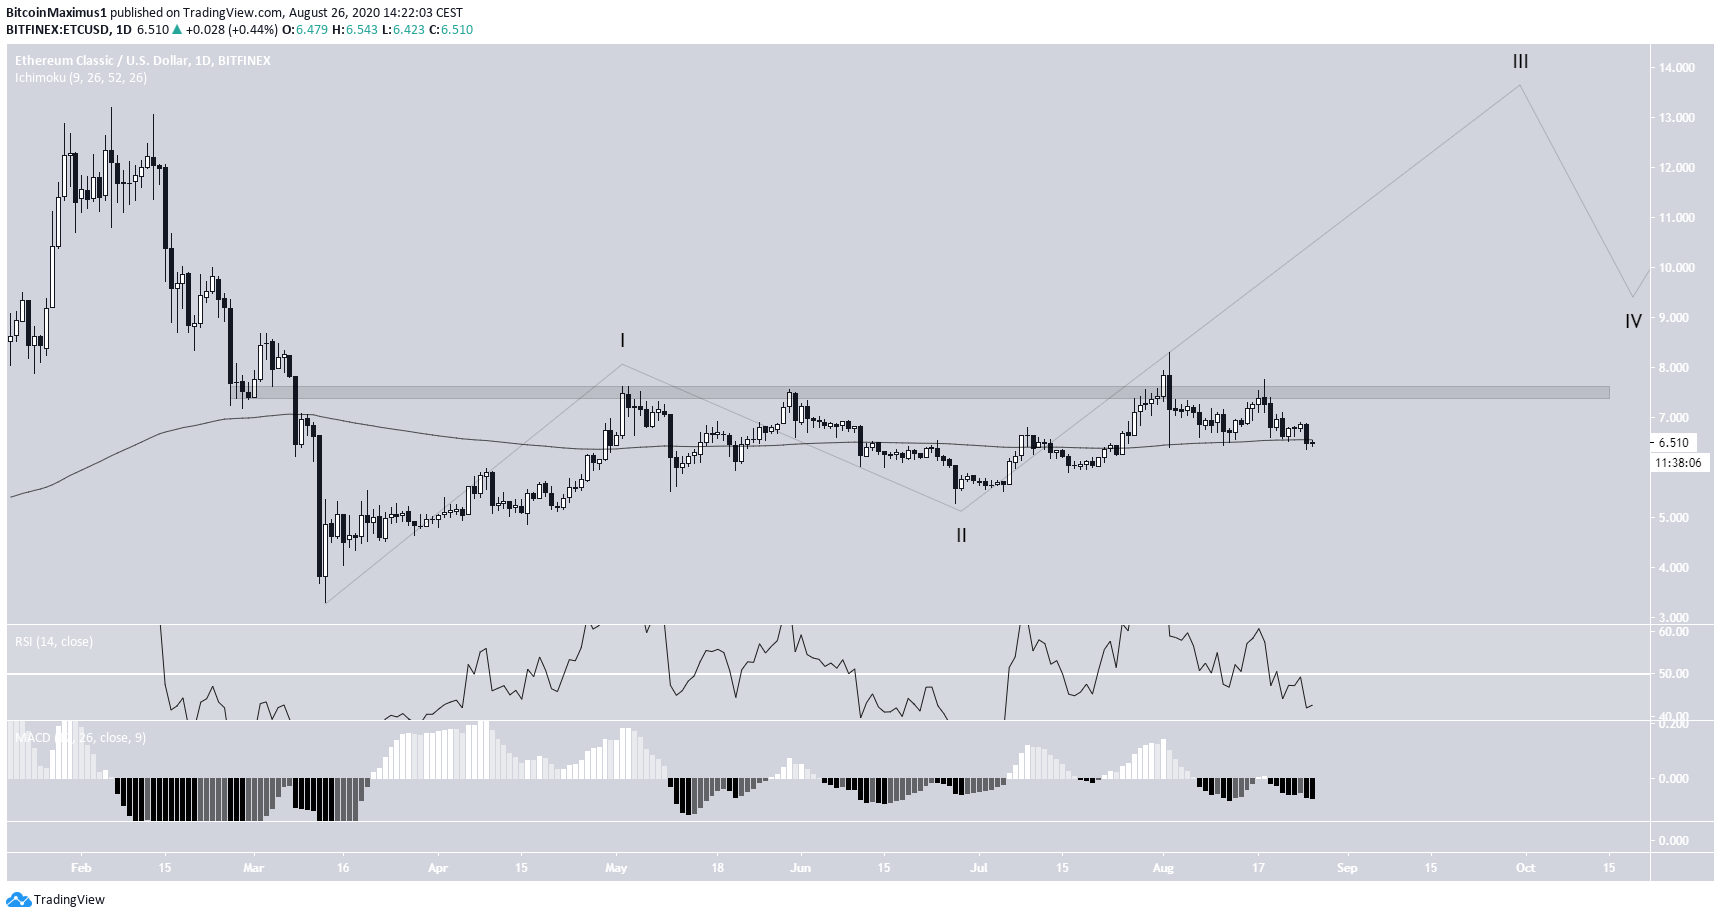
The sub-wave count (in green below) shows that the BTC price has completed the first wave and is currently in the second one, which is corrective, taking place inside an A-B-C formation (blue).
The wave should end near $5.30, the 0.786 Fib level of the entire wave 1. A decline below the beginning of wave 1 at $5.28 would invalidate the analysis.
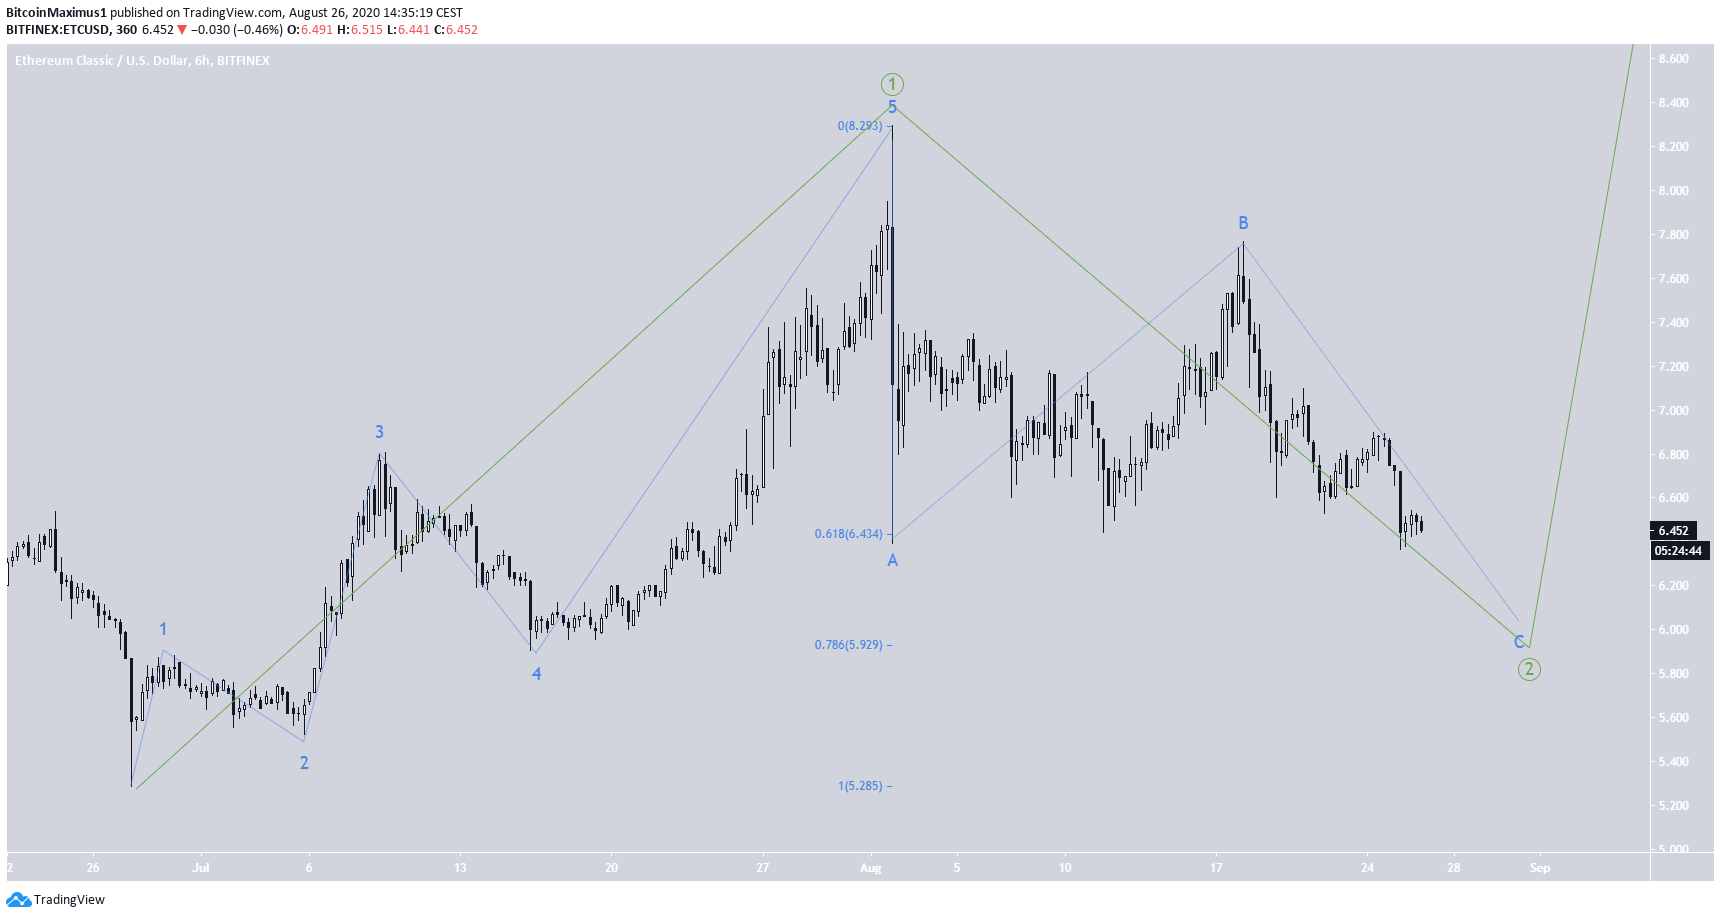
To conclude, the ETC price is likely to finish its correction in the near future and initiate a significant upward move.
