


![Ethereum Classic Could Repeat Its 2017 Bullish Cycle [Premium Analysis]](/_mfes/post/_next/image/?url=https%3A%2F%2Fassets.beincrypto.com%2Fimg%2Fl2oSZJr6Gs94PRoZzcXNPNhzptI%3D%2Fsmart%2F43d4b61c57f5425db5948d18e956fba0&w=1920&q=75)
The Ethereum Classic price has fallen to an all-time low but has shown several strong reversal signs. We believe that a new market cycle will begin in the near future.
The Ethereum Classic (ETC) price has been correcting since the beginning of August when it initiated an upward move. However, technical indicators show that this period might soon come to an end and ETC will begin a new market cycle. We suggested that this will occur back in September.
Cryptocurrency analyst and trader NICO stated that the Ethereum Classic price is trying to flip the 55,000 satoshi area as support while crossing above a significant moving average. If it does so, it should reach the next resistance areas at 64,000 and 73,000 satoshis, respectively.
Crossing over ~55k sats resistance level with UCTS trendfinder turning green(buy) on ALL low TFs & 1D/2D charts
Crossing above EMA50, Volume is not what I was expecting but if R/S flip happens on this level retest we may aim for a new leg up (~64k / ~73k)#ETC pic.twitter.com/yeaZtvht4i
— Nico (@CryptoNTez) December 21, 2019
Let’s take a closer look at the ETC price and determine where it is heading.
Ethereum Classic’s Triple Bottom
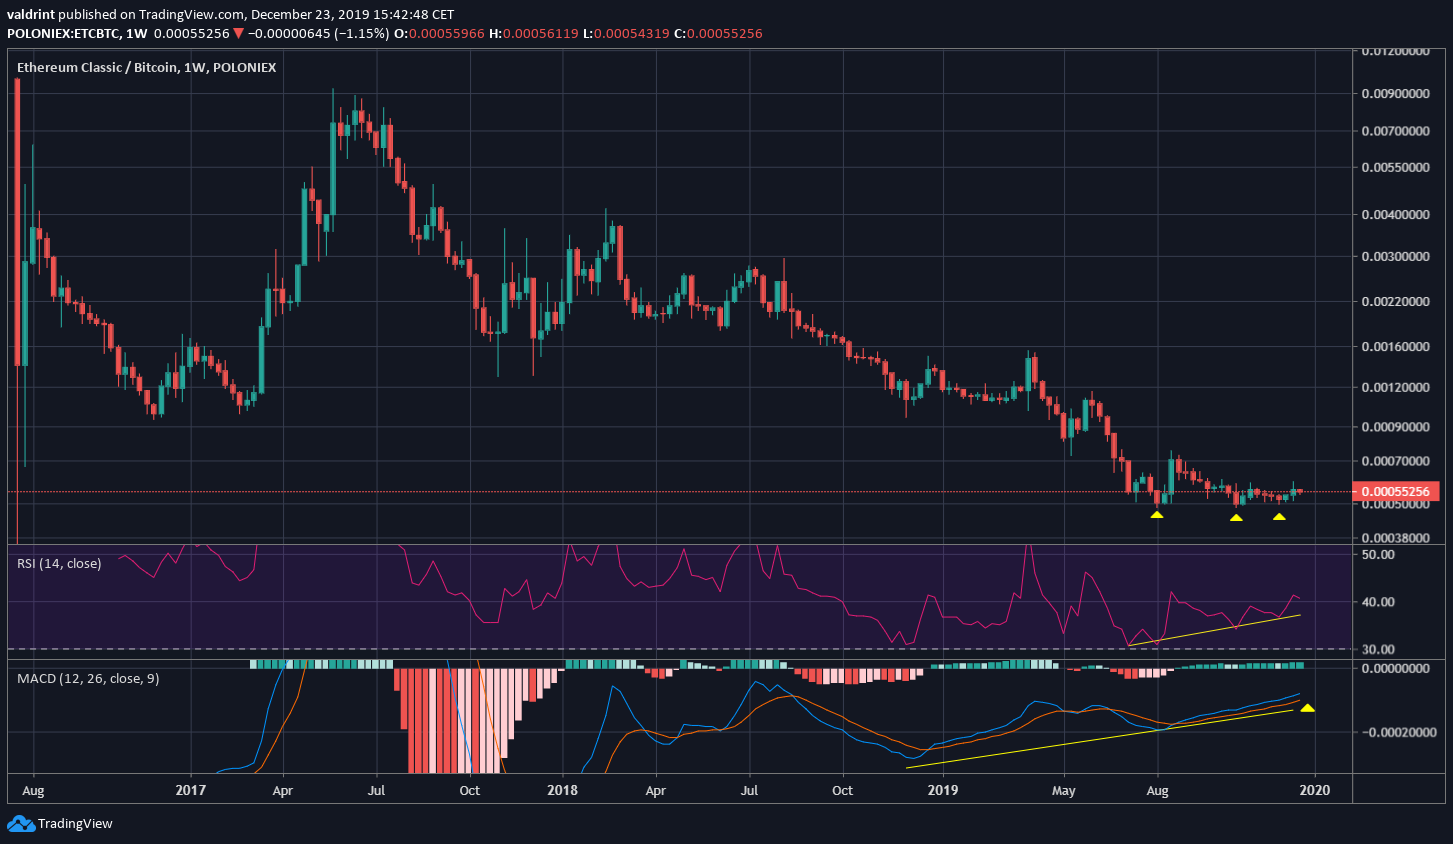
Discounting the long lower wicks of the price opening, the ETC price has been trading at an all-time low since August. It has made a triple bottom at 50,000 satoshis, which is considered a bullish pattern.
Furthermore, this is combined with a very strong bullish divergence in both the weekly RSI & MACD. Divergences in such high time-frames lead to a reversal the majority of the time. Furthermore, the MACD line has almost crossed above 0 — a movement that has not transpired since 2017. If that were to occur, it would act as confirmation that ETC has begun a new upward trend.
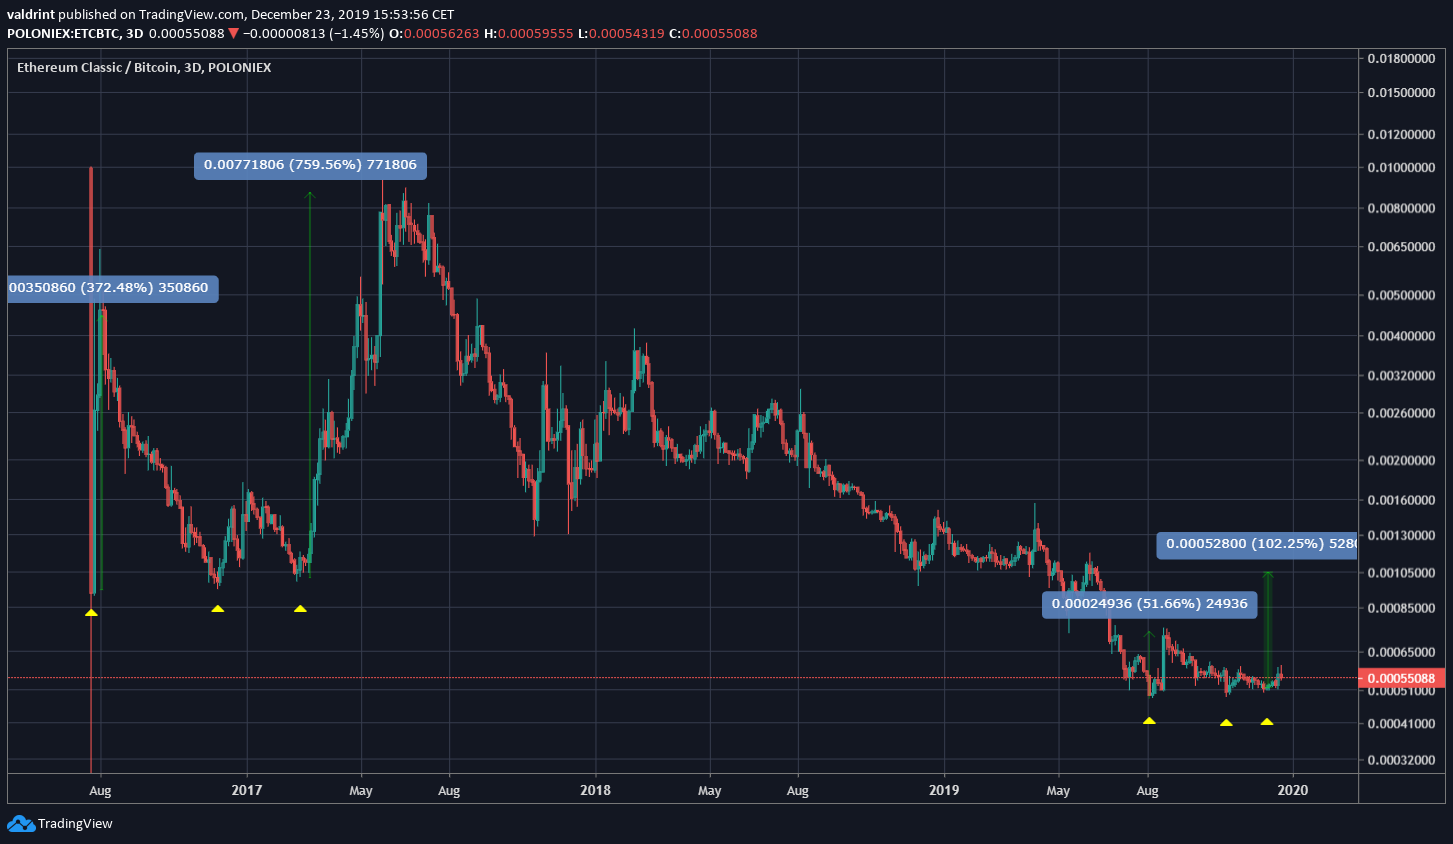
A similar triple bottom was created in 2016, preceding the 2017 upward move with a magnitude of 750 percent. (The main difference being the much larger first move before the 2nd and 3rd bottom.)
If we preserve the same ratio between the movement after the first bottom and that after the third one to the current time, we arrive at a price of 105,000 satoshis as a target for the ensuing move.
Future Movement
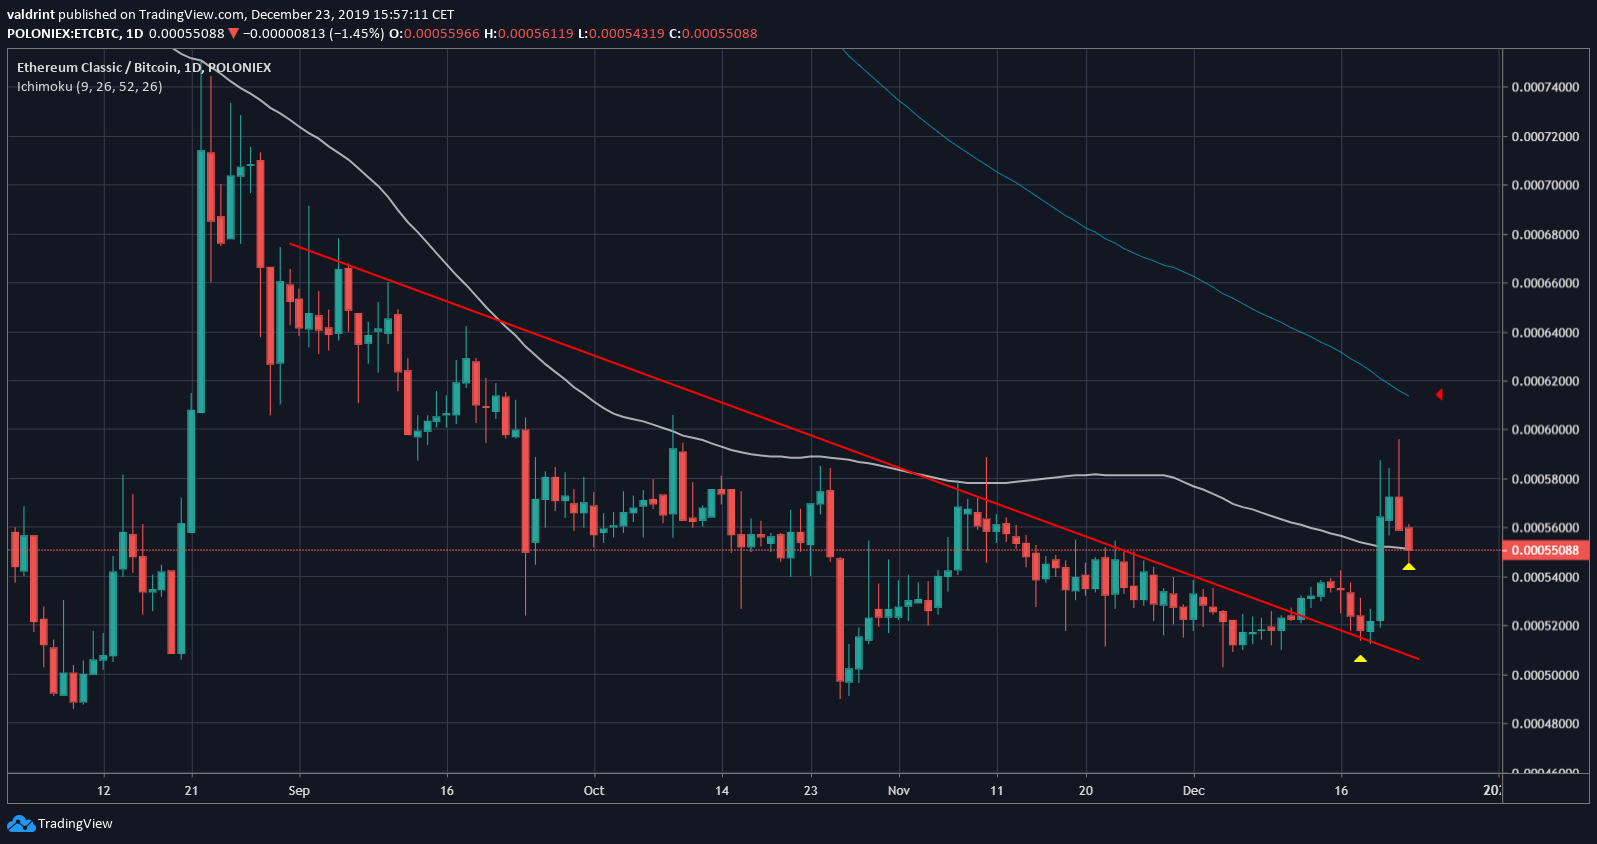
In the short term, ETC broke out from a descending resistance line in place since September and validated it as support afterward.
Additionally, it is trying to hold on to the 100-day moving average (MA) as support. It is still trading below the 200-day MA, which is likely to offer resistance.
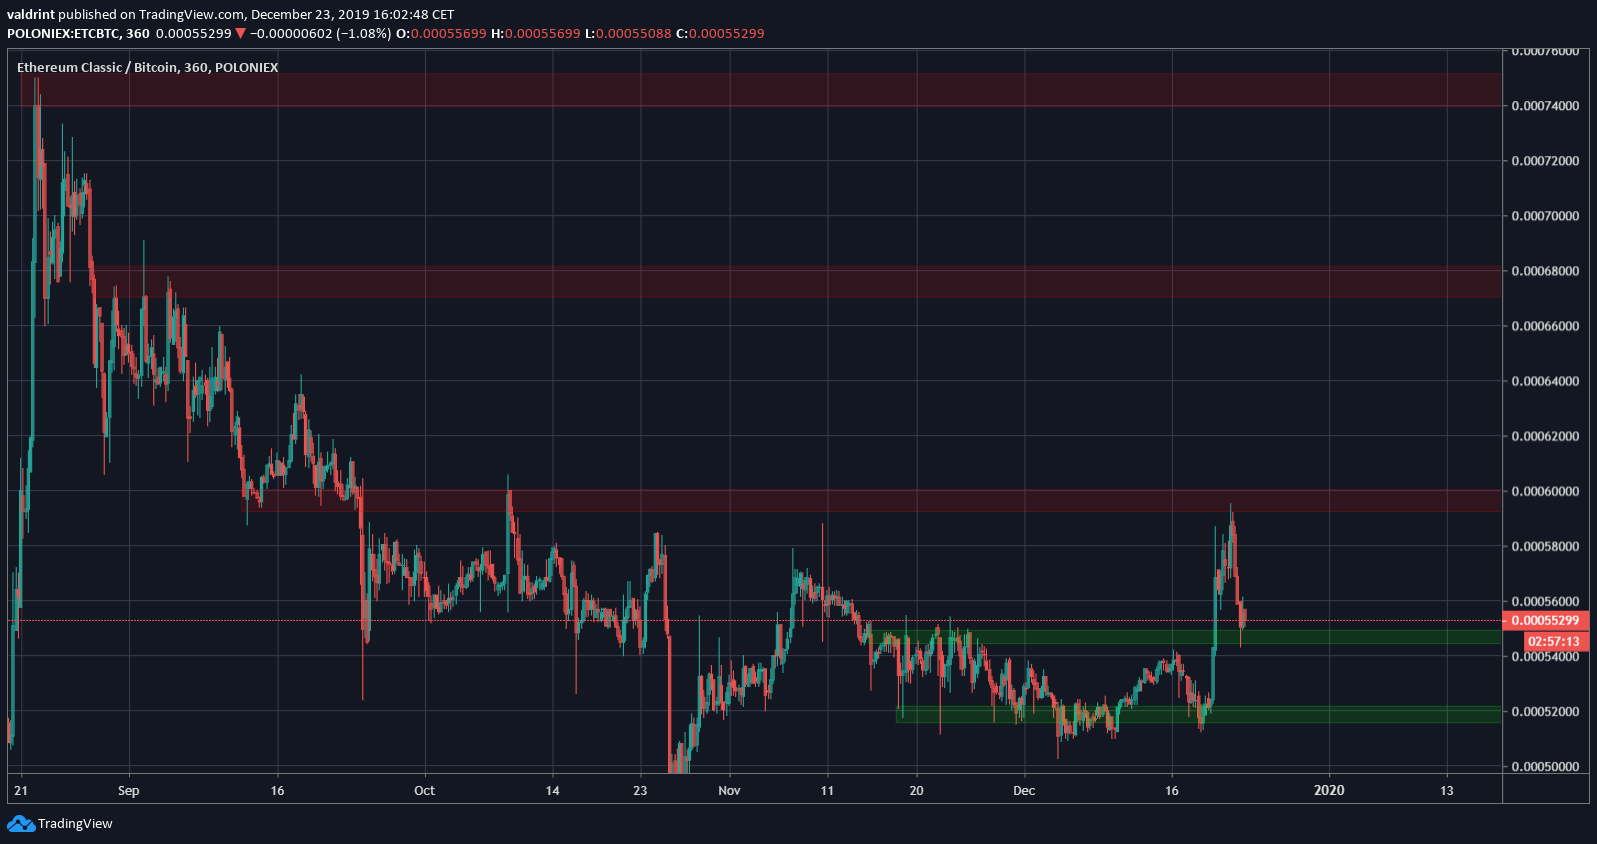
Currently, the ETC price is trying to hold on to the 55,000 satoshis support area. If it is successful, it will likely break out above the 60,000 satoshi resistance and head towards 68,000 and 75,000 satoshis.
If not, we will likely see a revisit of the 52,000 satoshi lows. This will not invalidate the hypothesis that the price will begin a new market cycle, but will likely delay its initiation.
To conclude, we believe that ETC will soon begin another upward cycle. If the price holds on to the 55,000 satoshi support area, the move will transpire soon. If not, we might first see a revising of the 52,000 satoshi lows.
