After correcting for the entirety of 2020 alongside a descending resistance line, the Ethereum Classic (ETC) price is in the process of breaking out from this line.
However, a new bullish trend has not yet been confirmed.
ETC/BTC Temporarily Breaks Out
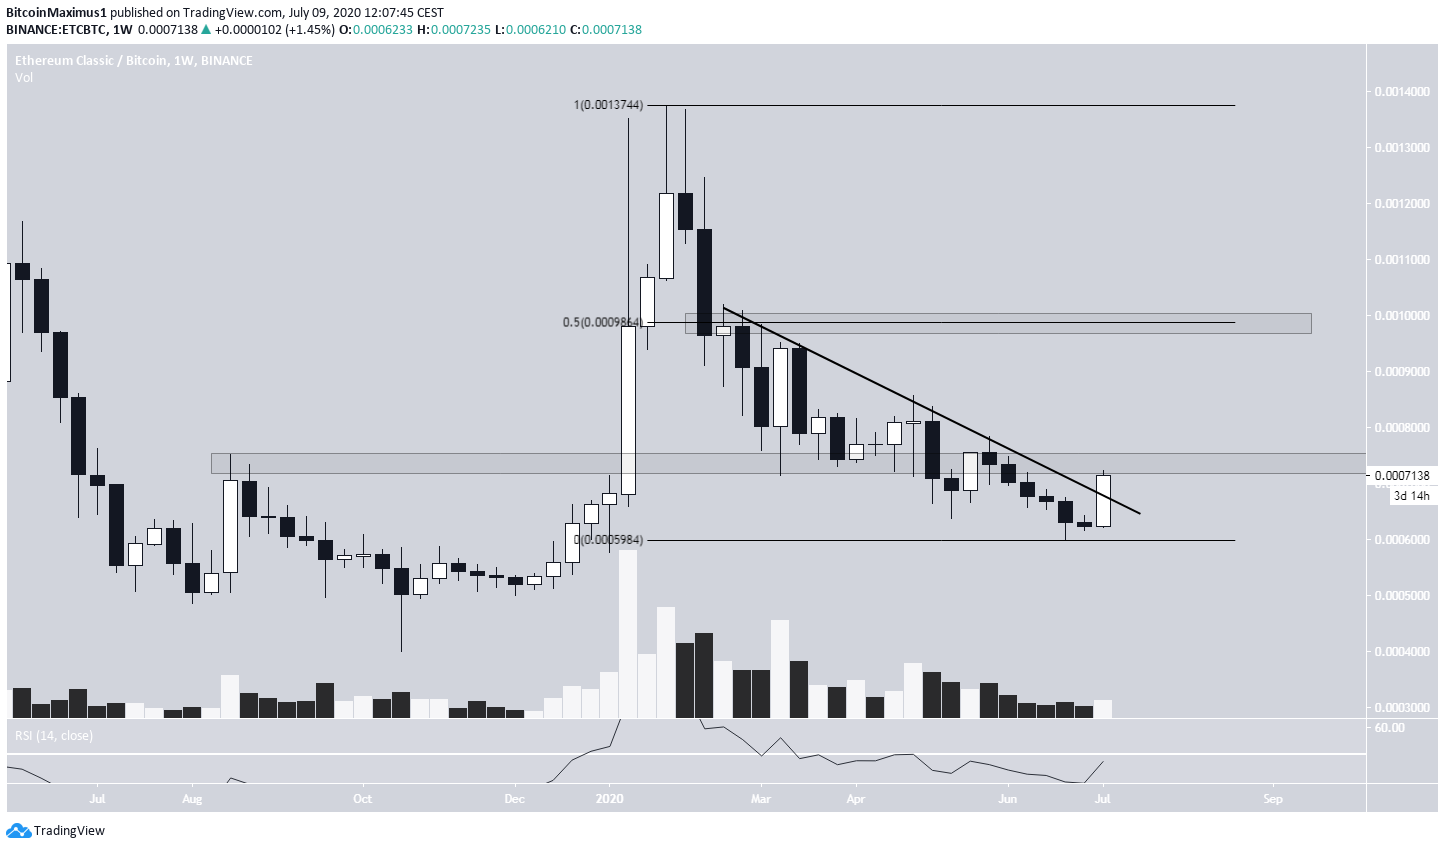
The ETC price had been following a descending resistance line since the end of February. Currently, the price is in the process of breaking out above this level.
However, it faces very strong resistance at 75,000 satoshis, an area that has previously acted as both resistance and support. Also, the RSI is approaching the 50-line from below, so the trend is still undecided.
If successful in breaking out, ETC could increase all the way to 98,000 satoshis, which is both the closest resistance area and the 0.5 Fib level of the entire decrease.
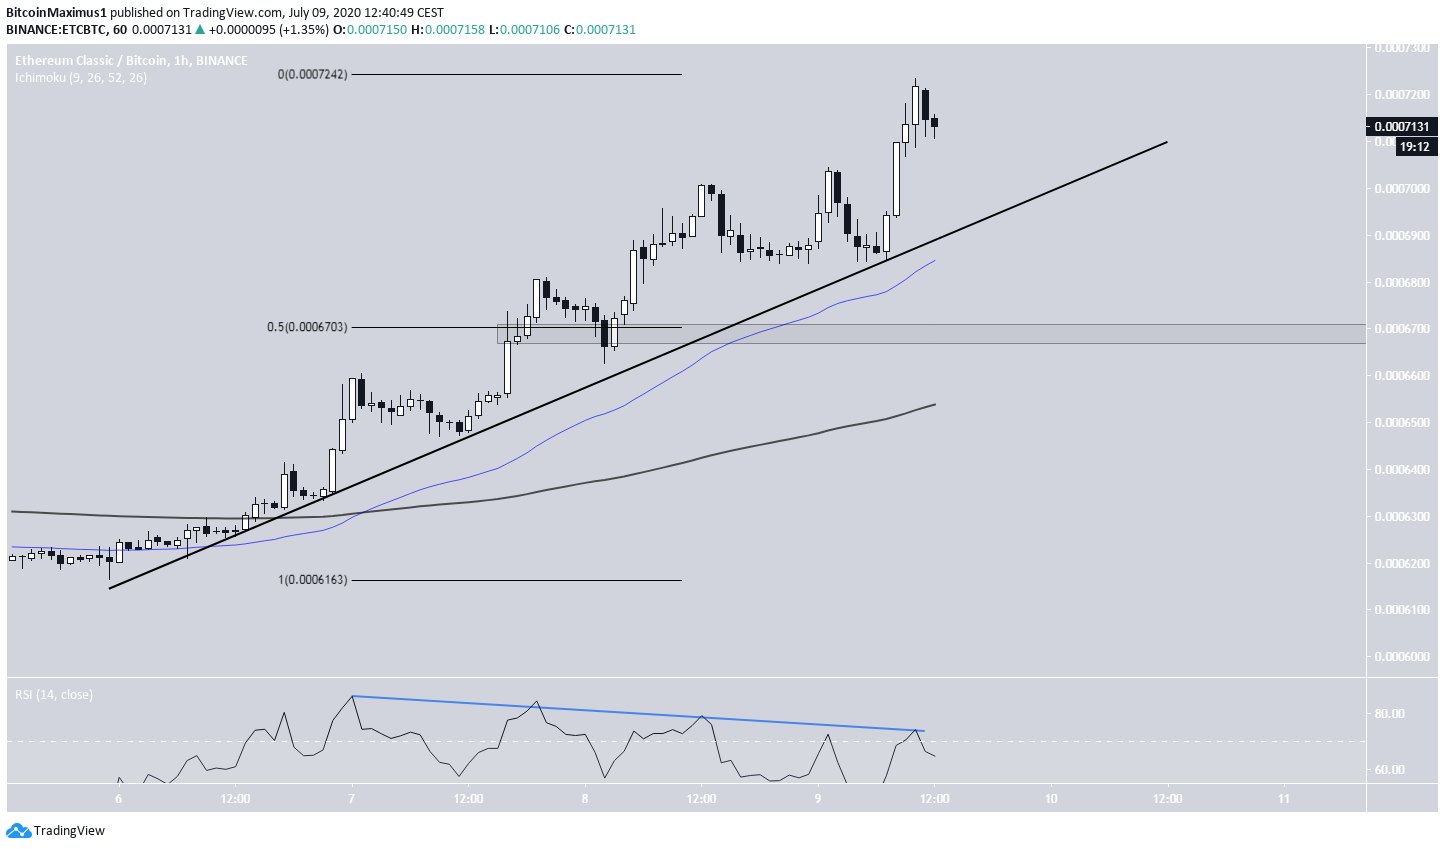
The short-term chart shows that ETC is following an ascending support line, and has been doing so since the upward move began on July 6. The support line has a relatively steep slope, likely unsustainable in the long-run. In addition, there is a considerable bearish divergence developing in the RSI.
However, the price is still trading above both the 50 and 200-day moving averages (MA), the former of which is offering close support to the price.
As long as the ascending support line stays intact, the ETC price is expected to continue moving upwards.
A breakdown would take the price towards 67,000 satoshis, both the 0.5 Fib level of the current increase and the 200-hour MA.
ETC/USD
As for the USD pair, cryptocurrency trader @Devchart stated that he has entered an ETC position, and is expecting the price to increase for at least 15% more to reach the $7.50 level.
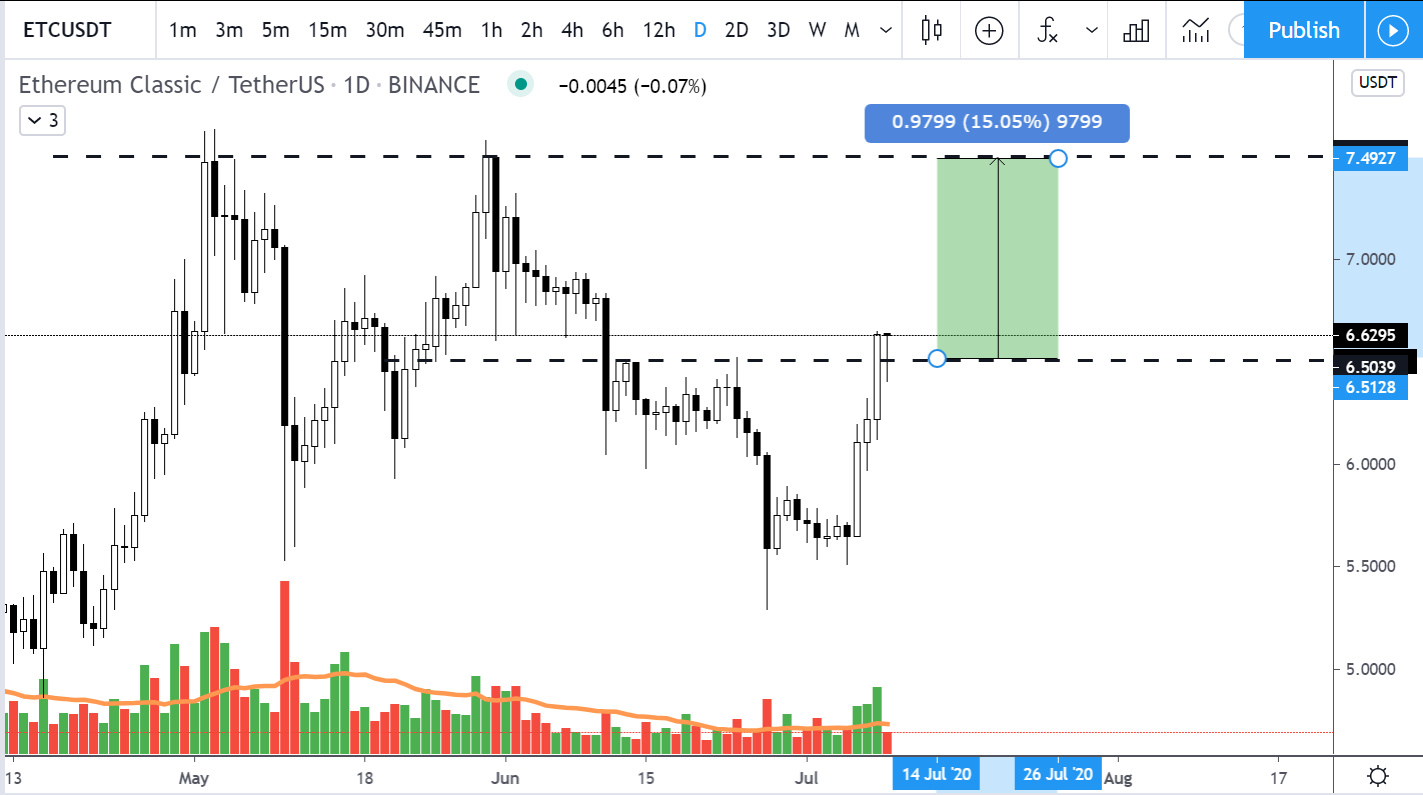
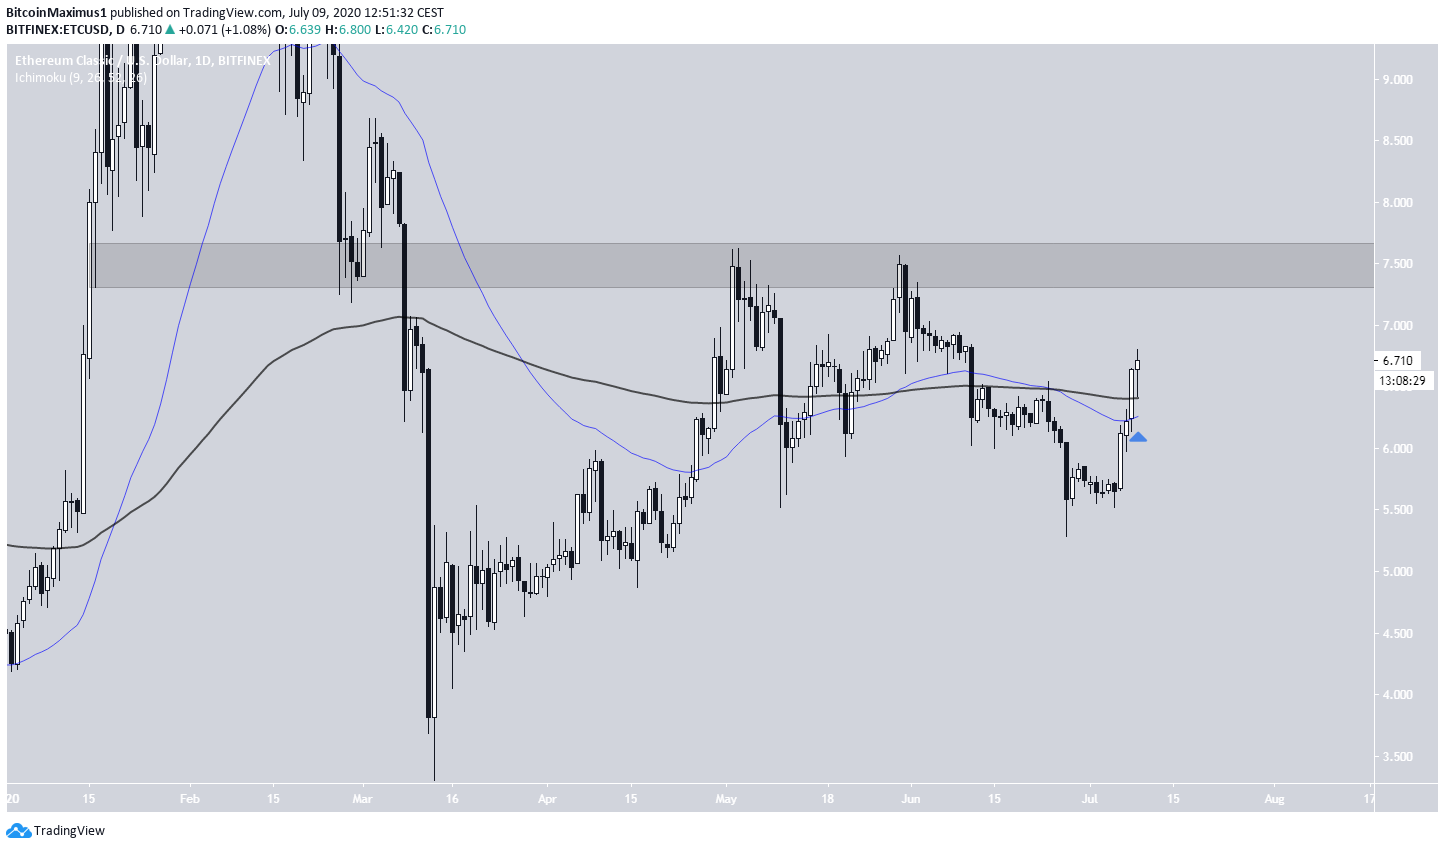
Indeed, the closest resistance area for ETC/USD is found at $7.50. This area acted as support until March, before turning to resistance and twice rejecting the price in May and June.
A golden cross has transpired on the daily time-frame, and the price is trading above both MAs. This indicates that the price is likely to reach the aforementioned resistance area, hitting the target outlined in the tweet.
However, at the current time, we cannot accurately determine if the price will break out above here.