
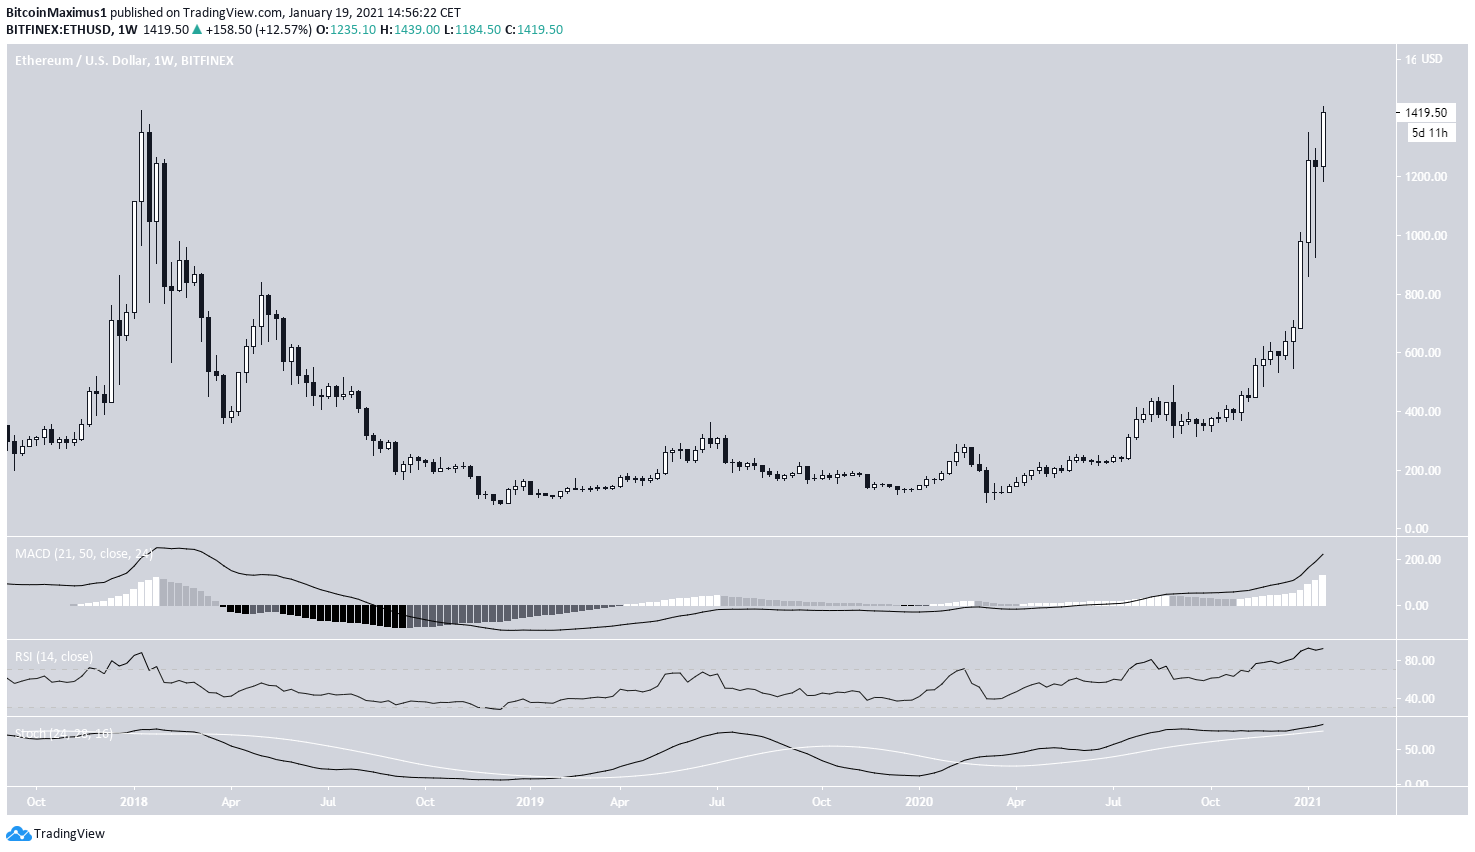
On Jan. 19, Ethereum (ETH) reached a price of $1,439, breaking the previous all-time high of $1,424 from January 2018.
While the price action and technical indicators are still bullish, Ethereum is likely to reach a high between $1,500-$1,660 to complete a bullish impulse that began in March 2020.
Ethereum All-Time High
Ethereum has been increasing since a local low of $86 was reached in March.
The upward movement accelerated at the end of December when ETH was trading near $600. In the span of less than one month, ETH more than doubled in value.
It’s currently trading at $1,419 after reaching an all-time high of $1,439 on Jan. 19, 2021, as noted by cryptocurrency trader @TradingTank
Despite the almost parabolic rate of increase, technical indicators do not yet show significant weakness, suggesting that the trend is still bullish.
ETH Wave Count
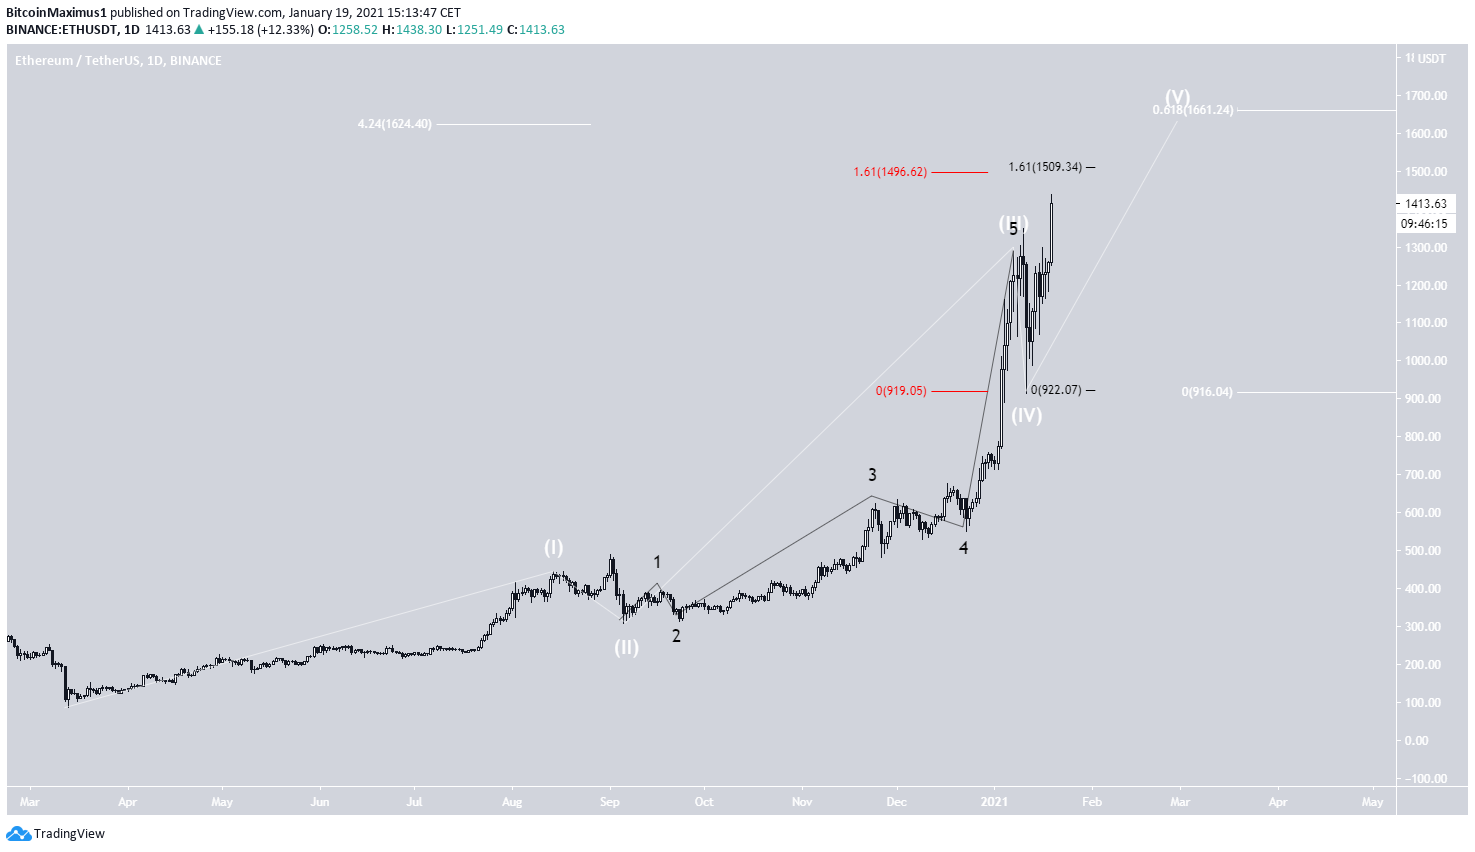
The wave count suggests that ETH is in wave 5 (shown in white) of a bullish impulse that began in March 2020, in which the third wave extended. The sub-wave count is shown in black.
The most likely target for the top of the bullish impulse is found between $1,500-$1,650.
The target range was found by using a combination of Fib extensions, projections, and external retracements.
More specifically:
- 1.61 length of wave 1 projected to the bottom of wave 4 (Red)
- 1.61 external retracement of wave 4 (black).
- 0.618 projection of waves 1-3 to the bottom of wave 4 (white on the right)
- 4.27 extension of wave 1 (white on the left)
After reaching this range, ETH is expected to correct the entire upward movement from its March lows.
ETH/BTC
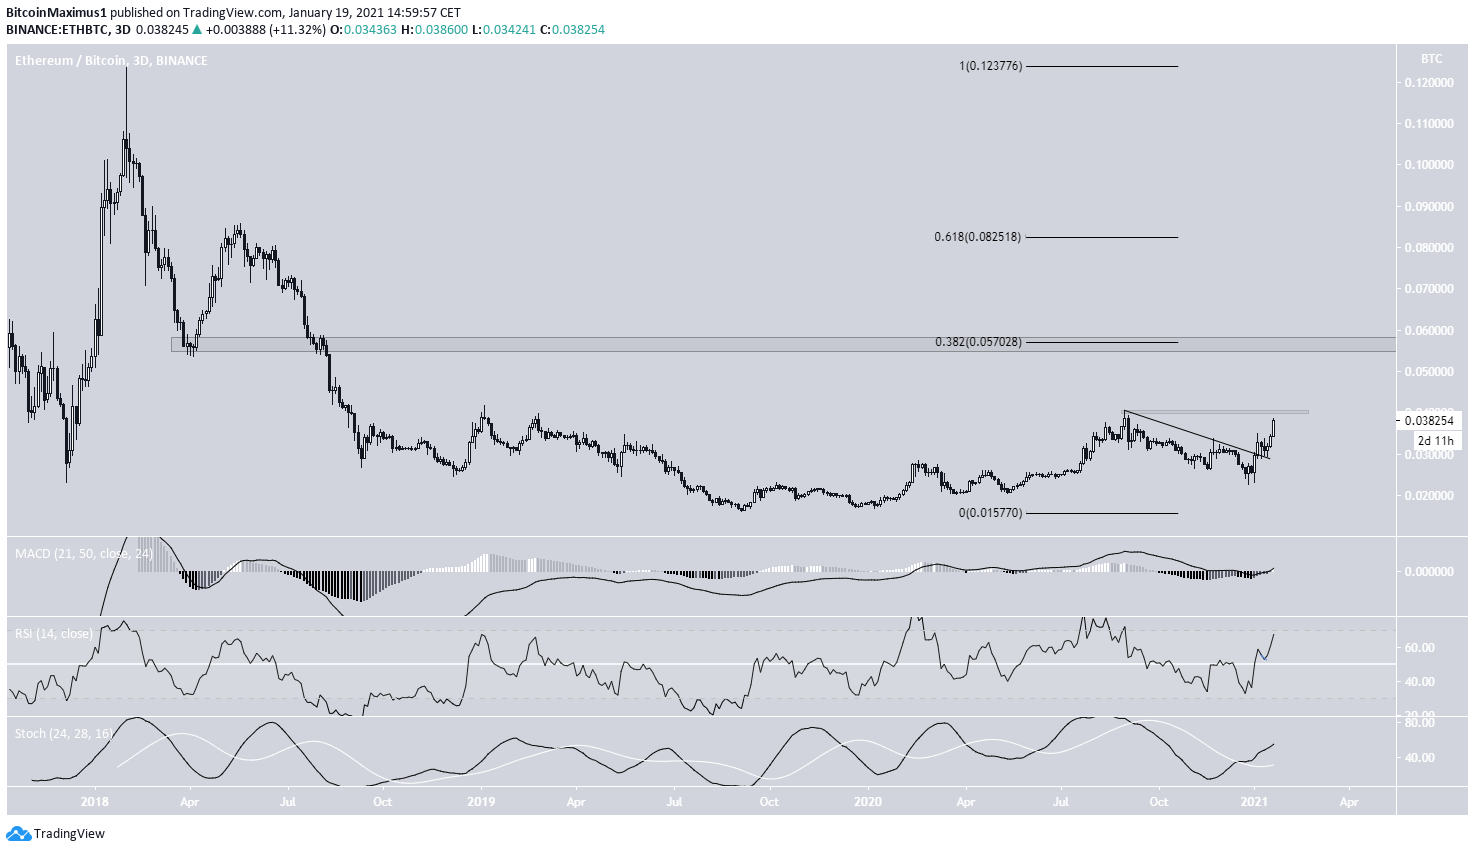
The ETH/BTC pair has been moving upwards since it broke out from a descending resistance line on Jan. 2.
Currently, it’s approaching the ₿0.04 resistance area, which has not been tested for more than four months.
If ETH were to break out, which seems likely due to the price action and bullishness from technical indicators, the next closest resistance area would be found at ₿0.057. This is the 0.382 Fib retracement level of the entire downward movement measuring from the all-time high price of ₿0.123.
Therefore, unlike ETH/USD, the ETH/BTC pair is not close to reaching an all-time high, since it has yet to even reach the 0.382 Fib retracement level.
Conclusion
Ethereum is likely nearing the top of its upward movement that began in March. ETH is expected to reach a high between $1,500-$1,660 before beginning a correction.
For BeInCrypto’s latest Bitcoin (BTC) analysis, click here!
