


On February 5, the Ethereum price broke out from an ascending channel and has been increasing since.
Ethereum Price Highlights
- The price has made a double bottom.
- Ethereum broke out from an ascending channel.
- There is resistance at ₿0.0217, ₿0.0225 and ₿0.026.
- The price has moved above its 200-day moving average (MA).
- It is following a short-term ascending support line.
Full-time trader @CryptoMichNL tweeted an Ethereum price chart which shows that the price has almost reached his target of ₿0.0217. In addition, he believes that the current increase will stall for a while before the price continues its upward movement.
The $BTC pair is basically also running towards the next target.
Think we're going to calm down there for a little, but let's see. pic.twitter.com/TU19kgLjhL
— Michaël van de Poppe (@CryptoMichNL) February 5, 2020
Let’s take a closer look at the Ethereum price movement and attempt to determine where it is heading to next.
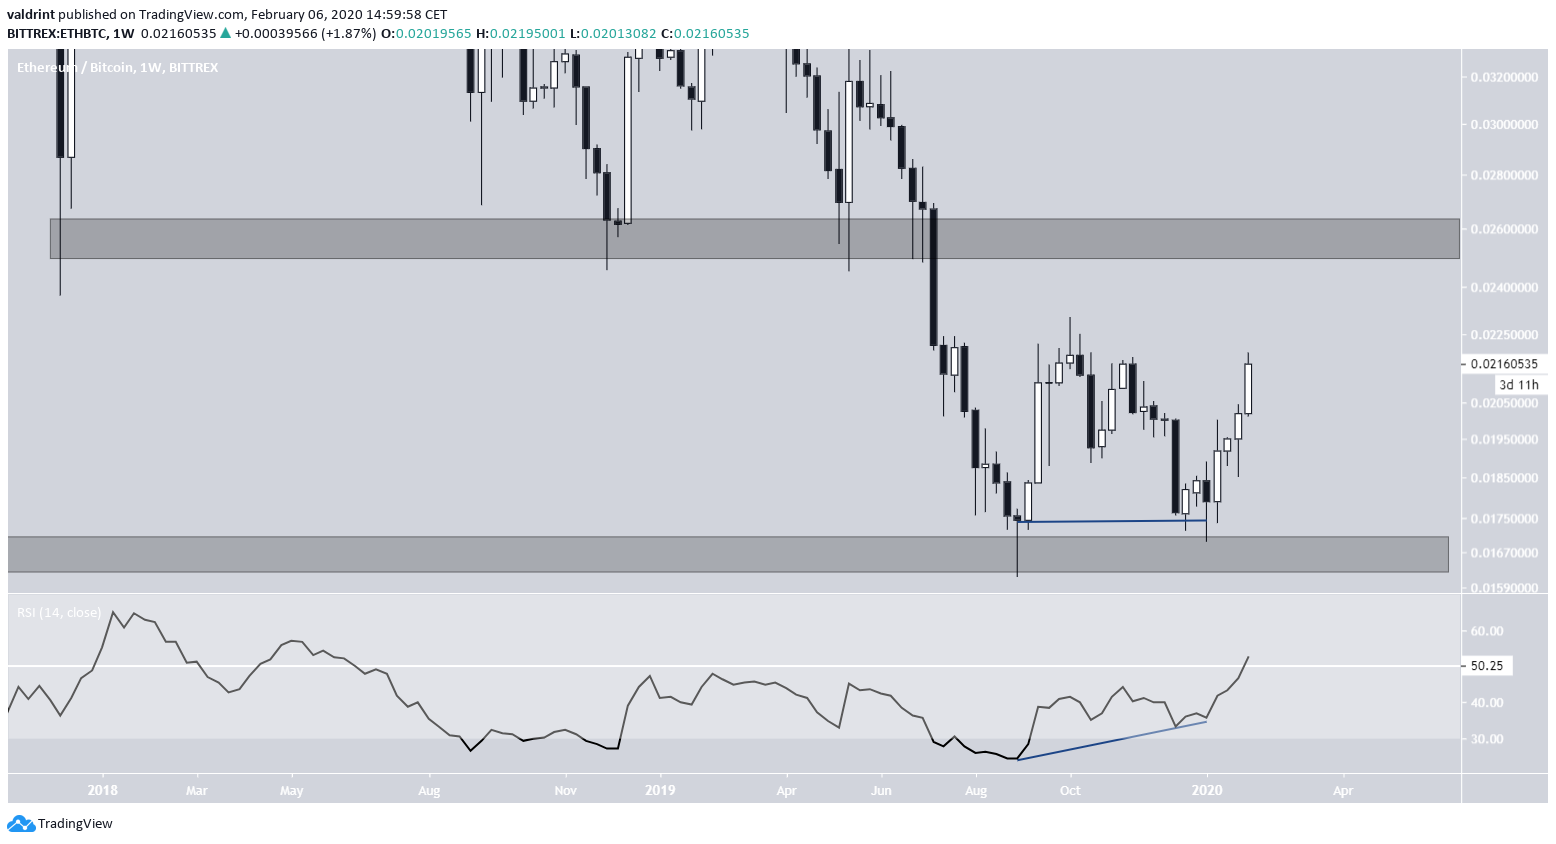
Ethereum’s Double Bottom
Throughout September and December 2019, the Ethereum price created a double bottom near ₿0.0175.
The double bottom was combined with a bullish divergence in the RSI, which was in oversold territory. Afterward, the price began to increase — an event that also caused the RSI line to go above 50, suggesting that the price has begun a bullish trend.
The most significant resistance area which is also the previous breakdown level is found at ₿0.026.
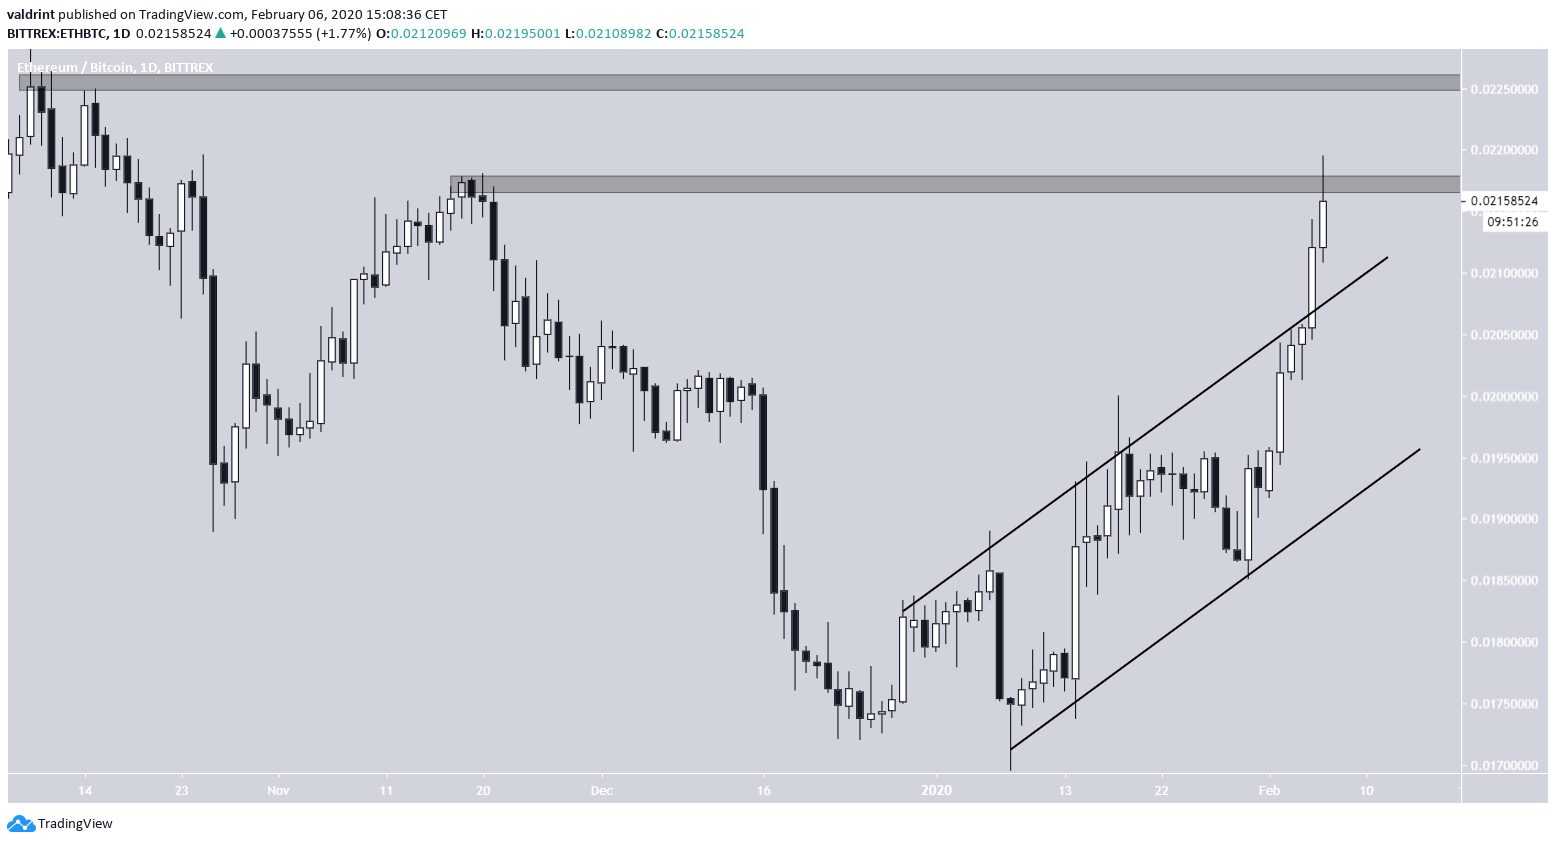
Ascending Channel
Since the second bottom on December 29, 2019, the Ethereum price was trading inside an ascending channel. On February 5, the price broke out from this channel amidst a bullish engulfing candlestick.
The price has reached the target outlined in the tweet, which is found at ₿0.0217 — while the next resistance area is found at ₿0.025, the final resistance area before the previously mentioned breakdown level.
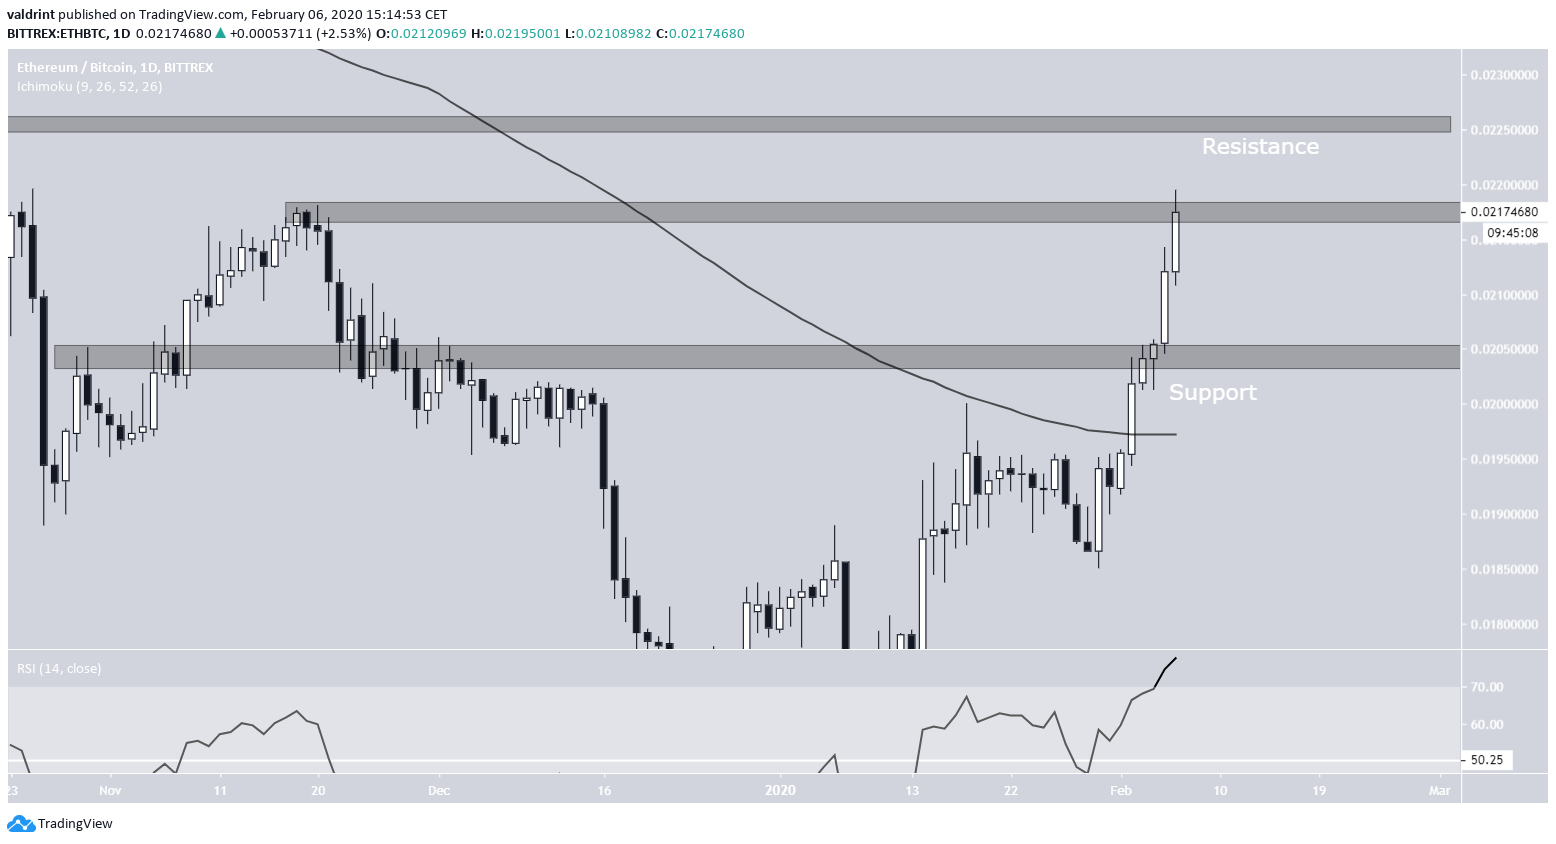
Technical indicators provide a bullish outlook. The Ethereum price moved above its 200-day moving average on February 2 — something it has not done since May 2019.
In addition, while the RSI is overbought, it has not generated any trace of bearish divergence. In the short-term, if the price were to retrace, it would likely find support at ₿0.0205 and consolidate between this support area and resistance.
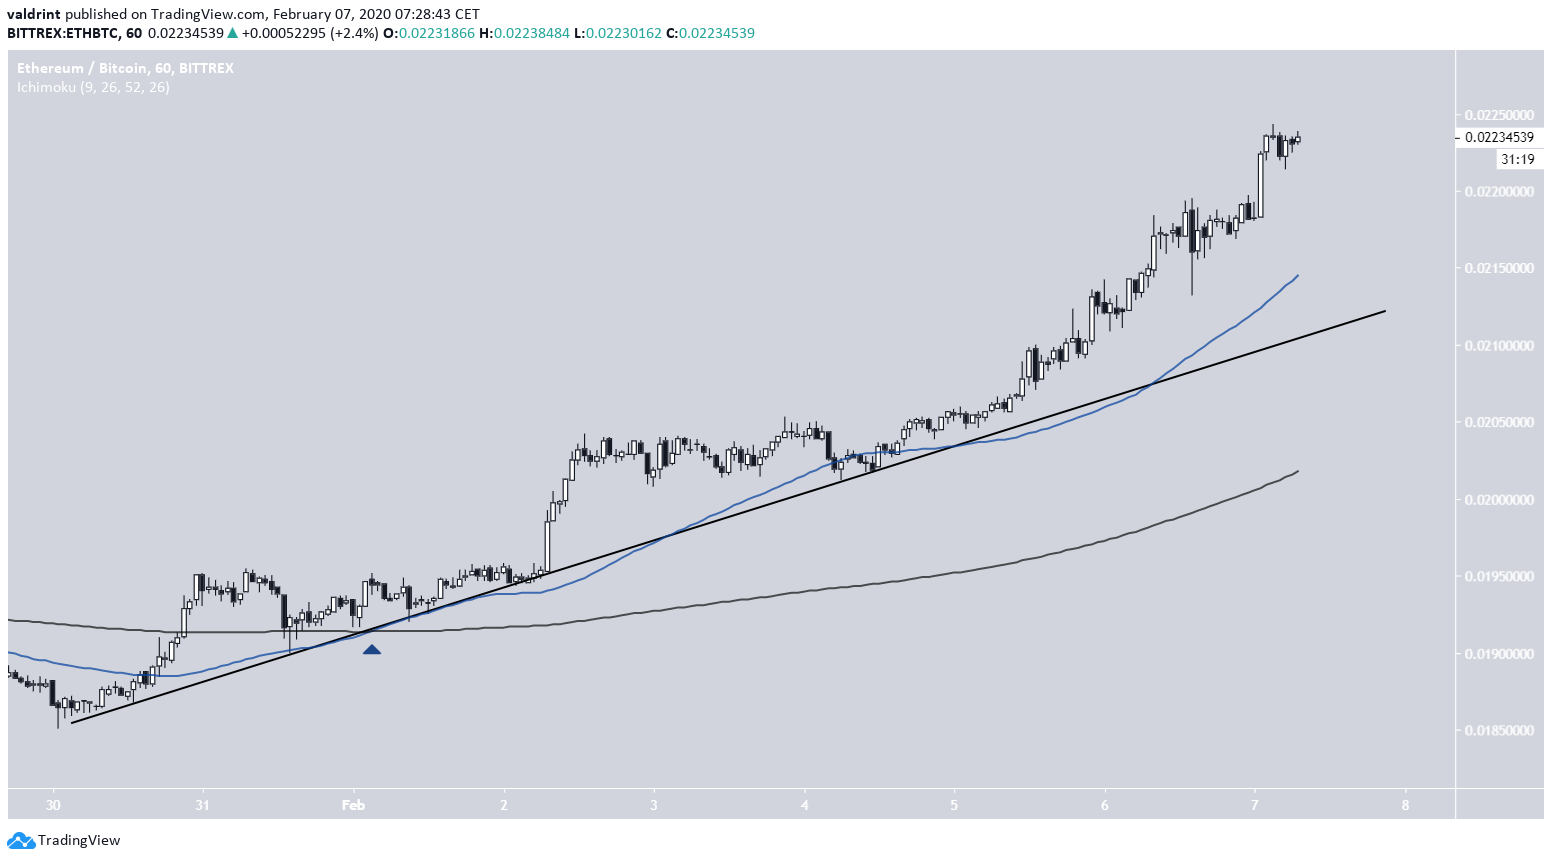
 Short-Term Movement
In the short-term, the Ethereum price has been following an ascending support line since January 30.
The 50- and 200-hour MAs have made a bullish cross and the former is supporting the line.
As long as the price stays above this support line, it is expected to continue moving upwards. Since the price has almost reached the second resistance area at ₿0.225, a breakout above it could greatly accelerate the rate of increase.
To conclude, the Ethereum price has broken out above a significant resistance level. Since the price has yet to show any weakness, we believe it will continue moving upwards at least until it reaches ₿0.0225 and possibly higher.


