


The Ethereum price has broken out above a 378-day descending resistance line. However, the breakout was weak, and the price is likely to test ₿0.0185 before making another attempt at moving upward.
Highlights
- Ethereum broke out above 378-day resistance line
- The price is following a short-term ascending resistance line.
- It is facing close resistance from the 100- and 200-day moving averages (MA).
- There is support at ₿0.0185.
- There is resistance at ₿0.025.
The Ethereum price has been decreasing for the entirety of 2019, losing more than 50% of its value in the process. However, 2020 began on a more positive note. Full-time trader @CryptoMichNL outlined the price of both ETH and EOS, suggesting that they had broken out above significant resistance levels. For ETH, he gave targets of ₿0.022, ₿0.025, and ₿0.0285.
For reference, the thread on $LINK; https://t.co/AUzxUJEwii
Regarding $BTC pairs, also strength. $ETH -> Holding up strong.$EOS -> Flipping green zone and range resistance too.
Some interesting signs. pic.twitter.com/znePh3Quu7
— Michaël van de Poppe (@CryptoMichNL) January 26, 2020
Below, we will take a look at the Ethereum price and asses its probability of reaching the aforementioned targets.
End of the Downward Trend
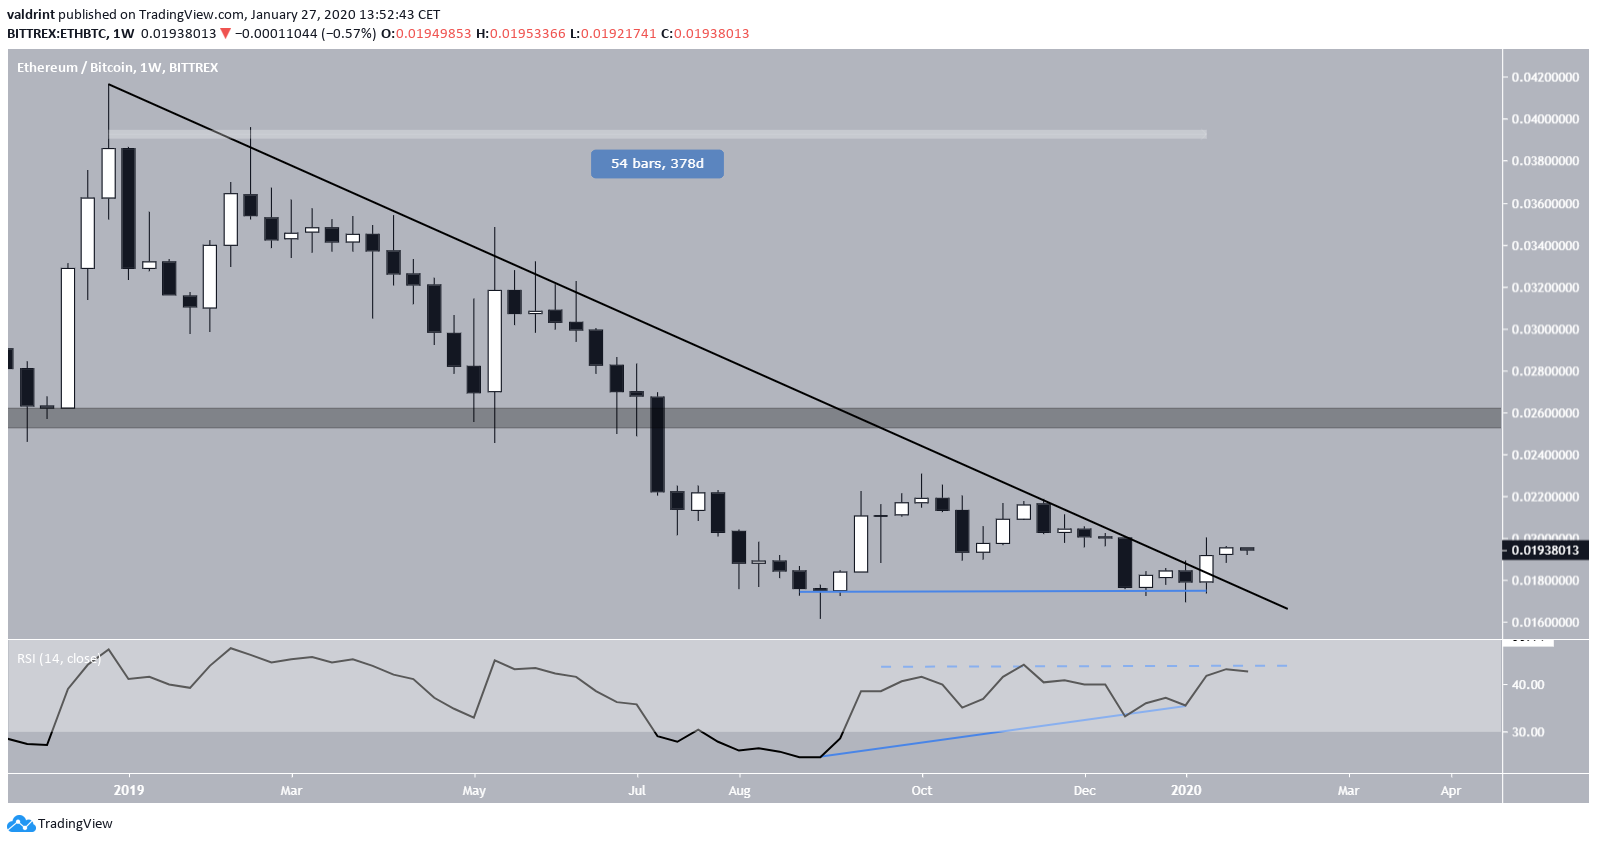
The ETH price had been following a descending resistance line since the end of December 2018. The descending resistance line was in place for 378 days before the price finally broke out.
A double bottom preceded the breakout near ₿0.0175. Besides being a bullish reversal pattern, this breakout was combined with a bullish divergence in the weekly RSI. However, the RSI has yet to complete a failure swing bottom or move above the 50 line. Until the RSI moves above the dashed resistance line at 44, we cannot state that the price has definitely broken out.
The closest major resistance area is found at ₿0.025, fitting with that outlined in the tweet.
Ethereum Current Resistance
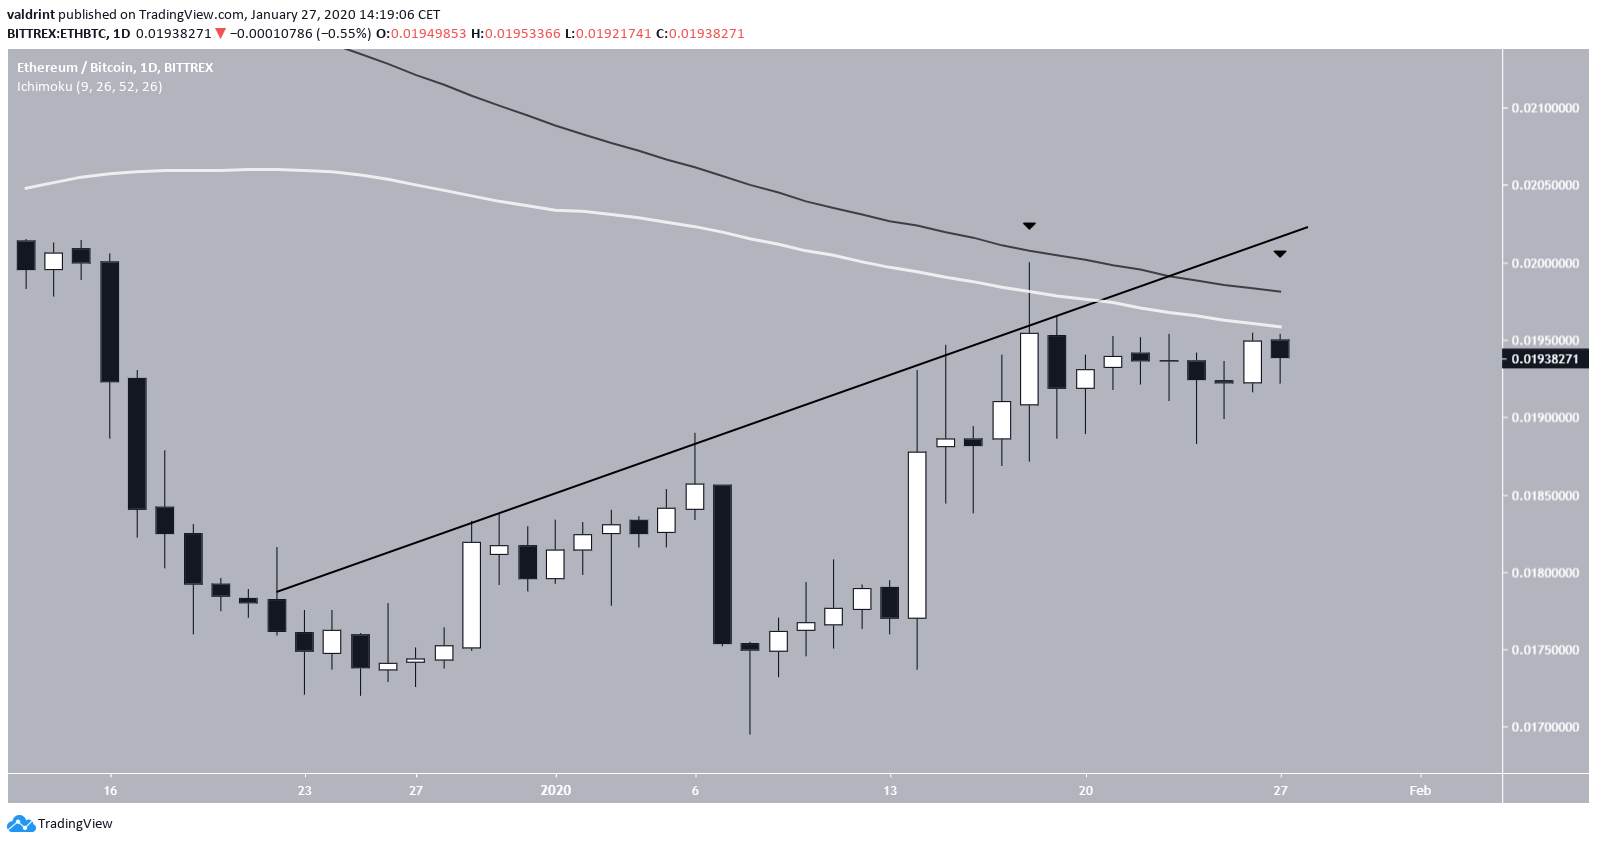
A closer look at the daily chart supports the hypothesis that the price is not clear of its overhead resistance.
ETH has made a double top, and the price is facing very close resistance from both the 100- and 200-day moving averages, which have previously made a bearish cross. Also, the price is following an ascending resistance line.
This makes it difficult for the price to immediately breakthrough above its overhead resistance and move towards the aforementioned resistance areas.
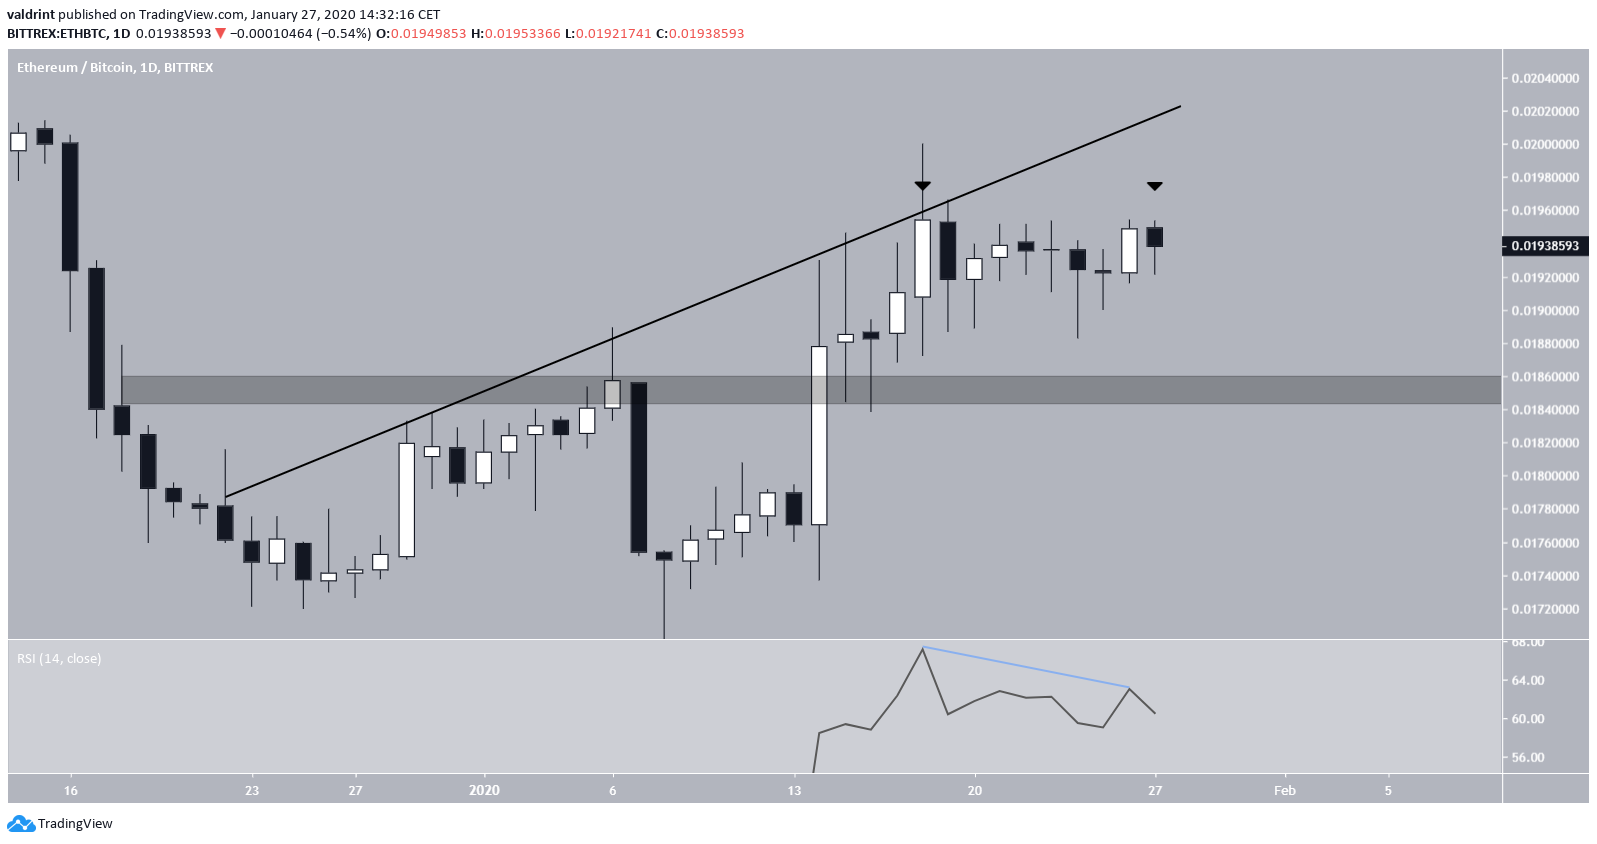
A long upper wick was created during the first top. In addition, the double top, which is a bearish reversal pattern, was combined with a slight bearish divergence in the RSI.
This makes us think that the price will decrease towards the 0.0185 support area before possibly making another breakout attempt.
However, the proposed price decrease is quite small in relation to the possible gains after a breakout. Thus, we would not recommend shorting at the current level in anticipation of a price decrease. Instead, waiting for a breakout seems like a prudent move.
To conclude, the Ethereum price broke out above a 378-day downward trend by moving above its long-term descending resistance line. However, there is strong overhead resistance above the current price, and a short-term decrease could occur before the price resumes its upward movement.


