


The Ethereum (ETH) price has broken out from a long-term resistance level and validated it as support. As long as it’s trading above here, the trend remains bullish.
Breakout From Long-Term Range
Cryptocurrency trader @CryptoMichNL outlined an Ethereum chart, stating that if the current level holds, ETH could rally all the way to $500.
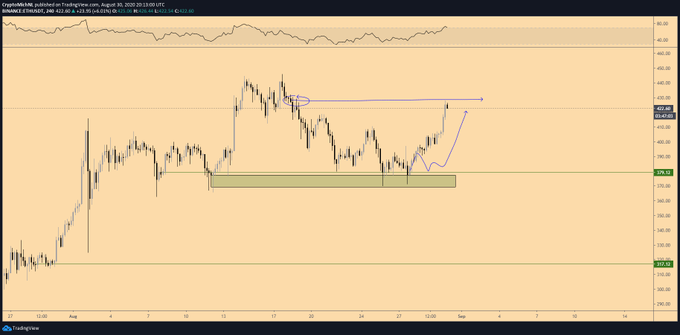
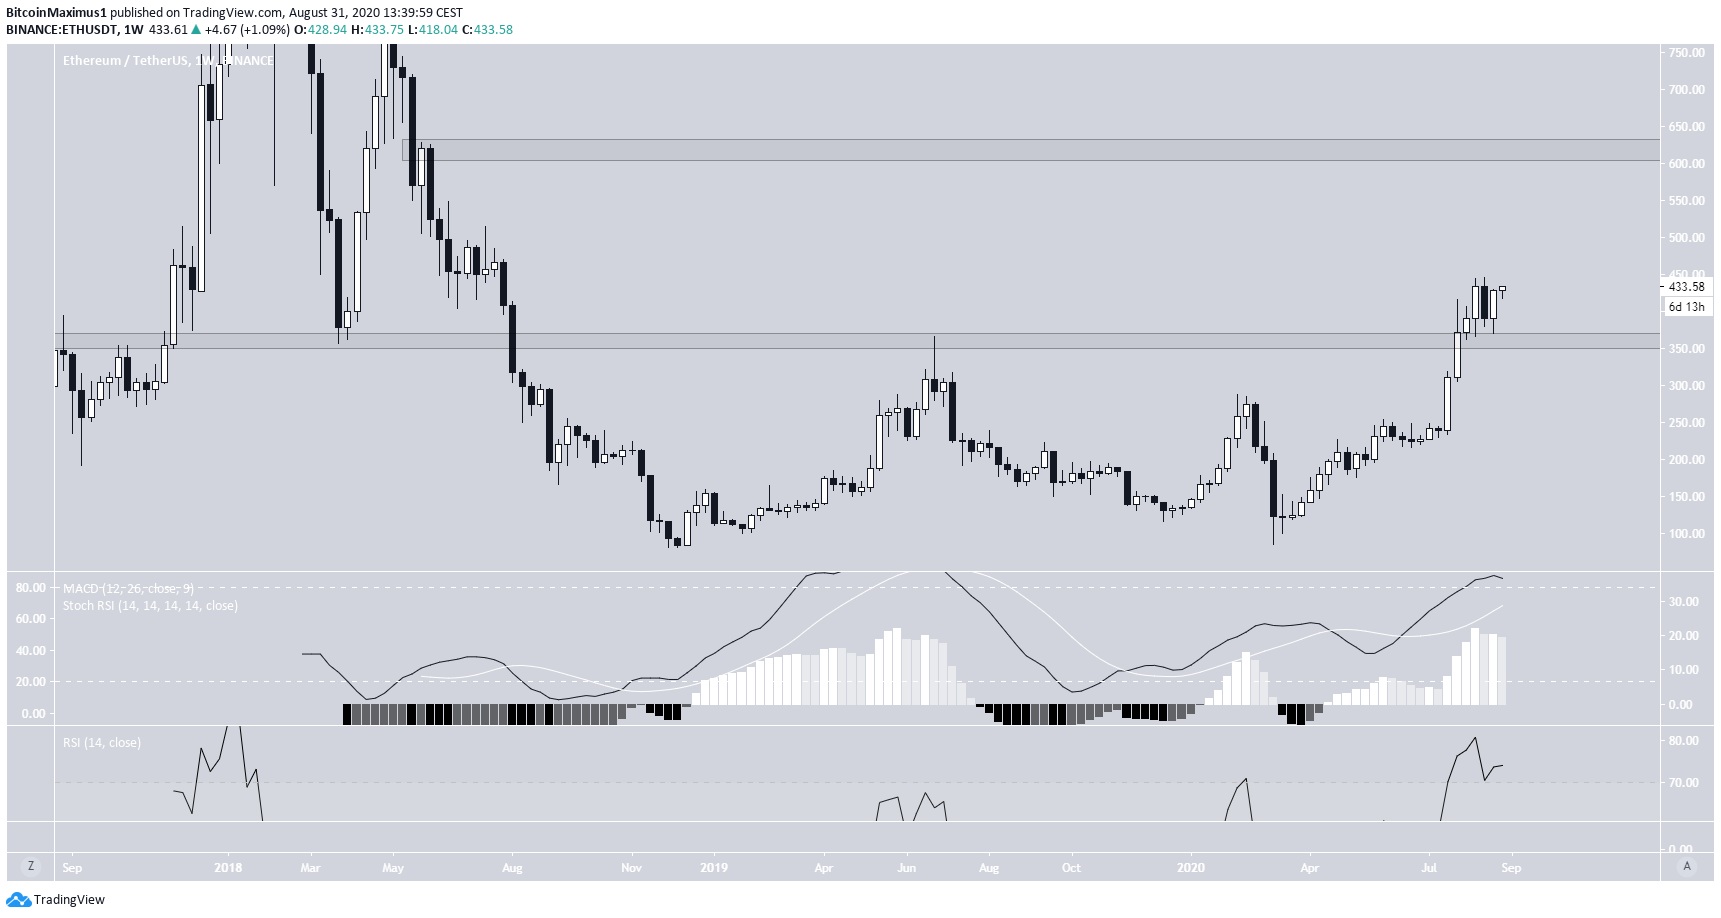
At the beginning of July, the Ethereum price finally broke out from the $360 level, above which it had not traded since July 2018. Throughout the next few weeks, the price validated the level as support. If the price continues rallying, the next resistance area would be found near $620.
Technical indicators are bullish. Even though both the RSI and Stochastic RSI are overbought, neither has generated any bearish divergence. While the MACD fell slightly last week, it hasn’t formed any bearish divergence nor a bearish reversal signal.
Therefore, the ETH price should continue moving upwards based on the weekly time-frame.
Possible Ethereum Weakness?
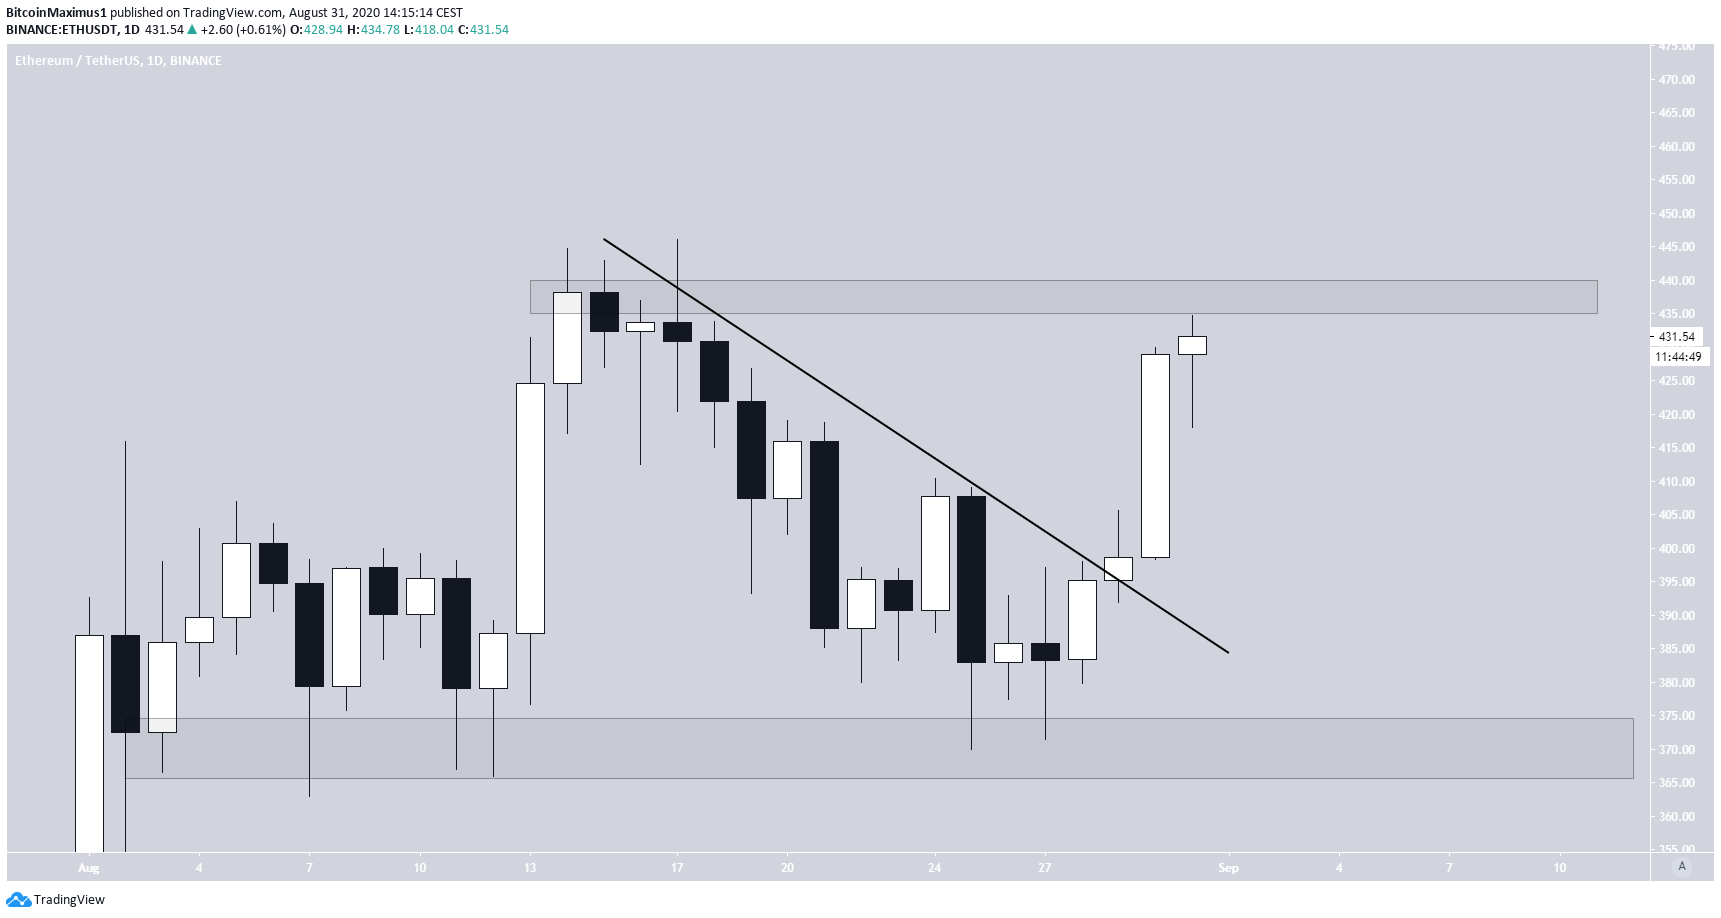
The daily chart shows that the price has already broken out from a descending resistance line which had been in place since the August 15 highs and is approaching the $440 resistance area.
Conversely, the closest support is found all the way down at $360.
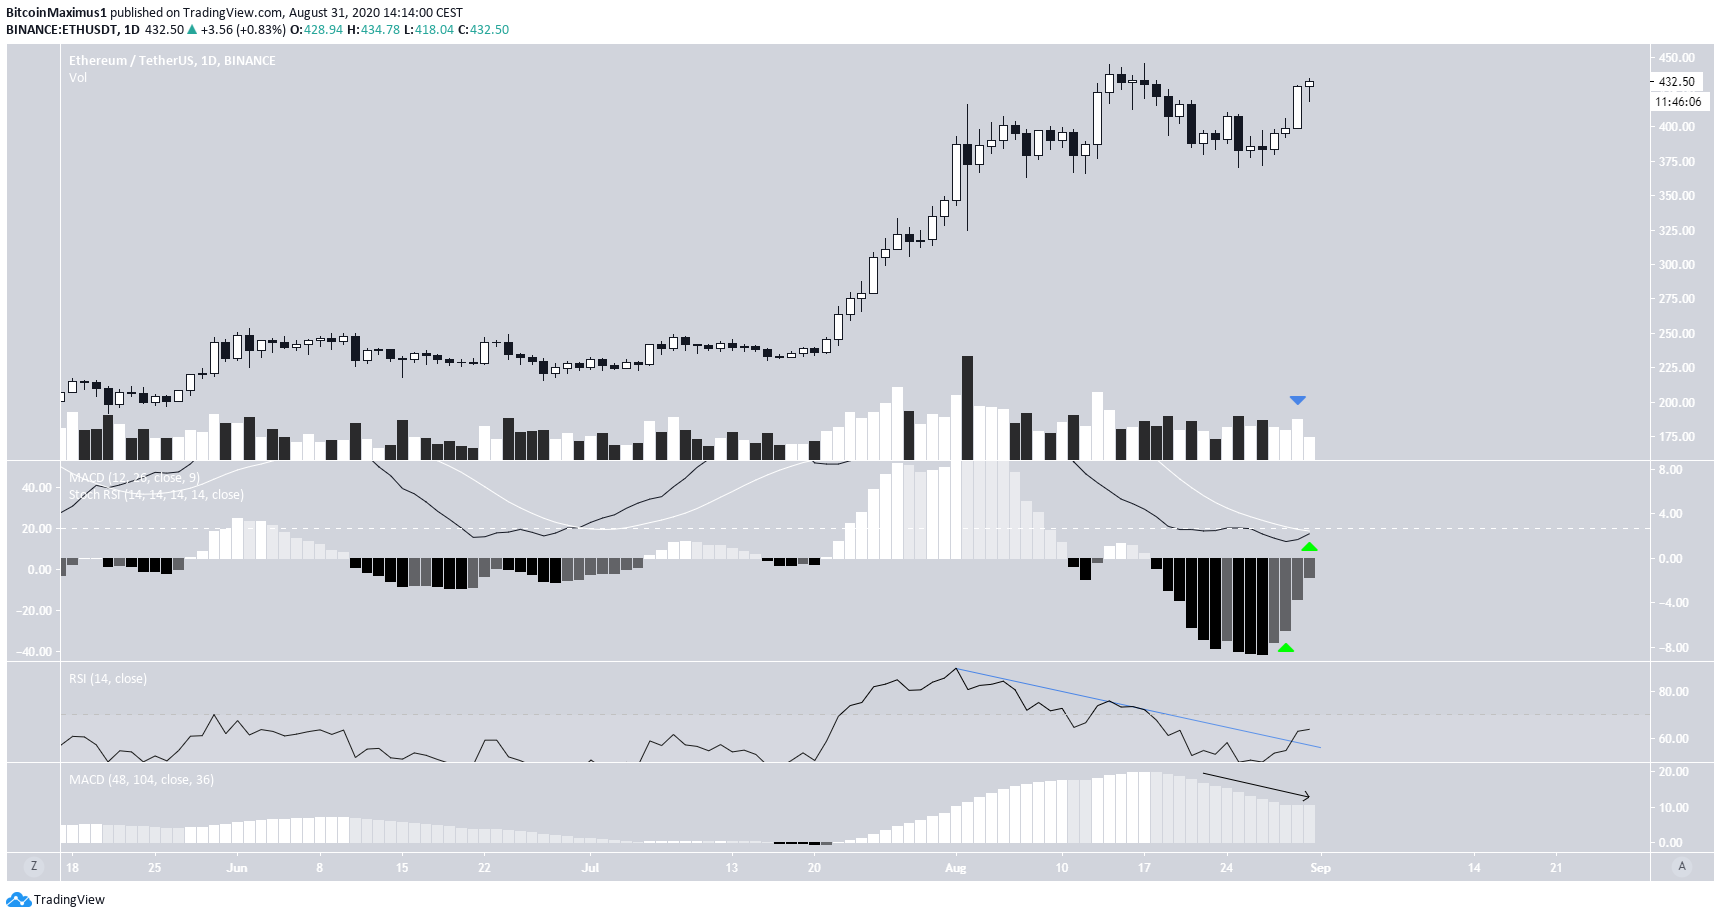
Technical indicators are bullish, even though the volume on rallies has been pretty weak. The MACD has given a bullish reversal signal and the stochastic RSI has formed a bullish cross. Furthermore, the RSI has broken a bearish divergence trend-line that had been in place throughout the fall since August 15.
The majority of the signs suggest that the price will continue moving upwards.
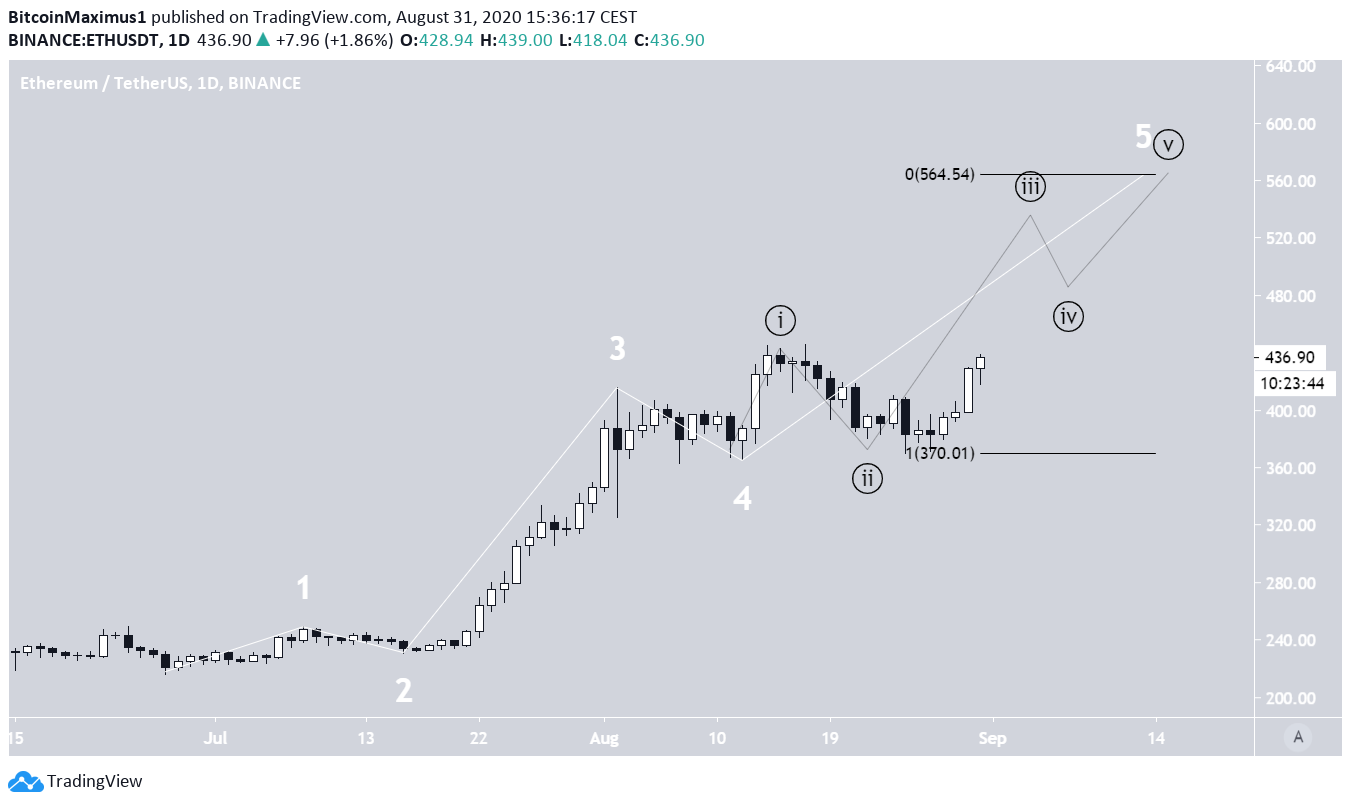
Wave Count
Beginning on June 26, the price has likely initiated a five-wave upward move (shown in white below), currently being in the fifth wave. Due to the fact that the first and second sub-waves (black) were large, we would expect the fifth wave to extend, taking the price towards $600.
Projecting the length of waves 1 – 3 to the bottom of 4 gives us a target of $565. A fall below the bottom of wave 4 at $370 would invalidate this particular wave count.
To conclude, the Ethereum price is expected to continue moving upwards towards the next closest resistance area near $600.


