
The Berlin fork was activated on the Ethereum (ETH) mainnet on April 15. It went live on block 12,244,000. The same day, the price also reached a new all-time high.
ETH is expected to continue increasing into price discovery. In addition, the rate of acceleration is likely to be faster than that of bitcoin (BTC).
Ongoing breakout
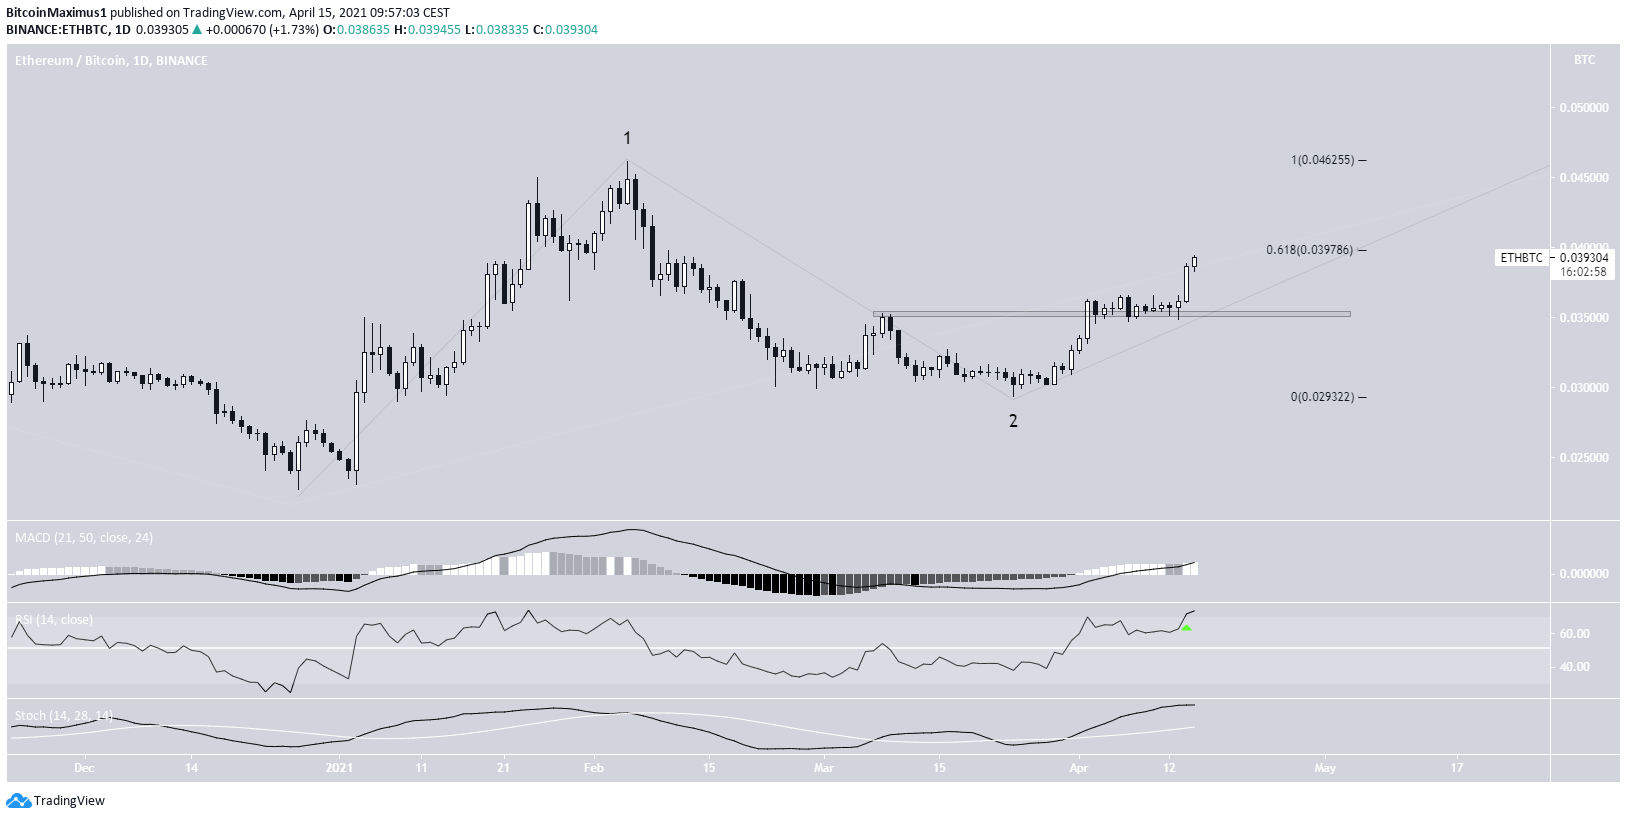
ETH/BTC has been increasing since March 24.
It managed to reclaim the ₿0.0352 resistance area on April 2. Afterwards, it validated it as support ten days later.
Since then, it has been moving upwards. The two main resistance areas are found at ₿0.0397 and ₿0.046. The former is the 0.618 Fib retracement level while the latter the February highs.
Technical indicators are bullish, indicating that ETH will likely increase towards the latter. This is especially evident by the RSI cross above 70 and the bullish cross in the Stochastic oscillator.
Wave count
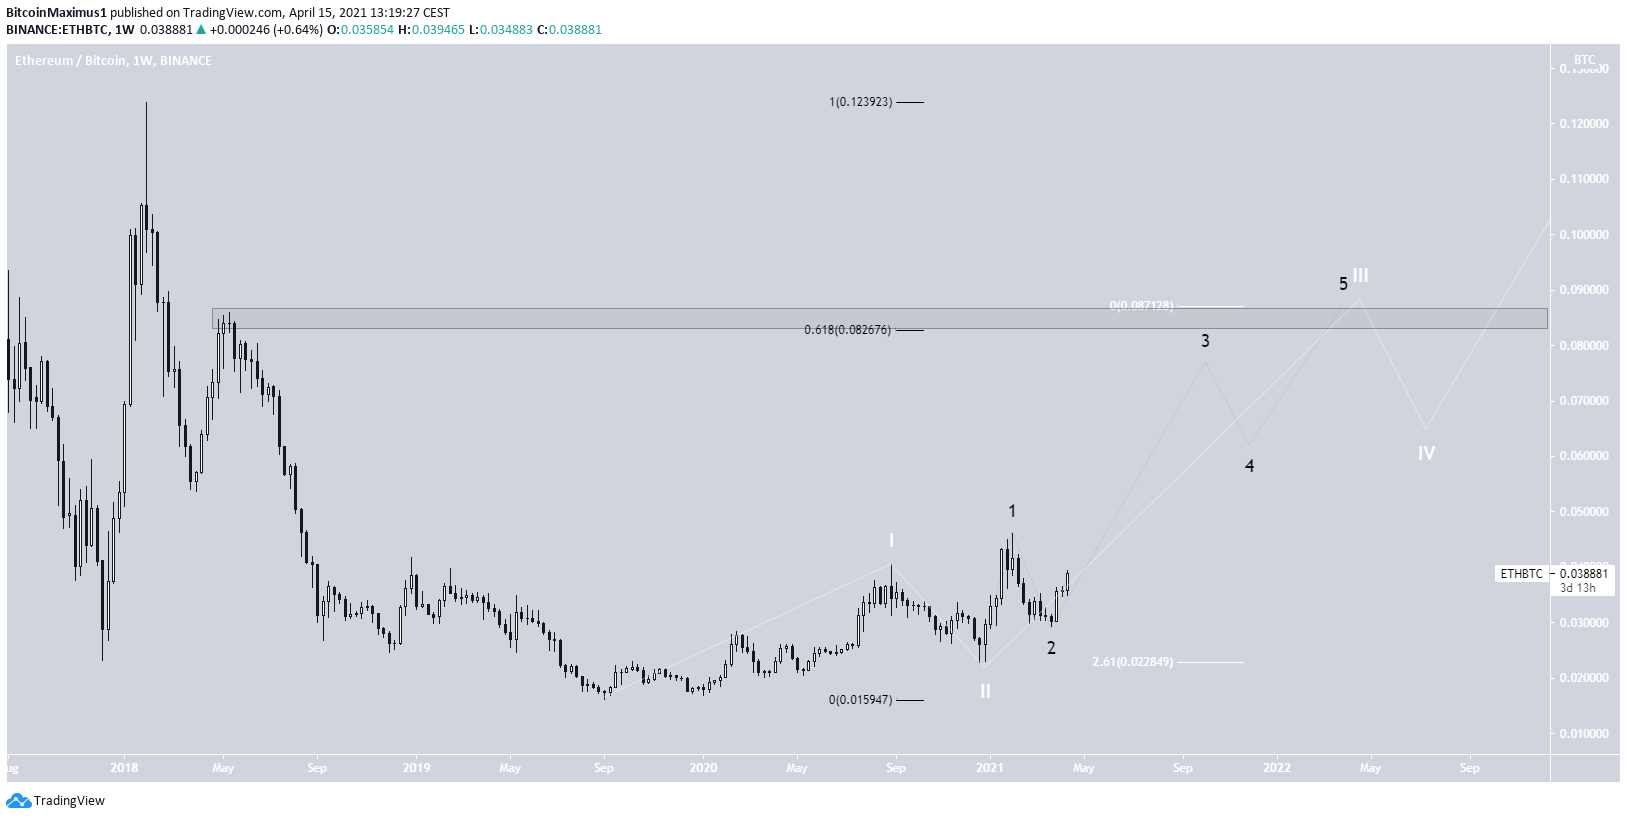
The wave count indicates that ETH has begun a long-term bullish impulse (white). If so, it is currently in wave three.
The sub-wave count is given in black. Judging by the rate of increase of sub-wave one, it is likely that the long-term wave three has extended.
Therefore, a potential target for the top of this wave is found at ₿0.087. This would give waves 1:3 a 1:1.61 ratio.
In addition, the ₿0.082 level is the 0.618 Fib retracement of the previous decrease. Therefore, the entire ₿0.082-₿0.087 area is likely to act as the top of wave three.
ETH/USD
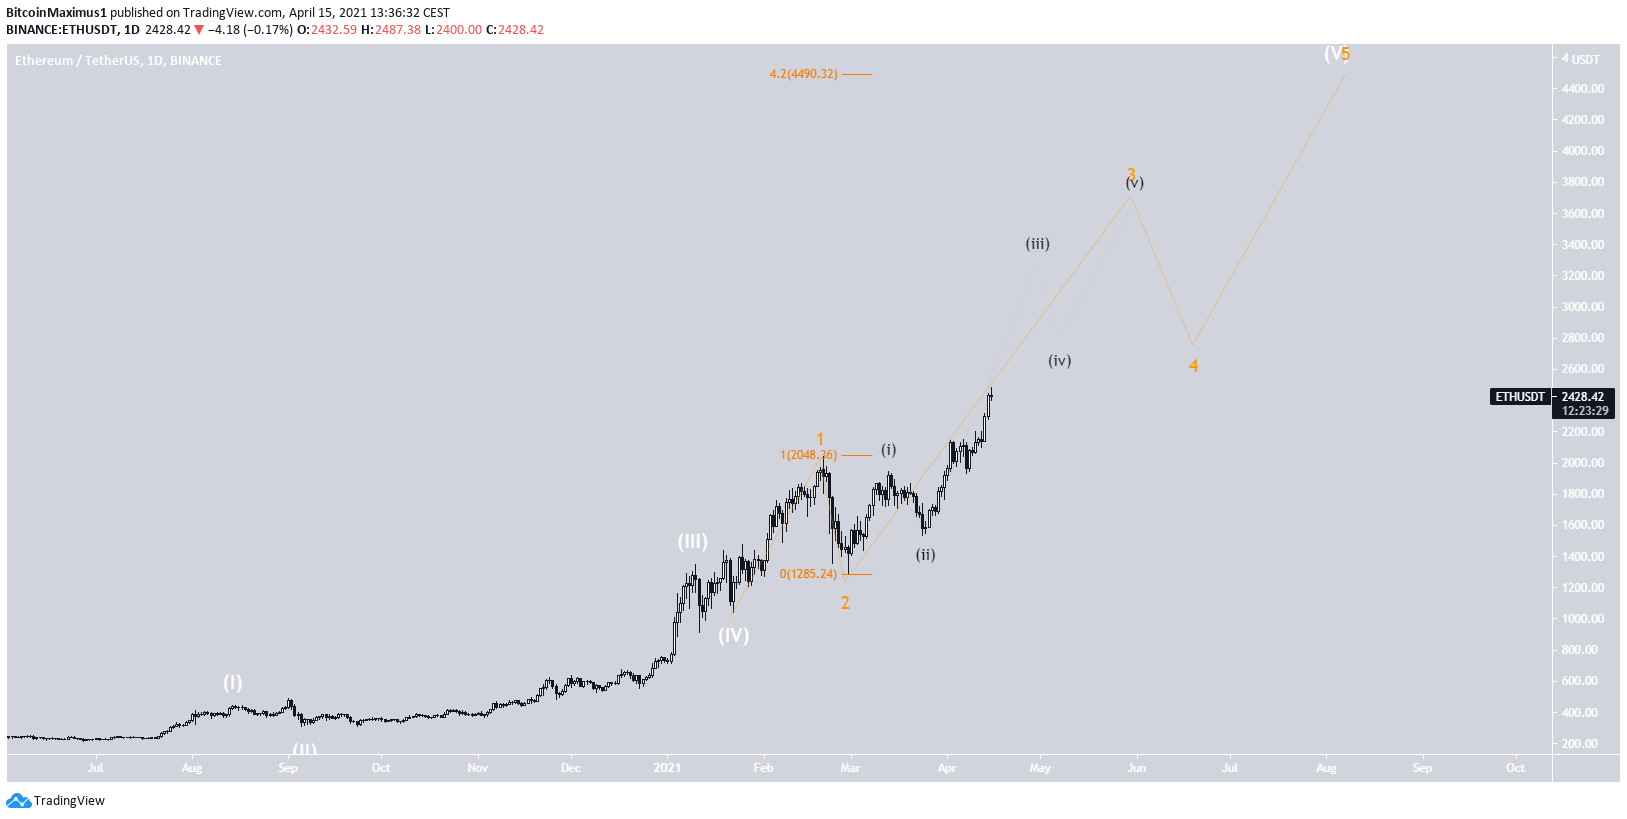
Today, ETH managed to reach a new all-time high price of $2,487. The wave count indicates that it is in an extended wave five (white).
The sub-wave count is given in orange, while the minor sub-wave count in black.
A potential target for the top of this move is located at $4,500. This is found by using an external retracement on sub-wave two.
When looking at the sub-wave count, this seems like a massive 1-2/1-2 wave formation.
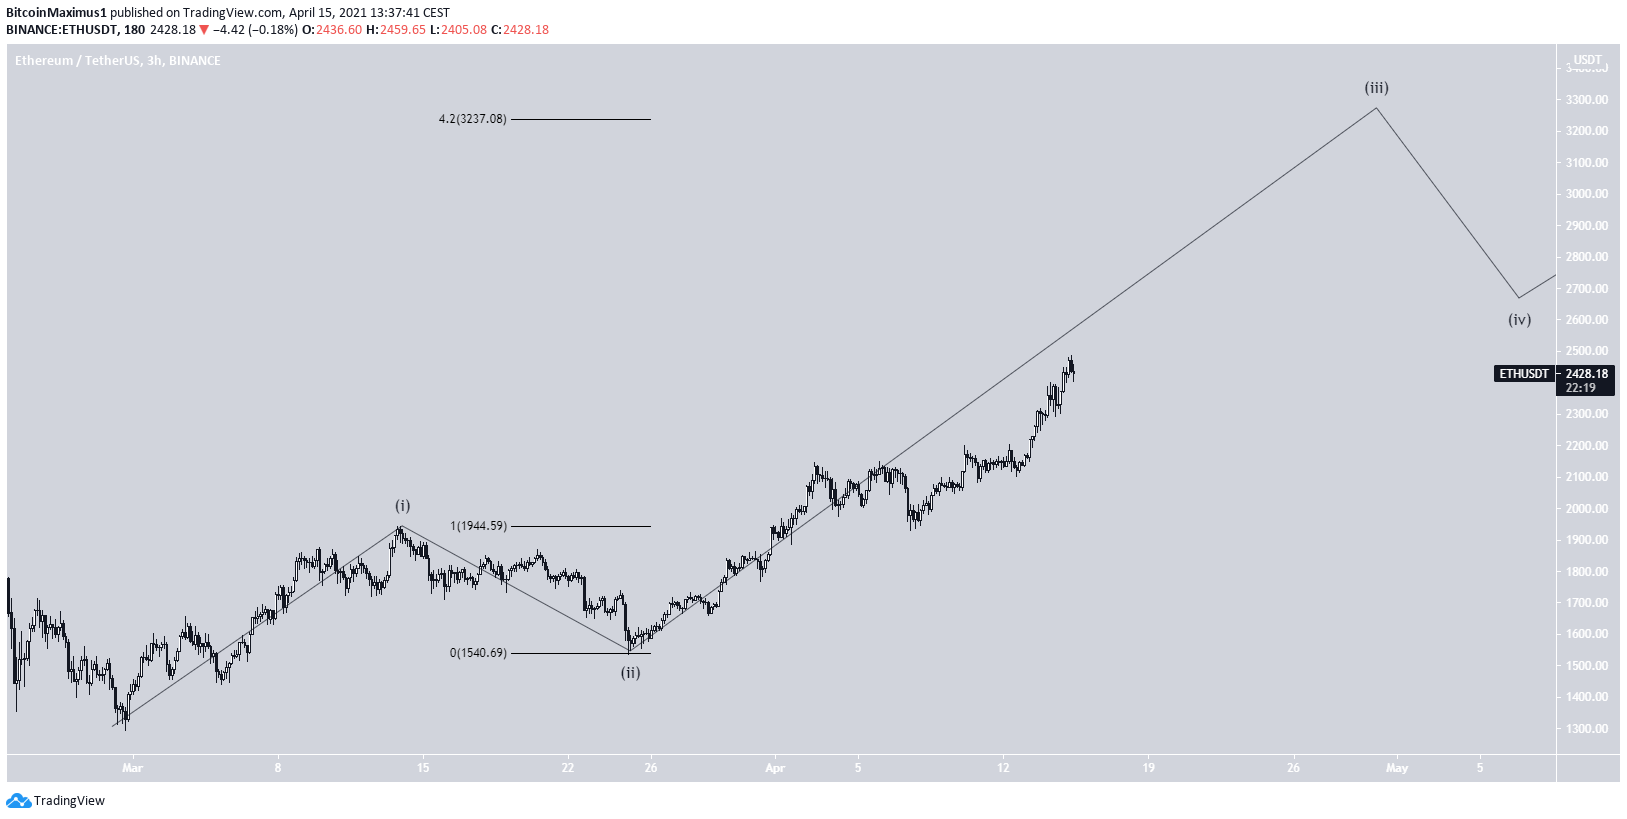
A closer look at the minor sub-wave movement also shows an extension. The first minor resistance level is found at $3,240.
Conclusion
To conclude, ETH is expected to increase well into price discovery, with the first resistance being found at $3,200.
In addition, the rate of increase is likely to be much faster than that of BTC.
For BeInCrypto’s latest bitcoin (BTC) analysis, click here.
