
Leading altcoin Ethereum has trended downward since its failed attempt to reclaim its all-time high on August 13.
As sell-side pressure strengthens amid increased profit-taking, ETH’s price has slipped 10% in the past five days and is expected to continue declining.
Ethereum Bears Gain Control
ETH’s long/short ratio has dropped to a 30-day low, reflecting traders’ growing caution and a decline in bullish sentiment. As of this writing, this ratio stands at 0.90.
For token TA and market updates: Want more token insights like this? Sign up for Editor Harsh Notariya’s Daily Crypto Newsletter here.
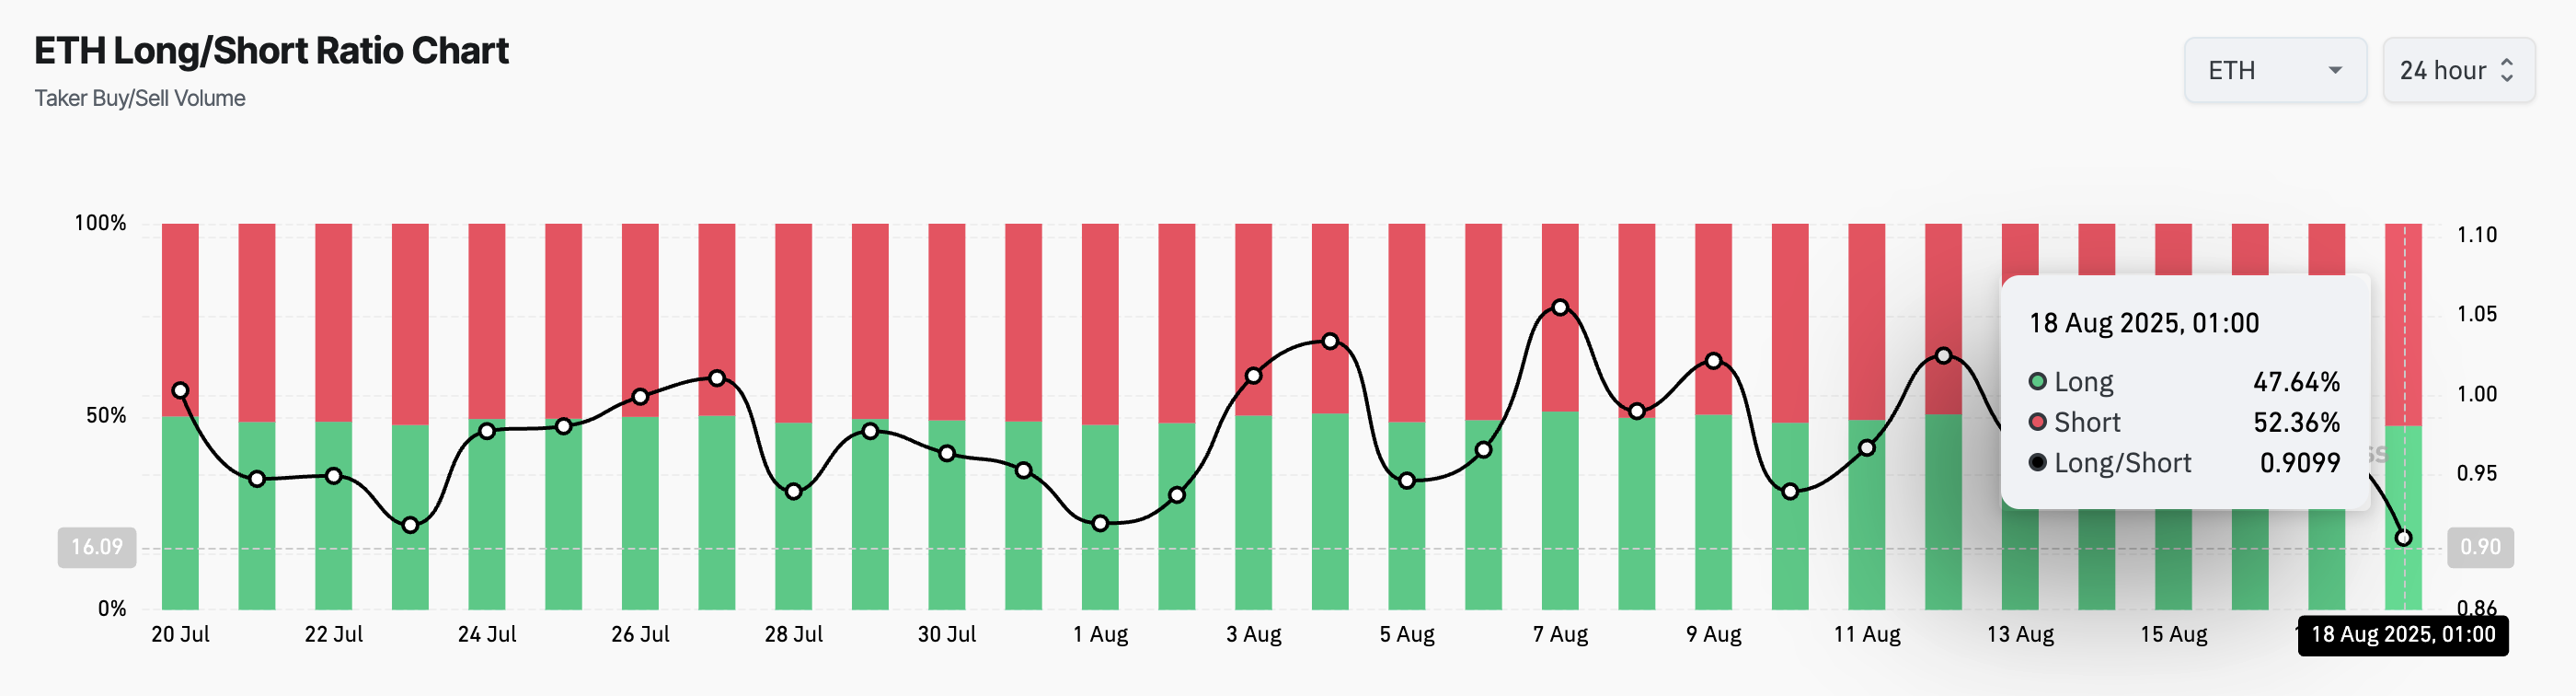
This ratio compares the number of long and short positions in a market. When an asset’s long/short ratio is above 1, there are more long than short positions, indicating that traders are predominantly betting on a price increase.
Conversely, as seen with ETH, a ratio under one suggests that most traders are positioning for a price drop. This highlights the growing bearish sentiment among ETH futures holders as expectations of sustained downside movements grow.
Moreover, the negative crossover in ETH’s Moving Average Convergence Divergence (MACD) during today’s session points to renewed seller dominance. At press time, the coin’s MACD line (blue) rests under its signal line (orange).
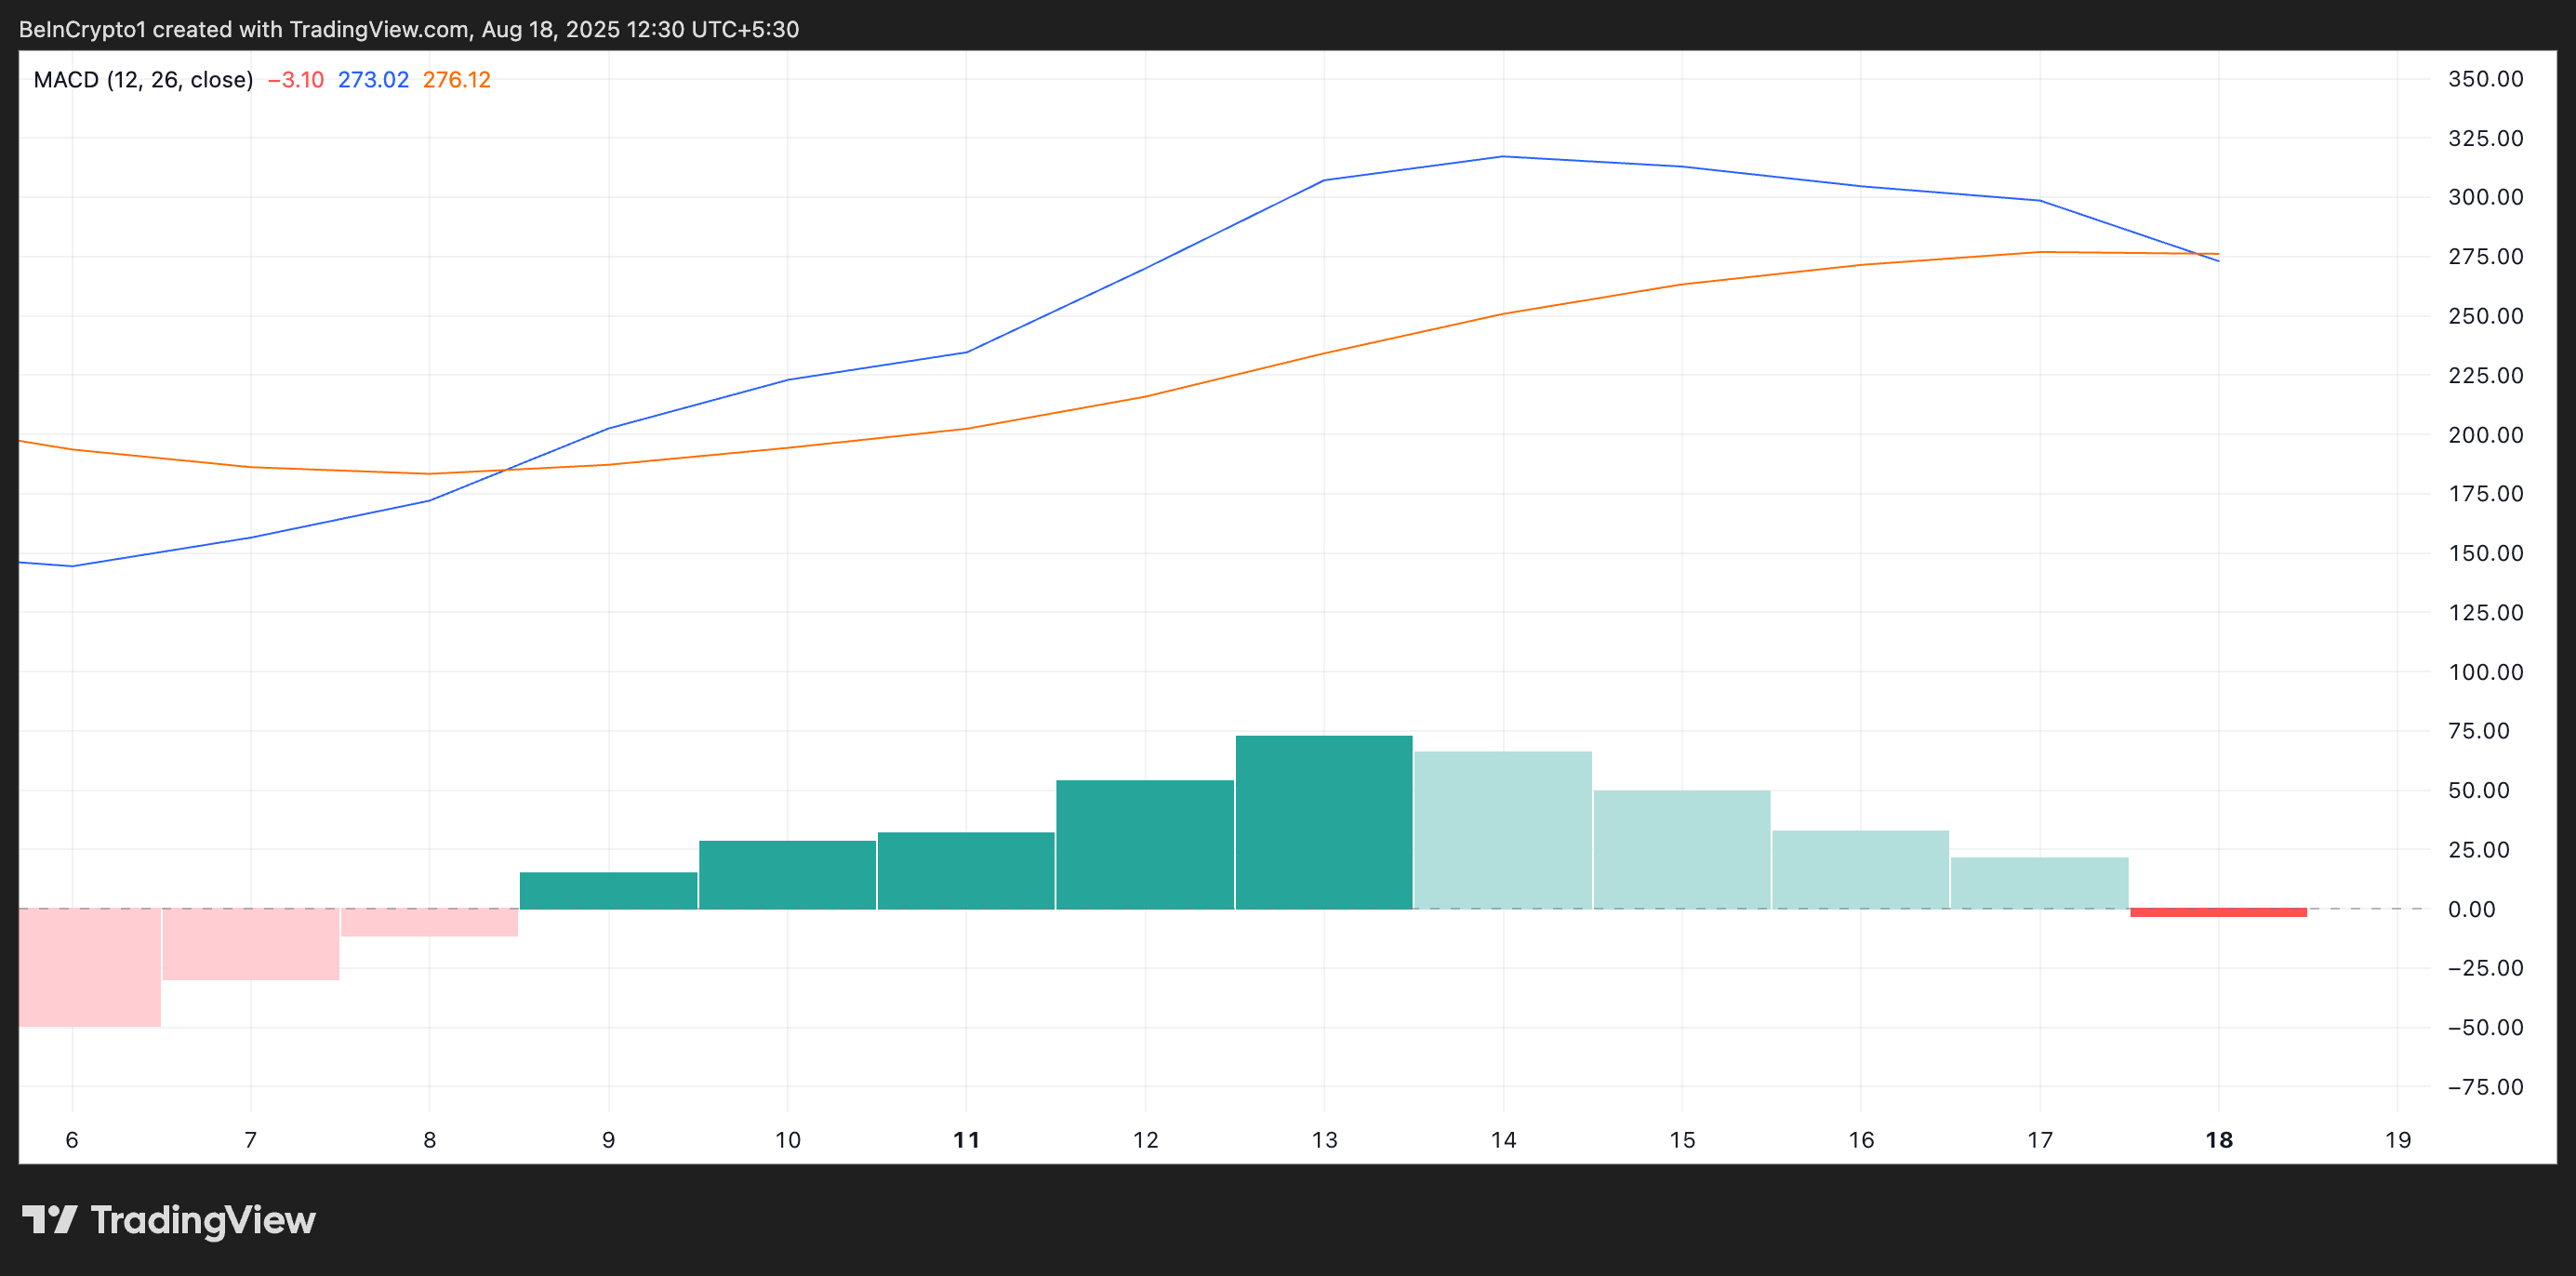
The MACD indicator identifies trends and momentum in its price movement. It helps traders spot potential buy or sell signals through crossovers between the MACD and signal lines.
When the MACD line crosses below the signal line, it’s considered a bearish signal. It indicates that downward momentum is increasing, and sellers may be taking control.
ETH’s recent negative MACD crossover suggests that its price could continue to face selling pressure. This worsens the risk of a decline toward lower support levels near $4,000.
ETH Price Faces Critical Test
At press time, ETH trades at $4,224. If selloffs continue, the leading altcoin risks plunging toward $4,063. Should this price floor fail to hold, ETH’s price could drop to $3,491.
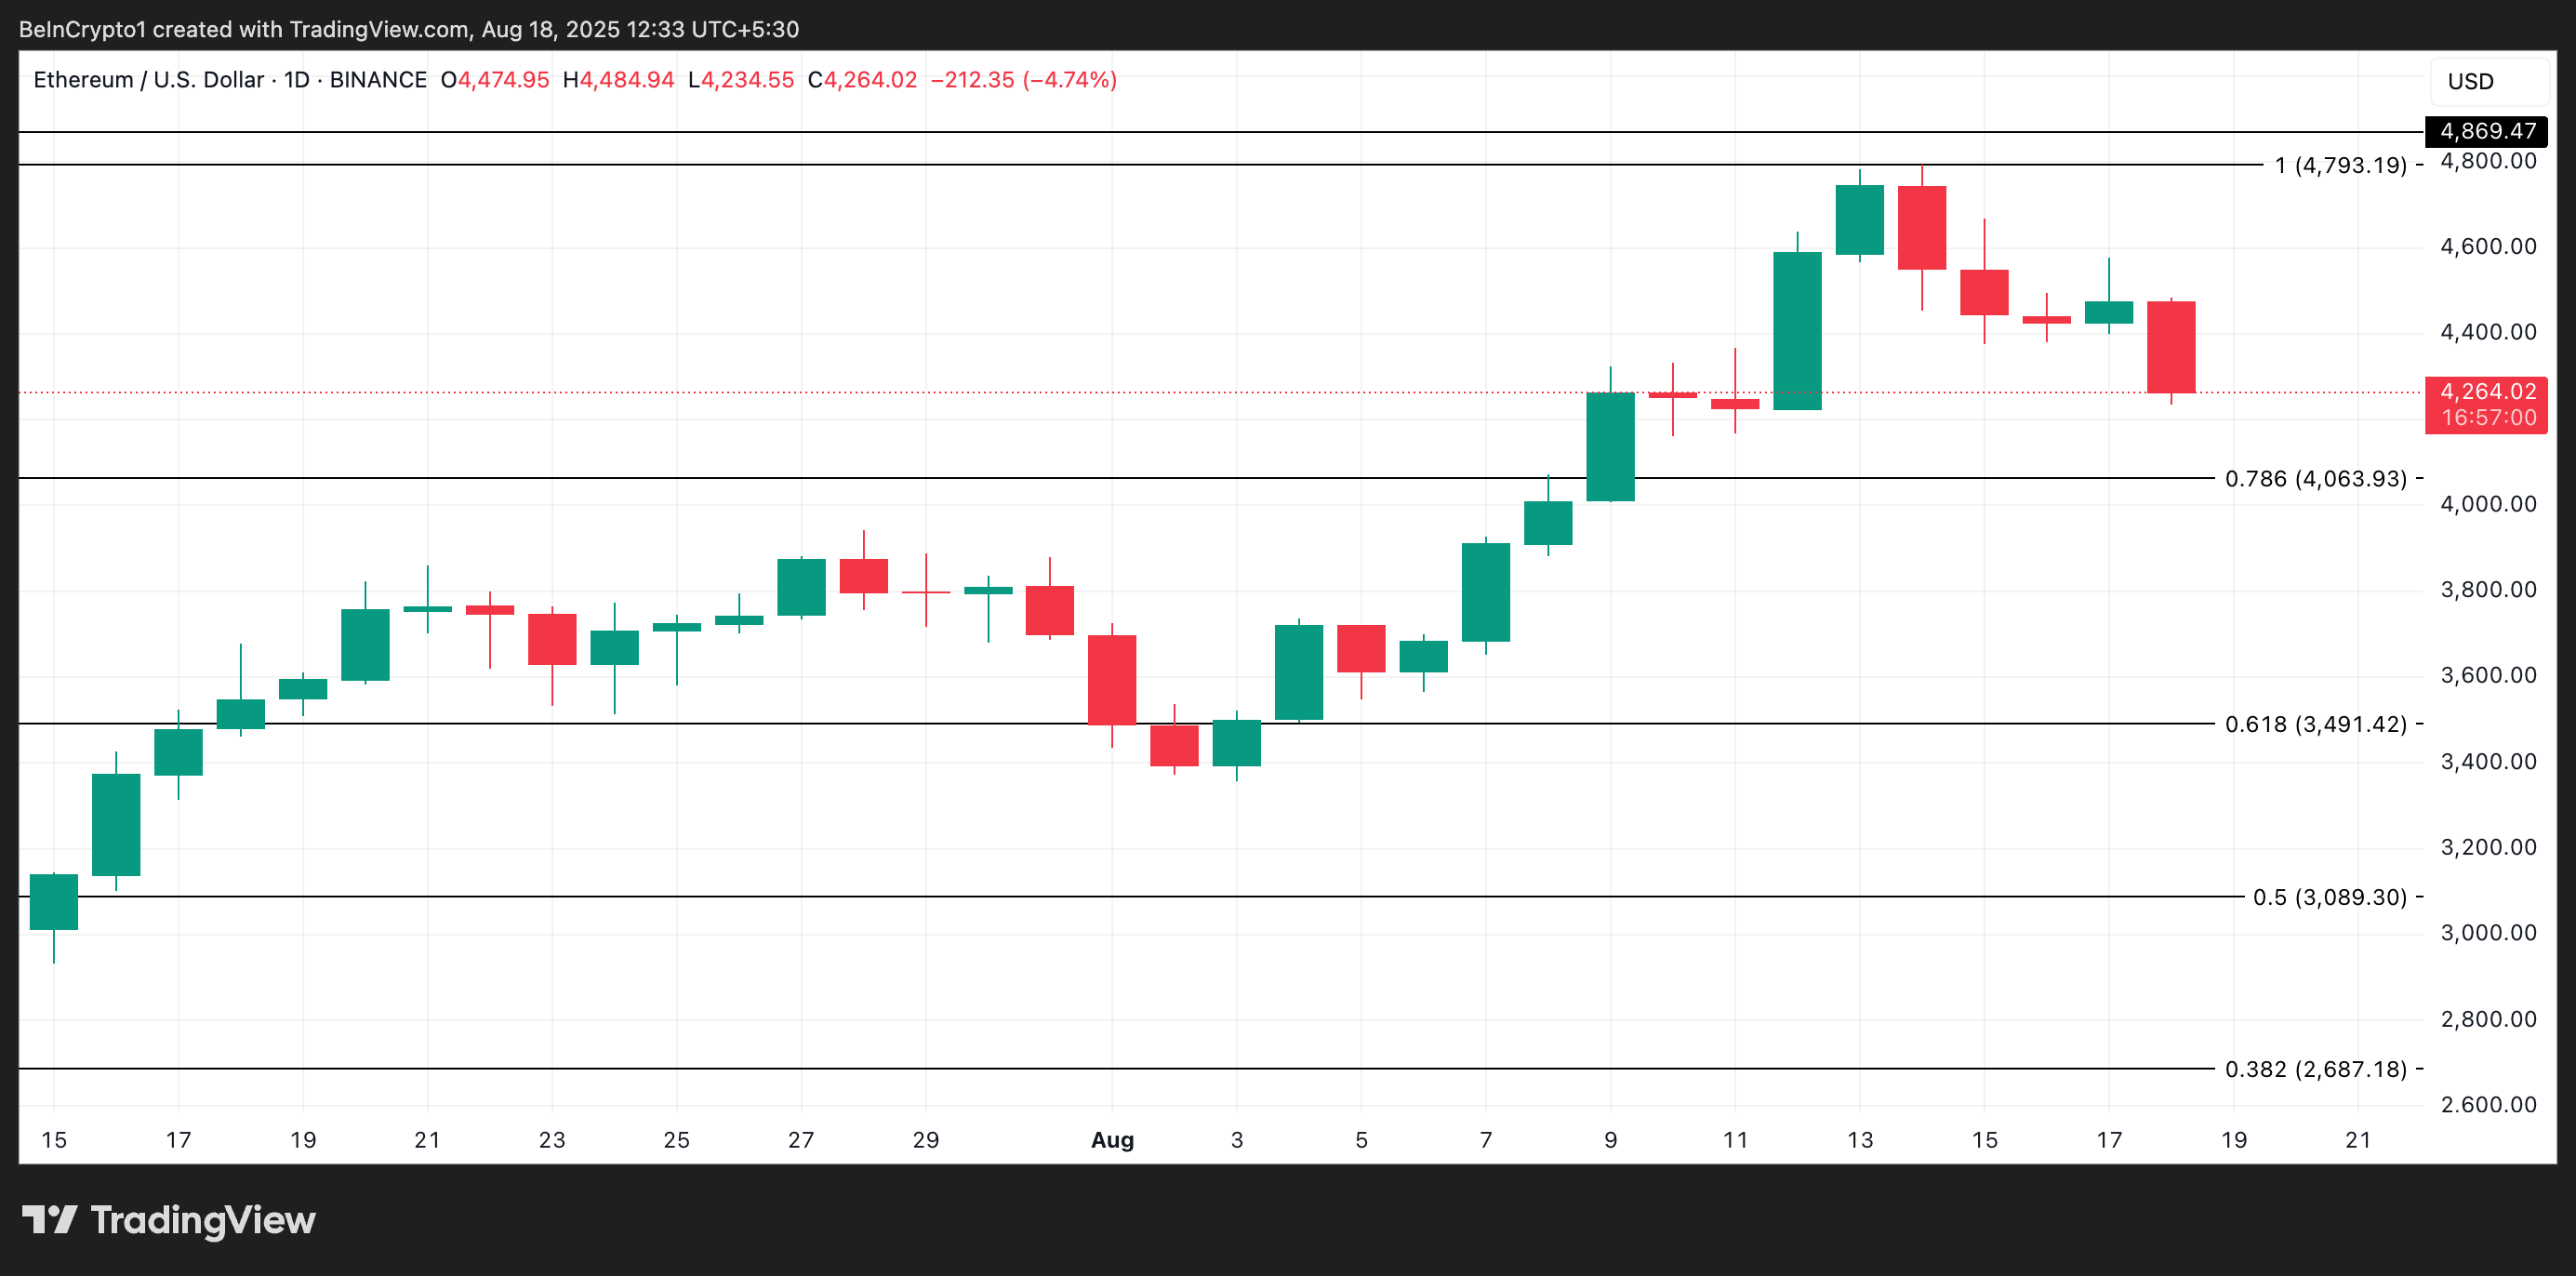
On the other hand, if new demand enters the market, it could drive the altcoin’s price up to $4,793. A successful break above this level could trigger a rally back to ETH’s all-time high of $4,869.
