


On Mar 16, 2019, Ethereum (ETH) reached a high of nearly $148. It has been on a gradual downtrend with significant fluctuations since. When will the price make a bottom? Keep reading, and we might just have an answer for you.
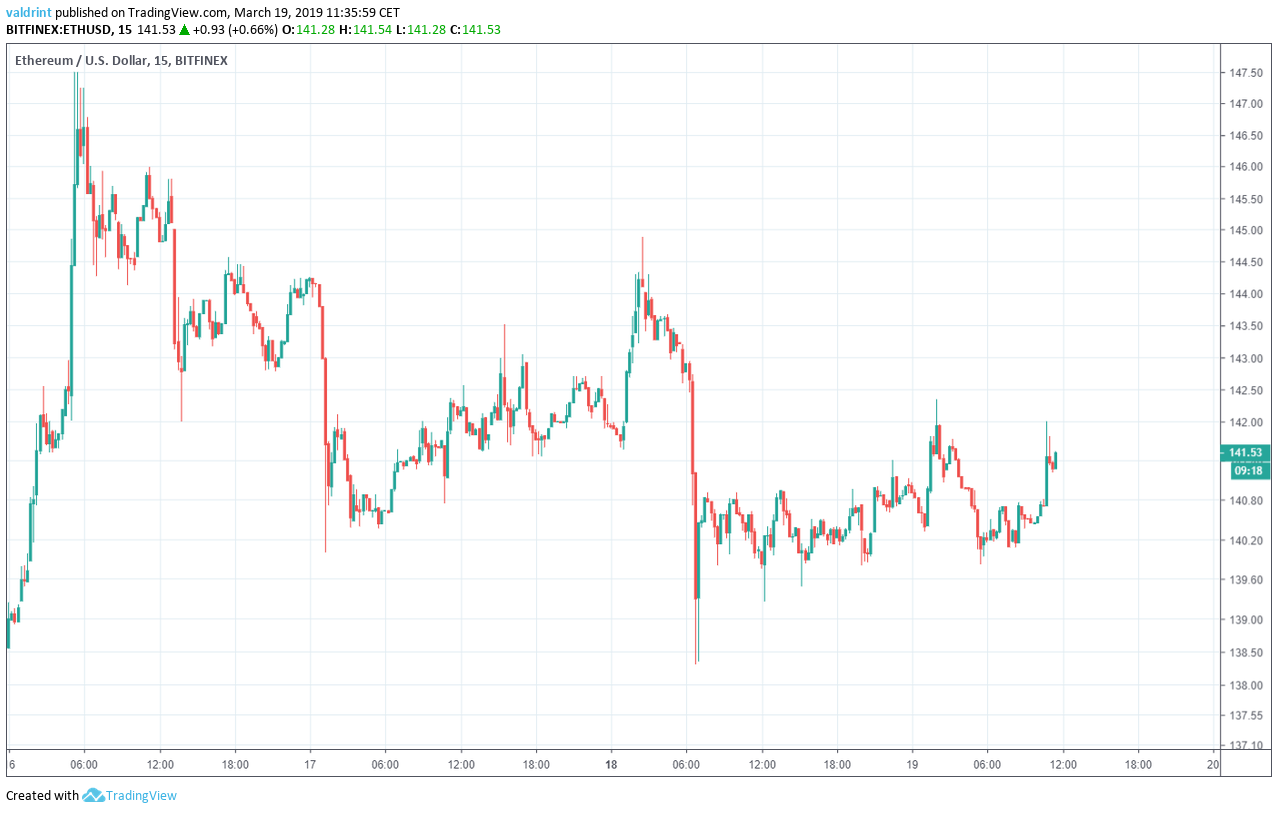
First, take a look at Ethereum’s prices between Mar 16 and 19:
In our Mar 18 analysis of ETH, we predicted that a slight decrease in the price is expected before price increases lead to a breakout above resistance, Since that time, ETH has traded within the channel we defined. Prices have again near resistance.
Based on today’s analysis, we believe Ethereum’s price could drop back down to support. However, if price increases continue, a breakout from resistance appears likely. It is possible, as well, that a breakout above the resistance could precede a drop back toward support.
Key Highlights For March 19
- The price of Ethereum (ETH) has been on a downward trend since March 16.
- ETC has been trading inside a short-term descending channel.
- There are resistance areas near $153 and $145.
- There are support areas near $134 and $128.
- There is bullish divergence developing in the RSI.
Tracing Support
The price of ETH on Bitfinex was analyzed at fifteen-minute intervals from Mar 16 to Mar 19.
On Mar 16, the price of ETH reached a low of $141.51. A sharp upward move occurred, followed by a gradual decrease. Several market cycles were completed. Each dip was lower than the last. Tracing these lows gives us a descending support line.
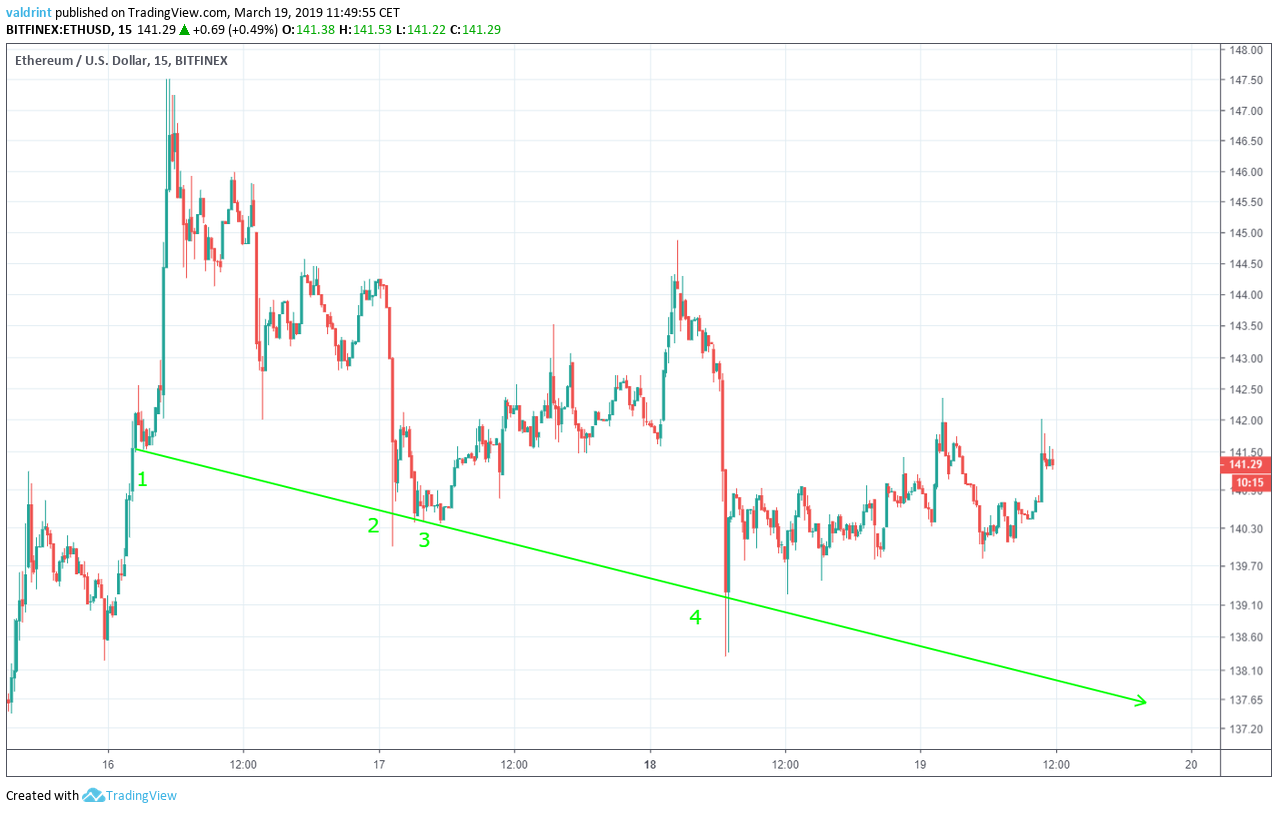
The support line can act as a floor to price. It theoretically traces the lower limits of the price, preventing further downward movement. It also gauges the rate at which price is decreasing.
Ethereum’s price has decreased at the same rate as predicted by the descending support—despite making several highs well above the line since Mar 16. Movement above the support, however, has been seen since Mar 18.
This pattern of growth, however, appears similar to that which occurred on Mar 17 before a rapid drop back toward support. It is possible that ETH will again make a high before a rapid price decrease. To better assess this possibility requires an analysis of resistance.
Descending Channel
Price reached a high of $147.5 on Mar 16. A gradual decrease in price followed as evidenced by the support. During this decrese, price made two lower highs. Tracing these highs gives us a descending resistance line.
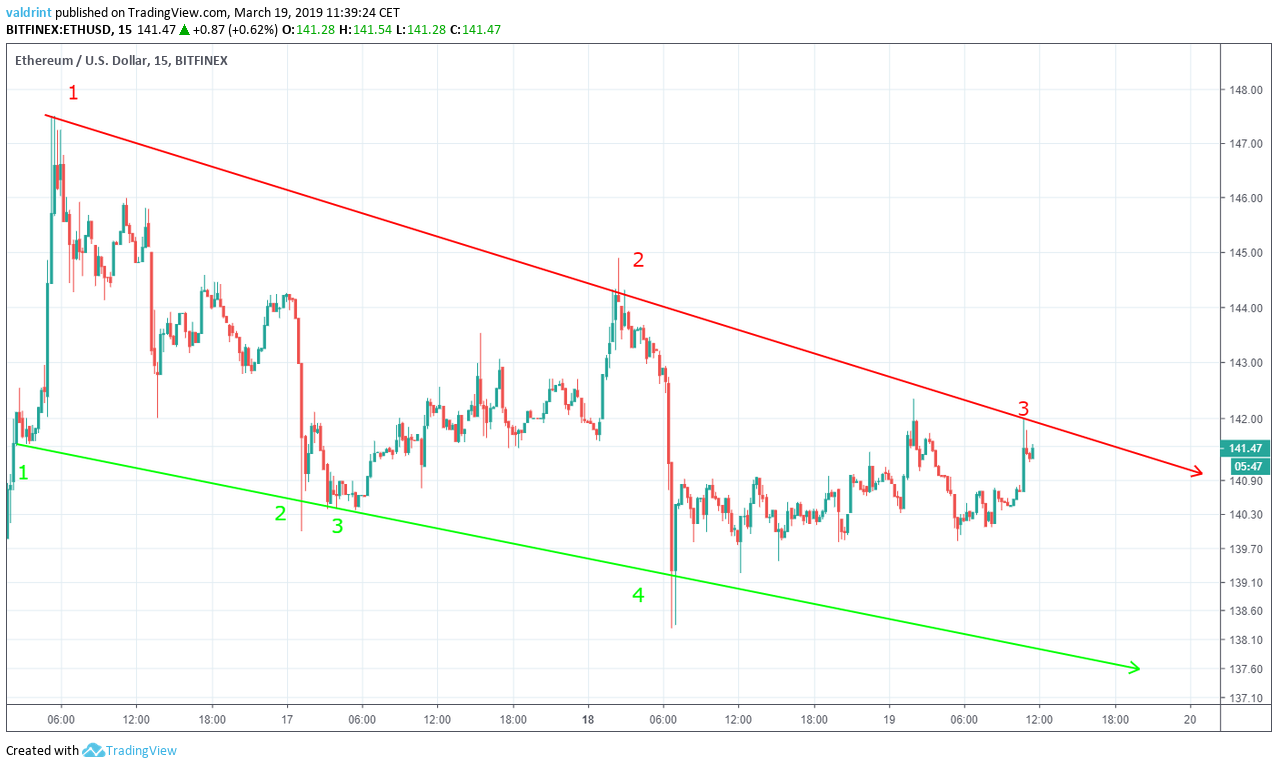
Similar to the support line, the resistance line can act as a ceiling to price. It should theoretically trace the upper limits of price over a period of time.
The support and resistance lines combine to create a parallel descending channel which is considered a neutral pattern. However, the downward trend of the channel suggests gradual future price decreases.
The price is currently right on the resistance line of the channel. After reaching the resistance on Mar 16 and 17, rapid price decreases brought the price back to the support. If the price drops back toward support without a significant breakout above the support, the developing pattern seen over the last few days will be validated. After hitting support, we could expect a gradual rebound toward the resistance.
Based on this channel alone, we cannot determine how long this pattern may continue if validated. We can only project gradual losses as price moves within the confines of the channel.
Divergence
Combining the relative strength index (RSI) bullish/bearish divergence with support/resistance essentially predicts future price fluctuations. RSI is an indicator which calculates the size of the changes in price in order to determine oversold or overbought conditions in the market.
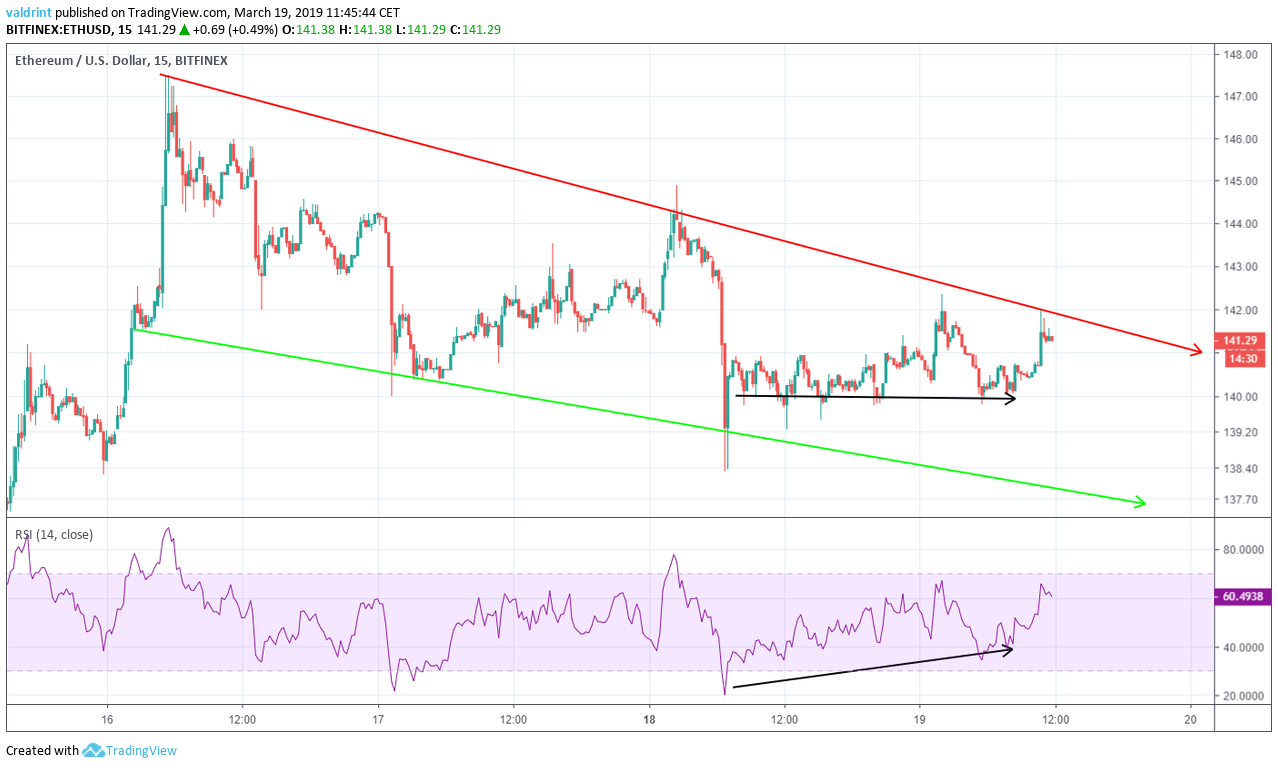
The price made a low of $139.79 on Mar 18. Since, it has revisited the same level several times.
Similarly, the RSI made the first low on Mar 18. However, it has continued to make higher lows since.
This is known as bullish divergence and often precedes price increases.
However, it is not very in amount and it has occurred in a neutral trading pattern.
Based on this pattern and indicator, it is possible that the price will break out of the channel on this attempt. This possibility, however, does not appear very significant. On the contrary, downward movement toward the support seems more likely at this time.
Resistance and Support Areas
The price of ETH on Bitfinex was analyzed at two-hour intervals from Feb 18 to Mar 18 to determine possible future resistance and support areas in the case of a breakout or breakdown situation. We must stress that while we are assessing future price increases and decreases as a possibility, predicted movement within the channel would likely impede these highs or lows from being reached in the near future.
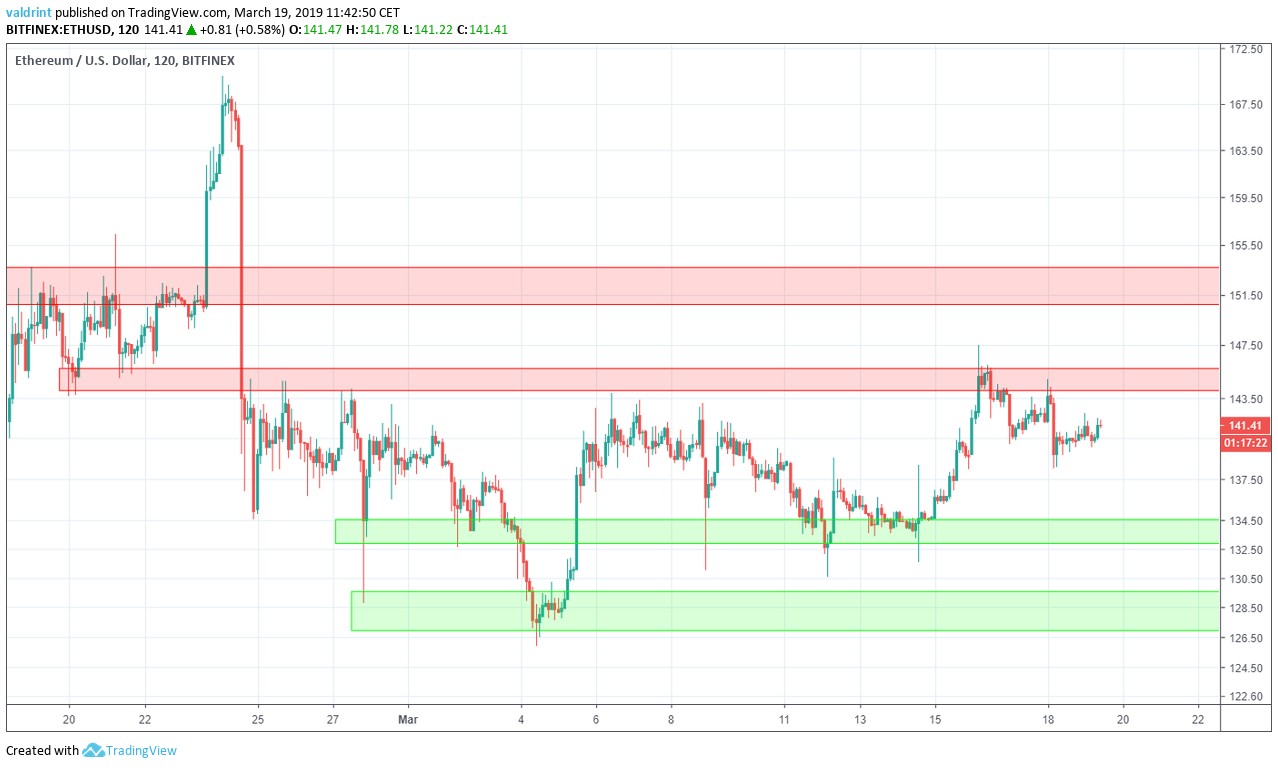
Resistance and support areas are created when the price revisits the same level several times.
The first resistance area is located near $145. It was validated when an unsuccessful breakout attempt occured on Mar 15. A second resistance area is found near $153. If the price were to break out of the channel, these two would provide likely reversal areas. This means that a sudden breakout above the resistance line may lead to prices of $144 or $153.
The closest support area is found near $134, with the second being found at $128. According to our analysis, it is unlikely that the price will reach this level in the near future.
Summary of Analysis
Based on this analysis, the price of ETH may break out of the channel. However, if the pattern we’ve observed holds true, prices should decrease on Mar 19. They should subsequently reach the support and a graudal increase should commence on Mar 20 or 21.
Do you think a breakout is coming in the next day or will Ethereum keep trading within the confines of the channel? Let us know your thoughts in the comments below.
Disclaimer: This article is not trading advice and should not be construed as such. Always consult a trained financial professional before investing in cryptocurrencies, as the market is particularly volatile.


