


Key Highlights For March 12, 2019
- The price of Ethereum (ETH) has been on a downward trend since Mar 5.
- It has been trading inside a parallel channel
- There are resistance areas near $153 and $145.
- There is a support area near $126.
- There has been bullish divergence developing.
- The MACD and SMAs triggered a buy signal.
Descending Resistance Line
The price of ETH on Bitfinex was analyzed at 30-minute intervals from Mar 5 to Mar 11.
On Mar 6, the price of ETH reached a high of $143.83 — the highest price recorded during the week.
Prices began to decrease slowly. Several market cycles were completed between Mar 4 and 11 with each high being lower than the last. This creates a series of descending highs which combine to create the descending resistance line.

The resistance line can act as a ceiling to price, preventing further upward movement. It is also a sign of the trend during the same period.
Wick breakouts such as the one on Mar 8 can be considered insignificant if not succeeded by sustained gains.
Currently, the price of ETH is trading very close to the resistance line and descending at around the same rate projected by the resistance line. Prices may continue to decrease following this line.
The downward trend for ETH may be a market response to its prior rapid increases. It is not yet clear how long these decreases may last.
Previous Triangle
The price of ETH on Bitfinex was analyzed at one-hour intervals from Mar 5 to Mar 11.
The price made a low of $158.5 on Mar 5. It revisited the same level again on Mar 9. Tracing the lines corresponding to the closing prices of those intervals gives us a horizontal support line.
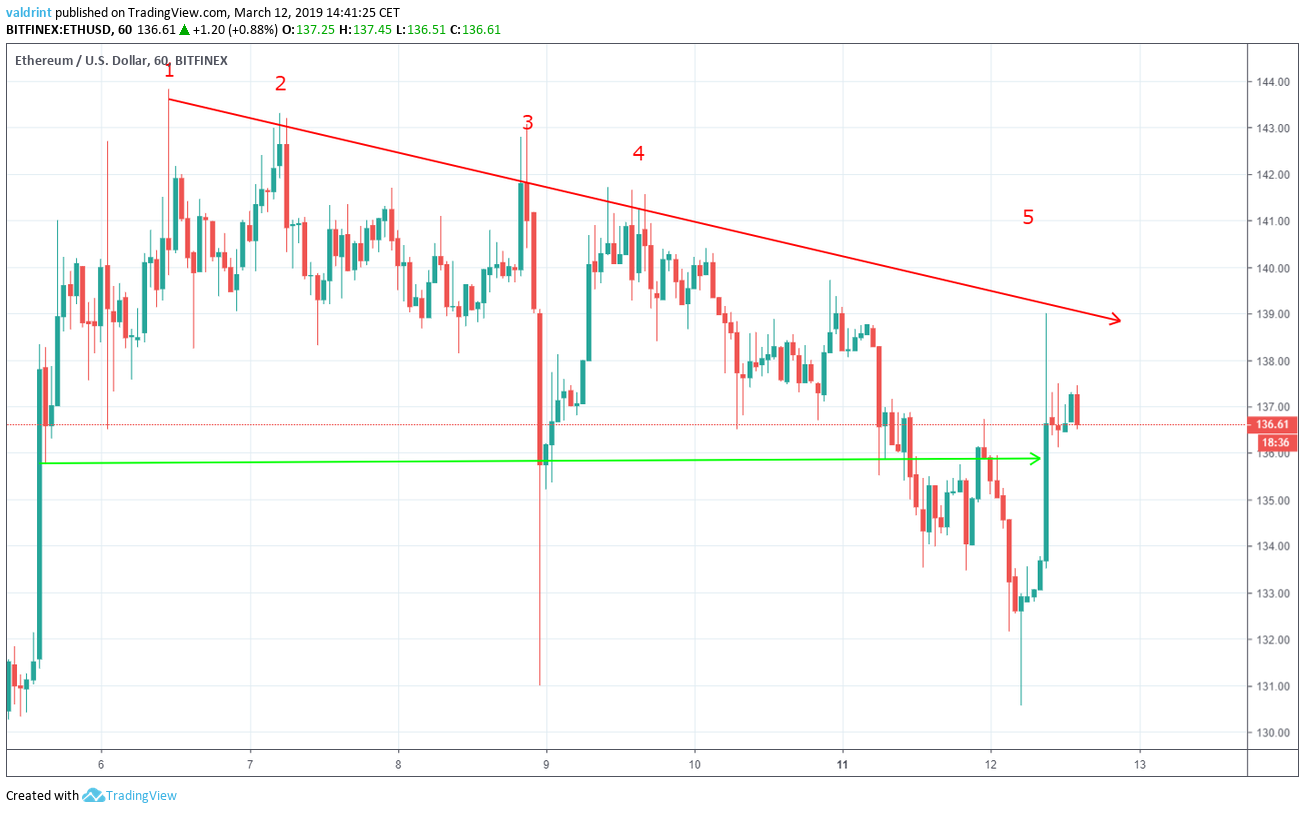
The support and resistance lines combine to create a descending triangle, which is a bearish pattern, making a price decrease more likely.
A breakdown below the support line could trigger a rapid price decrease. As predicted in yesterday’s analysis, the breakdown occurred on Mar 11.
Creation of a New Pattern
After reaching the Mar 6 high, a gradual decrease ensued. The price of ETH made a low of $131.0 on Mar 8. It made another low of $130.55 on Mar 12. Tracing the lines corresponding to the closing prices of those intervals gives us a descending support line.

The support line can act as a floor to price, preventing further downward movement.
Breakdowns below the support line by a wick in a volatile market are relatively unimportant as long as they are not supported by continued breakdowns. In the case of the ETH, 30-minute lows rarely broke below support and were not supported by maintained losses.
The support and resistance lines combine to create a parallel descending channel, which is a neutral pattern, making price increases and decreases equally likely.
This suggests that price may move inside the confines of the channel for the foreseeable future. Because the channel is moving downward, price decreases should continue. A breakdown below support would likely lead to more rapid and significant price decreases. A breakout above the support would represent a reversal resulting in price increases.
End of The Downtrend?
The moving average convergence divergence (MACD) is a trend indicator that shows the relationship between two moving averages (long and short-term) and the price. It is used to measure the strength of a move.
Combined with simple moving averages (SMA), MACD can be used as a trigger for buy and sell signals. Signals are triggered whenever the MACD line is above 0 and the price is above the 21 (red) and 50-period (green) SMAs.
The relative strength index (RSI) is an indicator which calculates the size of the changes in price in order to determine oversold or overbought conditions in the market.
Combining MACD and RSI bullish/bearish divergence with support/resistance essentially predicts price fluctuations.
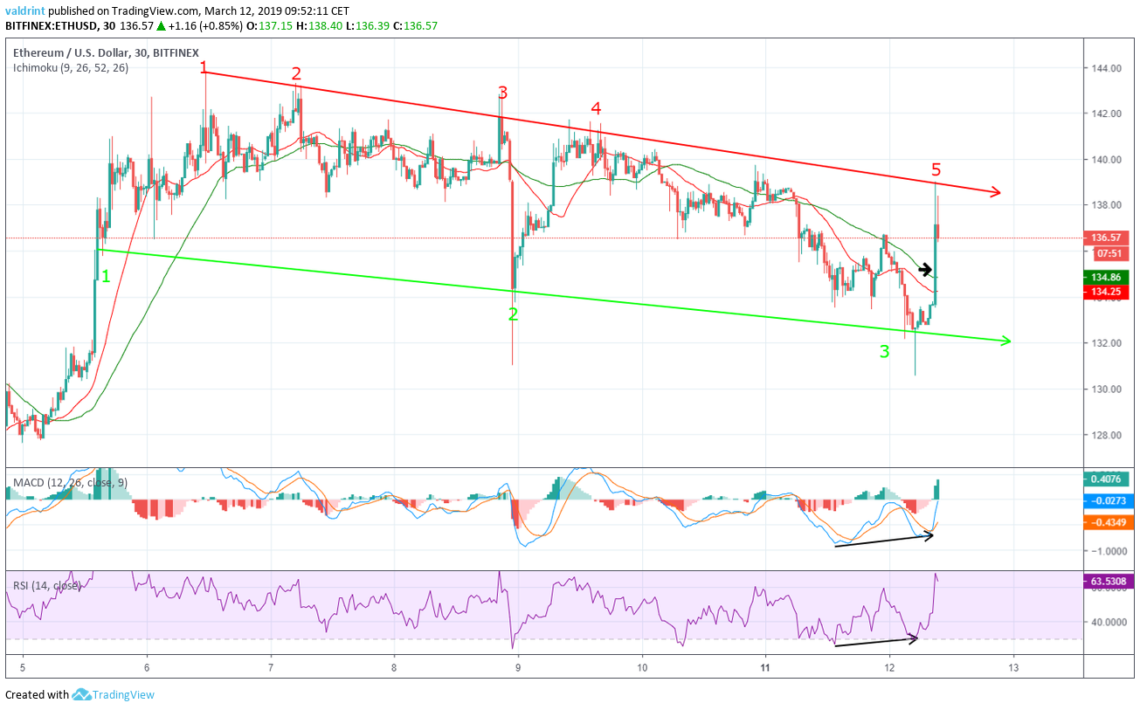
On Mar 11, the price reached a low. It made a lower low on Mar 12 at $130.55. These points generate a support line.
Similarly, the MACD and the RSI made lows on Mar 11. However, they continued to create higher lows on Mar 12.
This is known as bullish divergence and often precedes increases in price.
Furthermore, on Mar 12 the price moved past the 21 and 50-period moving averages. During the same interval, the MACD line crossed above 0.
This movement would have triggered a buy signal, initiating that an upward trend may be starting. It will be invalidated by a price movement below the SMAs and a MACD line cross below 0.
Using these indicators, it is more likely that the current downtrend may be nearing its end and price increases may be seen in the near future. A breakout and reversal may be forthcoming based on this analysis.
Resistance and Support Areas
The price of ETH on Bitfinex was analyzed at two-hour intervals from Feb 19 to Mar 11 to determine possible resistance and support areas during a breakout/breakdown situation.

Resistance and support areas are formed when the price reaches a certain level several times. They can act as a ceiling/floor that prevents the price from moving further in that direction.
The closest resistance area is found near $144, with higher resistance found near $153. If the price were to break out of the channel, these two would provide likely reversal areas. This means that a sudden breakout above the resistance line may lead to prices of $144 or $153.
The closest support area is found near $128. The price came very close to reaching this support on Mar 12 when it reached a low of $130.55.
Summary of Analysis
Based on this analysis, the price of ETH is likely to keep trading inside the channel, getting ready for a possible upward movement. If the price of ETH keeps trading above $134, close to the resistance line of the channel, this prediction may be partially validated. If it breaks out and reaches the resistance area near $144, it will be fully validated.
What do you think will happen to the price of ETH? Is a breakout coming soon? Let us know in the comments below.
Disclaimer: This article is not trading advice and should not be construed as such. Always consult a trained financial professional before investing in cryptocurrencies, as the market is particularly volatile.


