
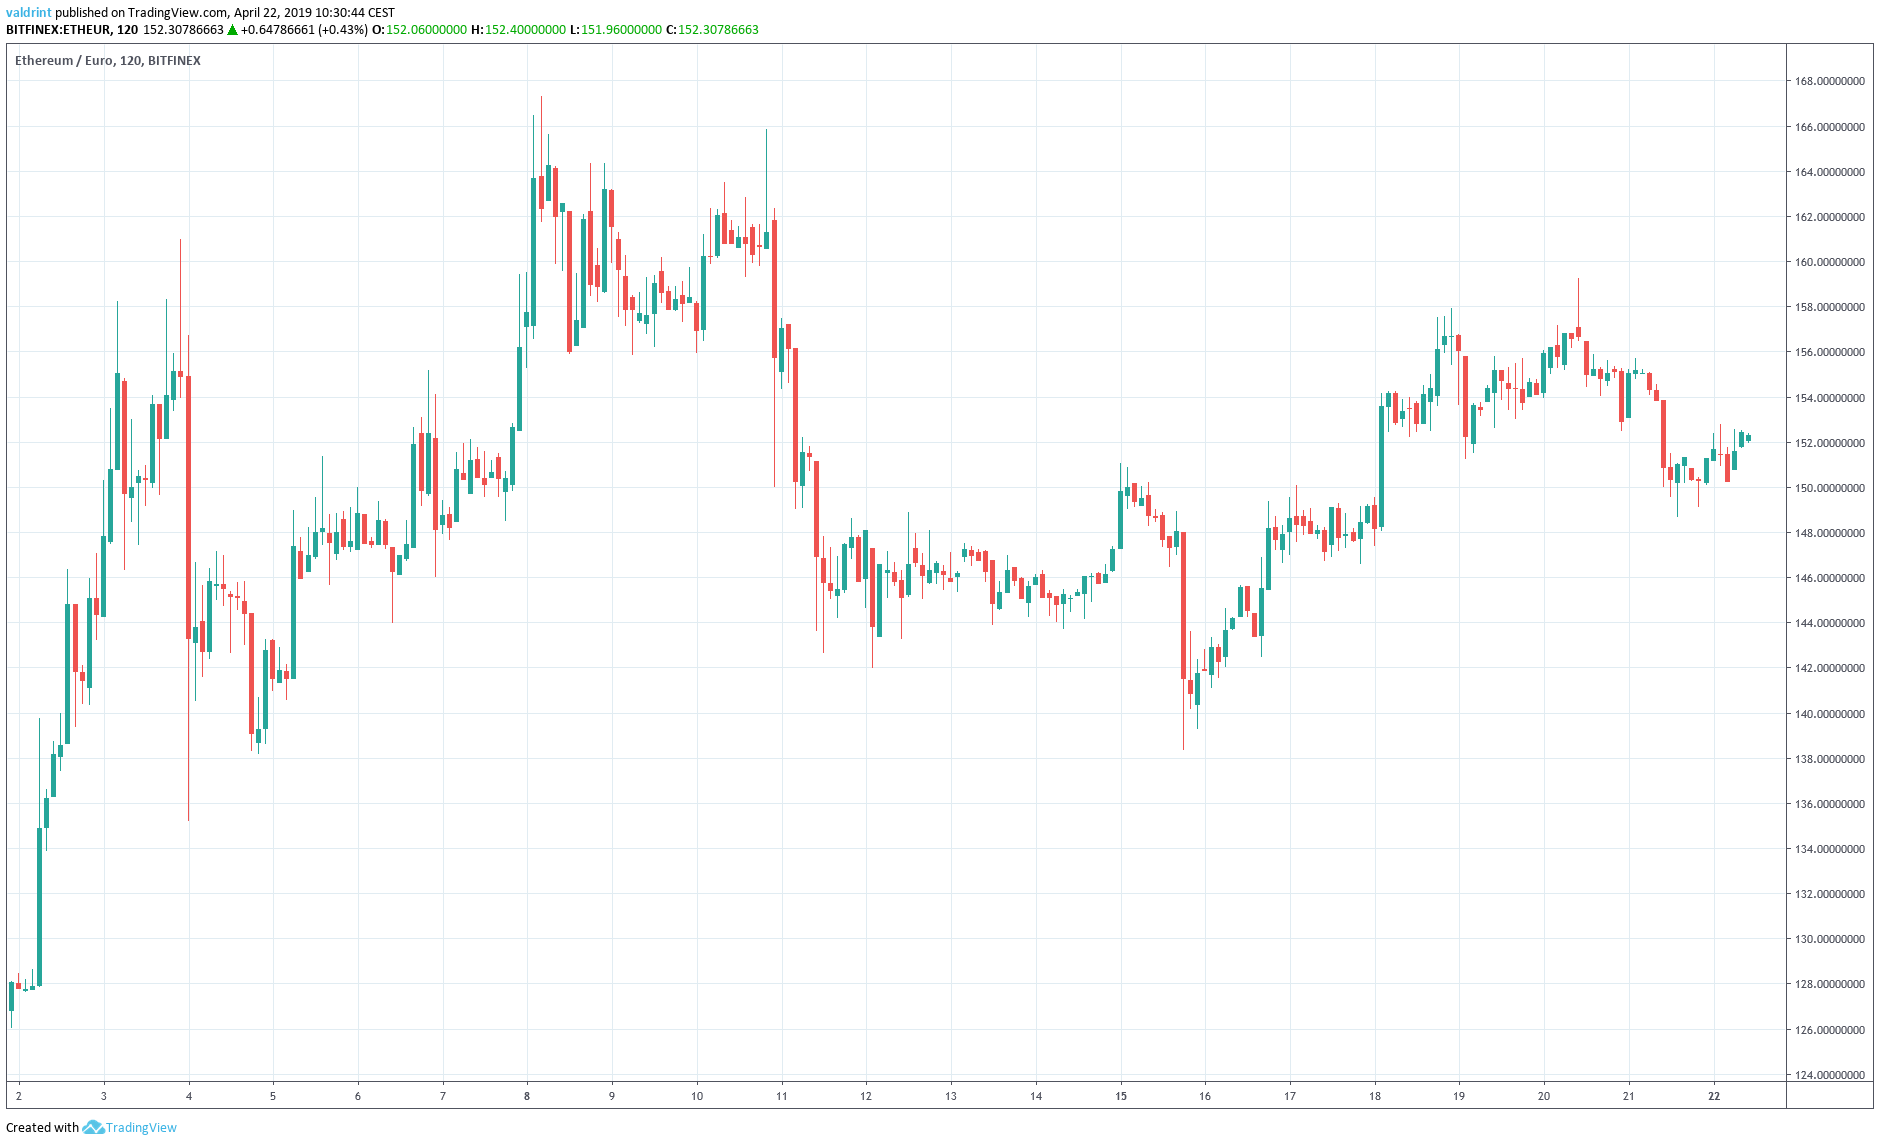
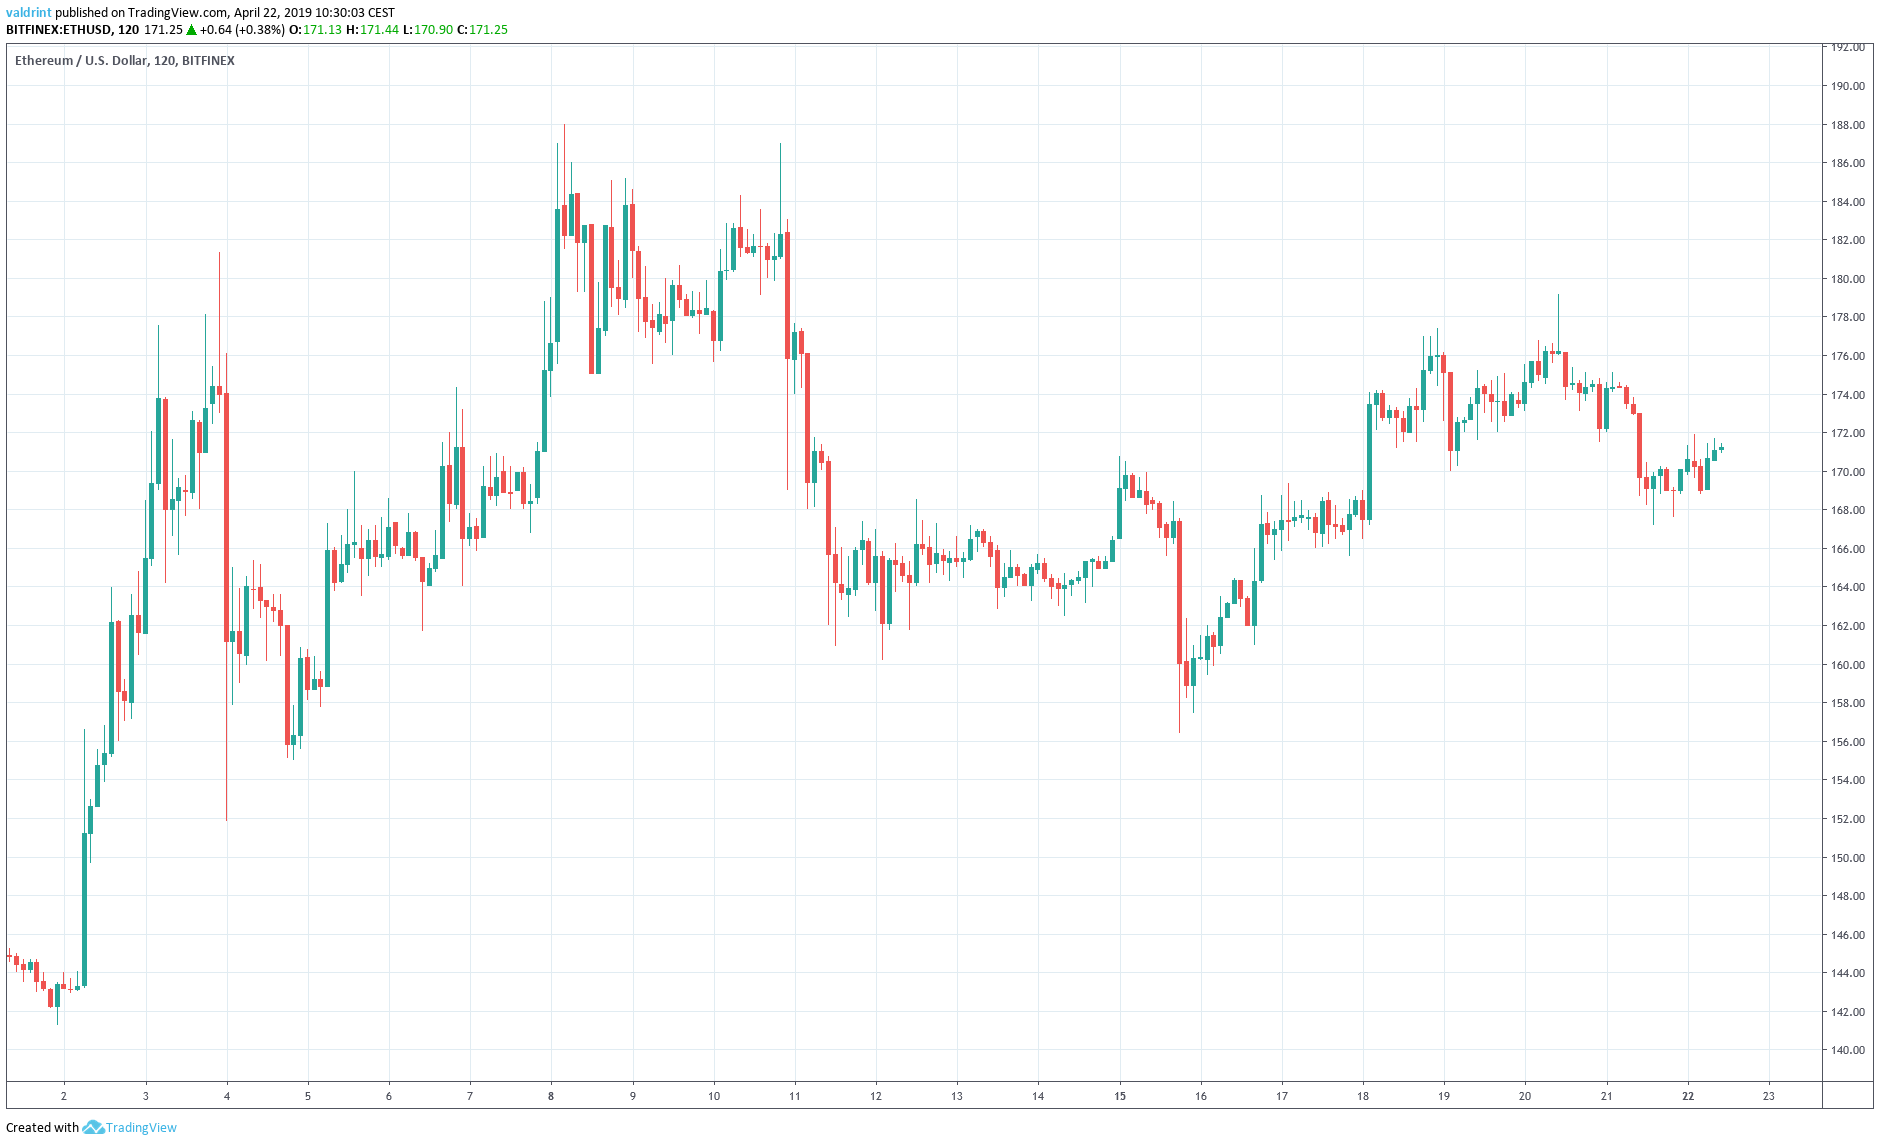
On Apr 8, 2019, the price of Ethereum (ETH) made a high of $187.98 & €167.32. A sharp drop followed. Lows of $156.42 & €138.36 were reached on Apr 15.
While the price of Ethereum is now higher than the lows of Apr 15, the price began dropping on Apr 18. Losses accelerated on Apr 21.
It appears as if prices have somewhat recovered since yesterday’s drop, but there is still room to grow.
Will the price of Ethereum recover from Apr 21’s drop or will price keep falling?
Let’s find out:
Ethereum (ETH): Trends and Highlights for April 22, 2019
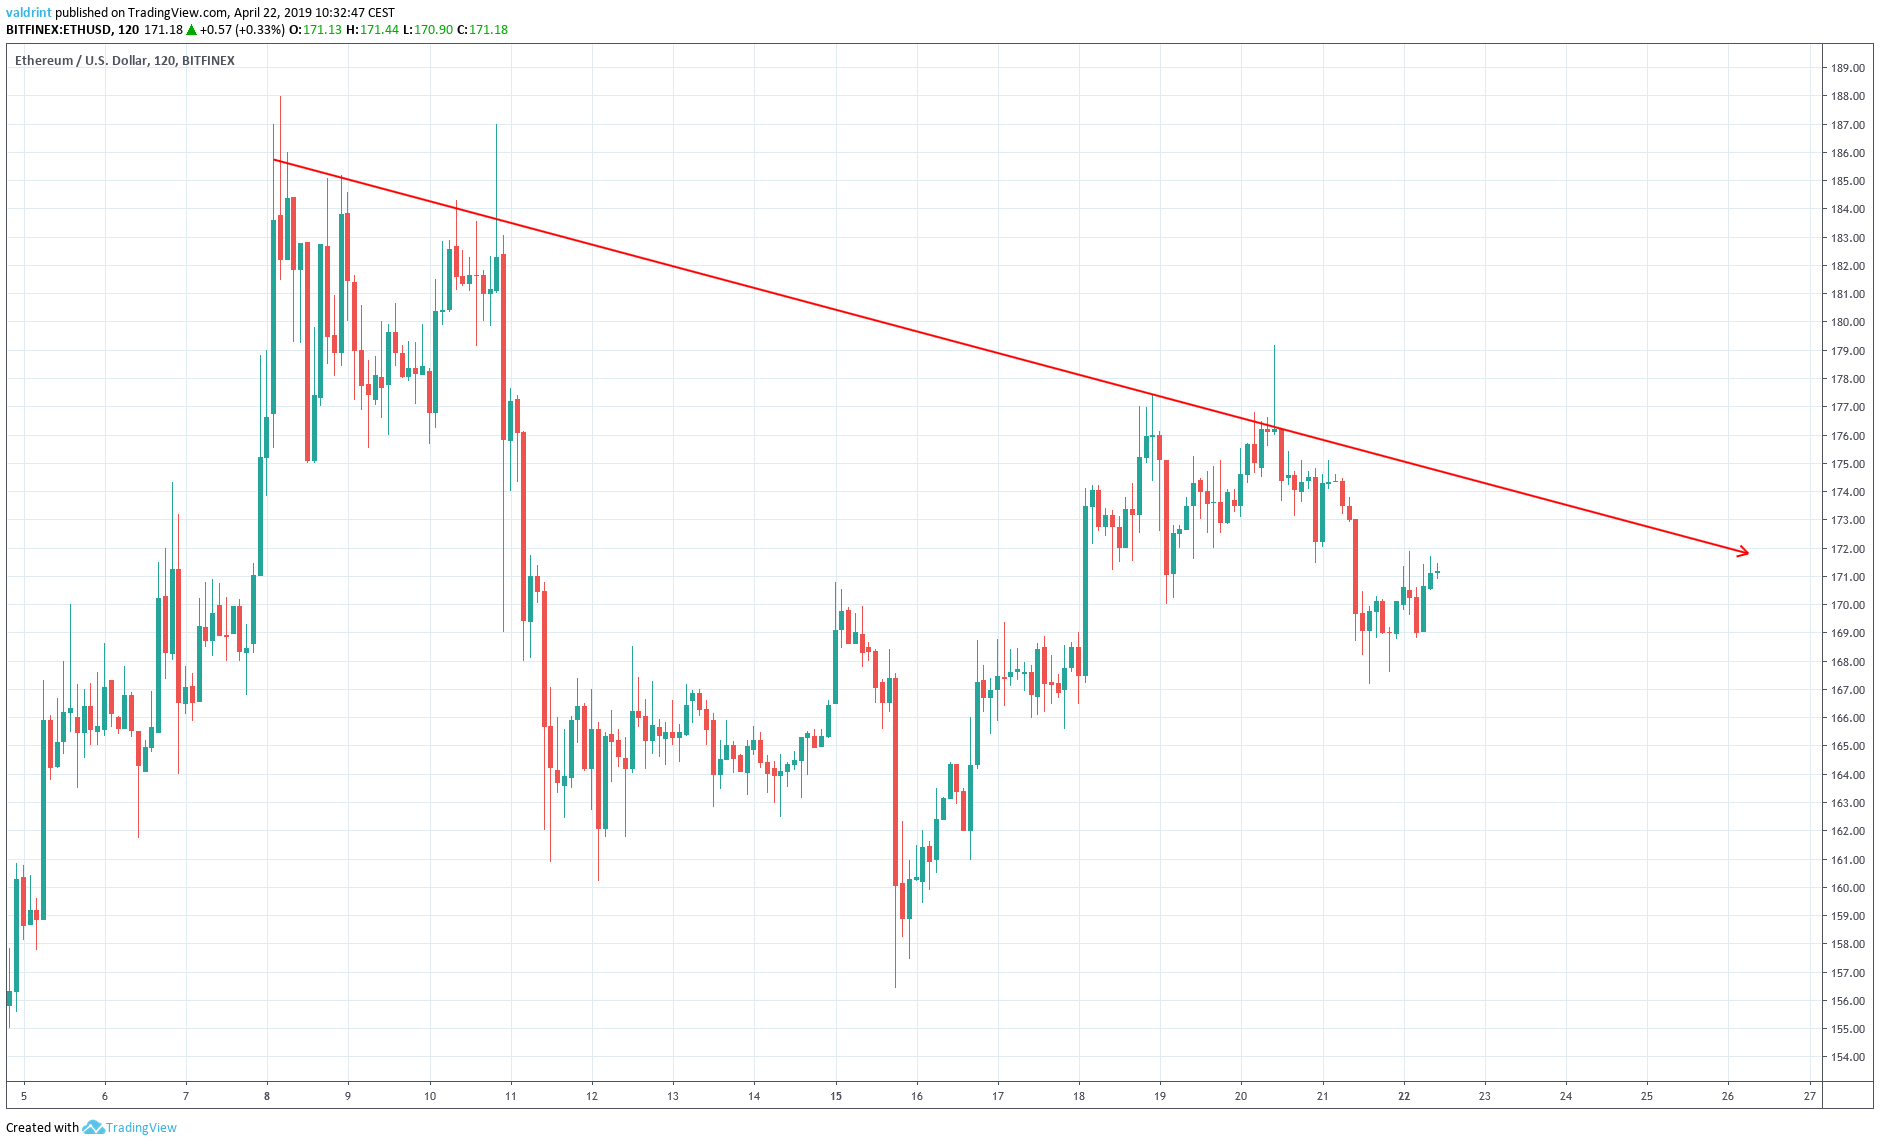
- The price of Ethereum has been on a downtrend since Apr 8.
- It is trading inside a descending channel.
- Bearish divergence is developing in the RSI and the MACD.
- There is support near $161 and €143.
Descending Channel
On Apr 8, Ethereum reached an hourly high of $187.78. A sharp decrease was followed by a gradual increase.
The price has made several lower highs. Tracing these highs gives us a descending resistance line:
On Apr 6, the price reached a low of $161.71. Several market cycles have been completed and the price has created lower lows each time. Tracing these lows gives us a descending support line.
The support and resistance lines combine to create a descending channel:
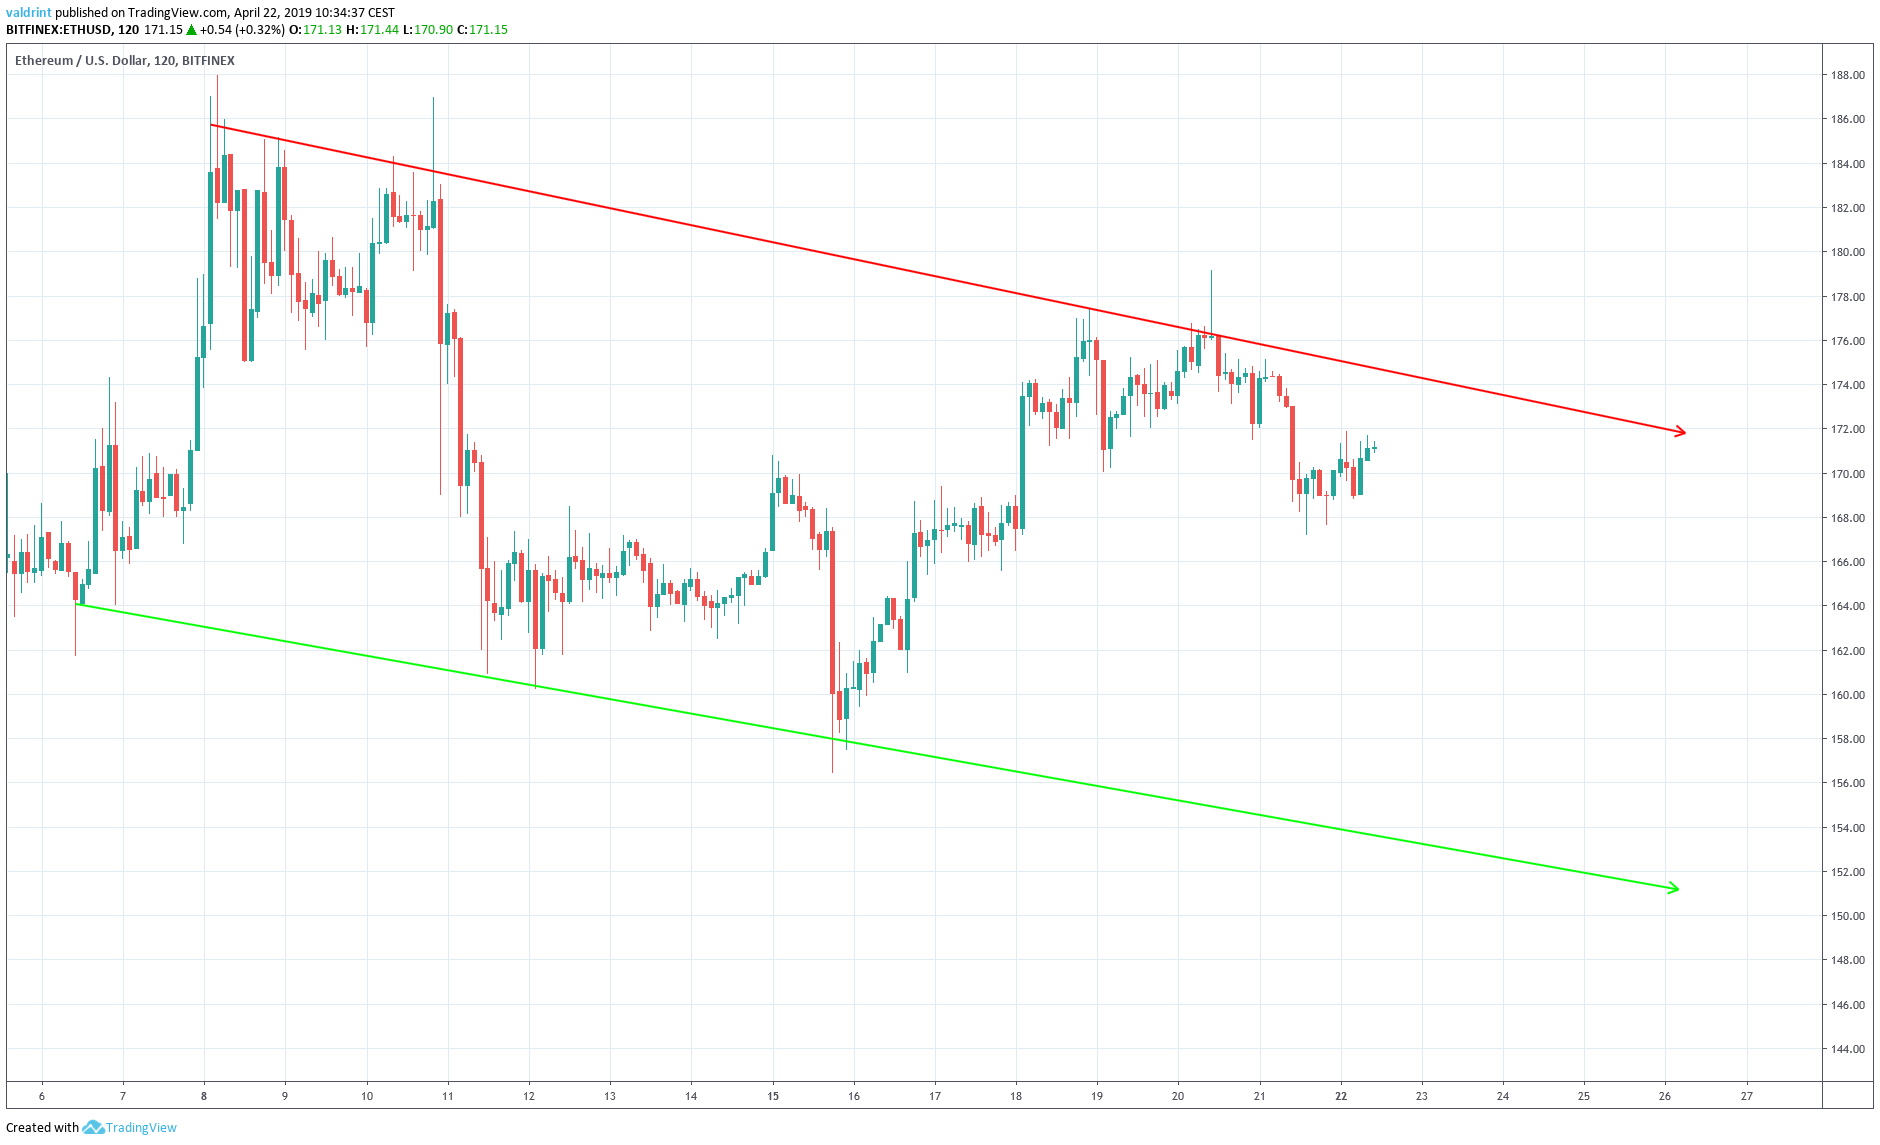
It is likely that the price will trade inside the confines of the channel until a decisive move occurs.
To predict the direction of the move, we need to take a look at technical indicators.
Technical Indicators
Combining RSI bullish/bearish divergence with support/resistance essentially predicts price fluctuations.
They are shown in the chart below:
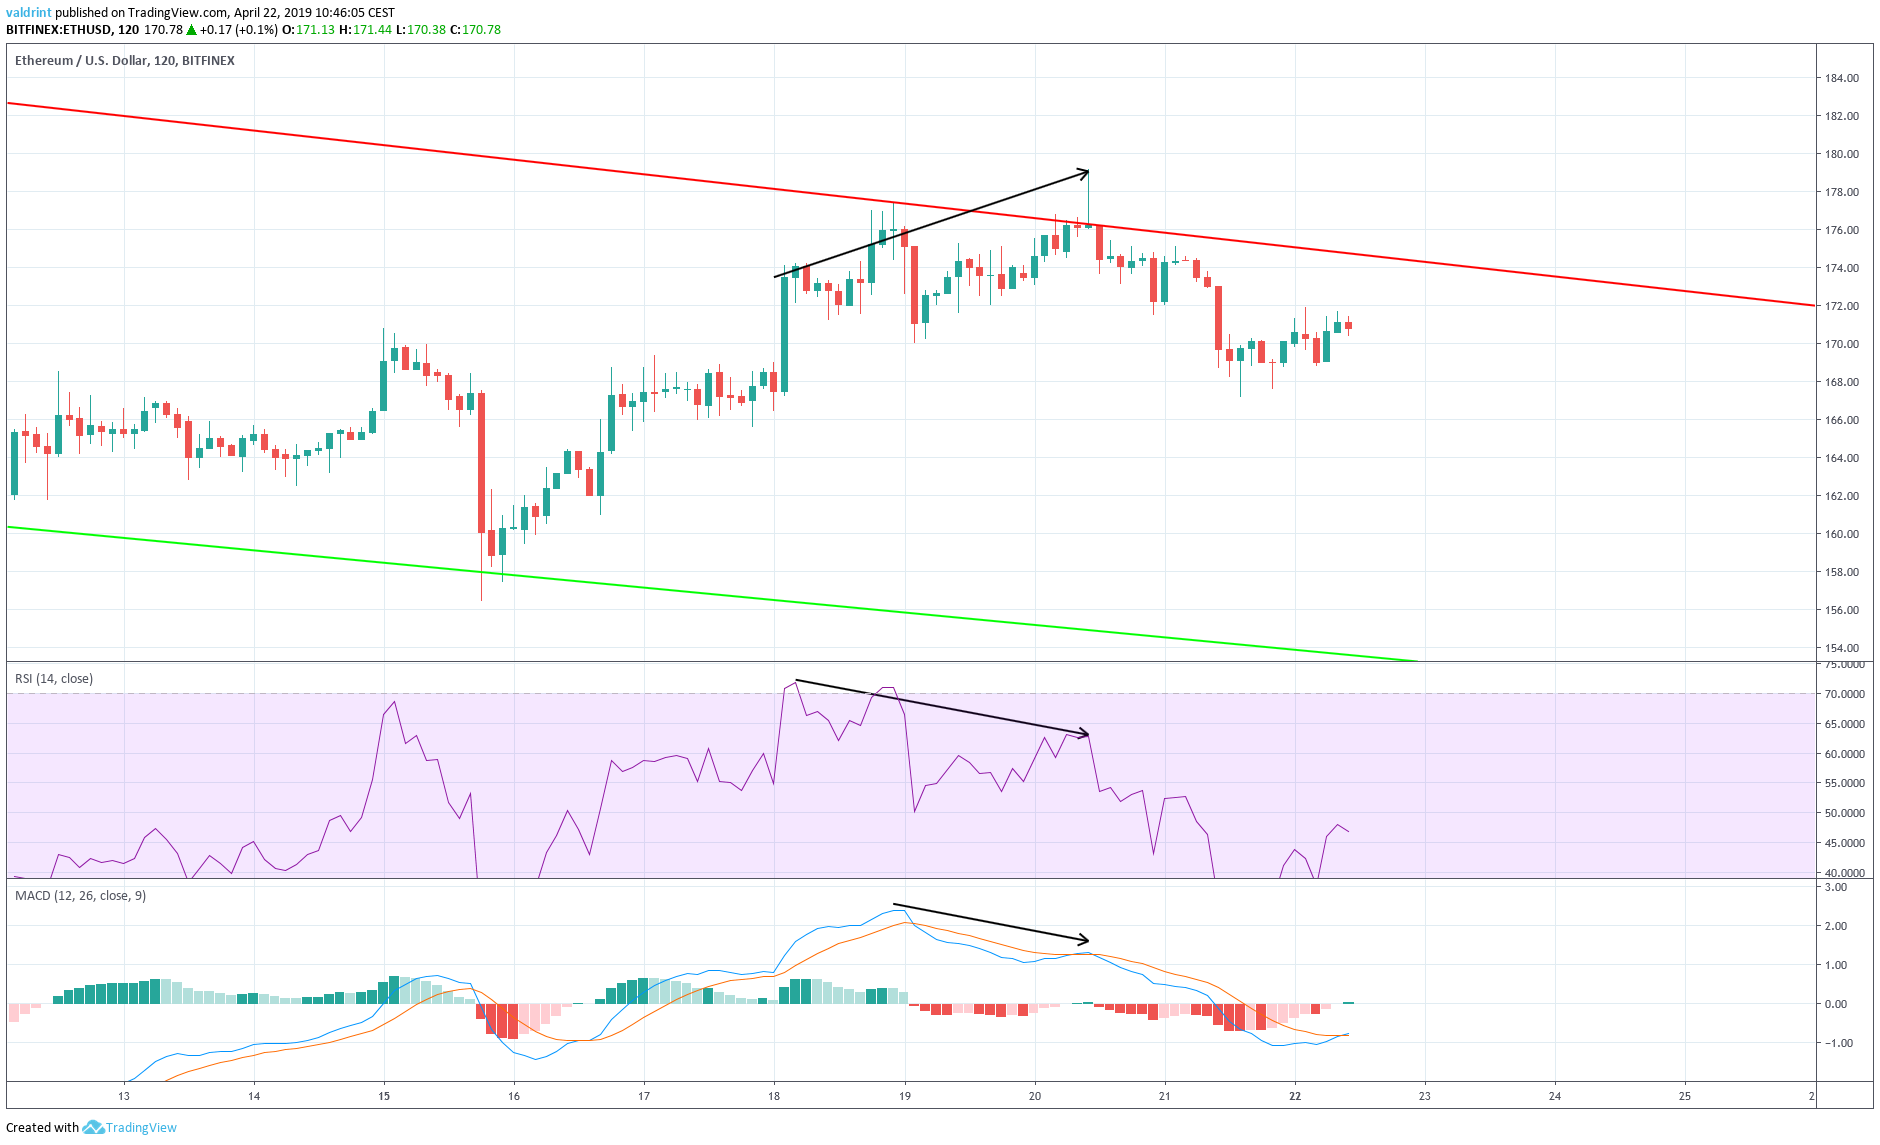
On Apr 18, the price made a high of $174.10. It continued to make higher highs on Apr 19 and 20, culminating at $179.17.
Similarly, the RSI and the MACD made the first high on Apr 18. However, they continued to generate lower values.
This is known as bearish divergence and often precedes price decreases.
Using these indicators, it is likely that the price will fall down to the support line of the channel.
Reversal Areas
To determine possible price levels following a decrease, we continue with an analysis of support areas.
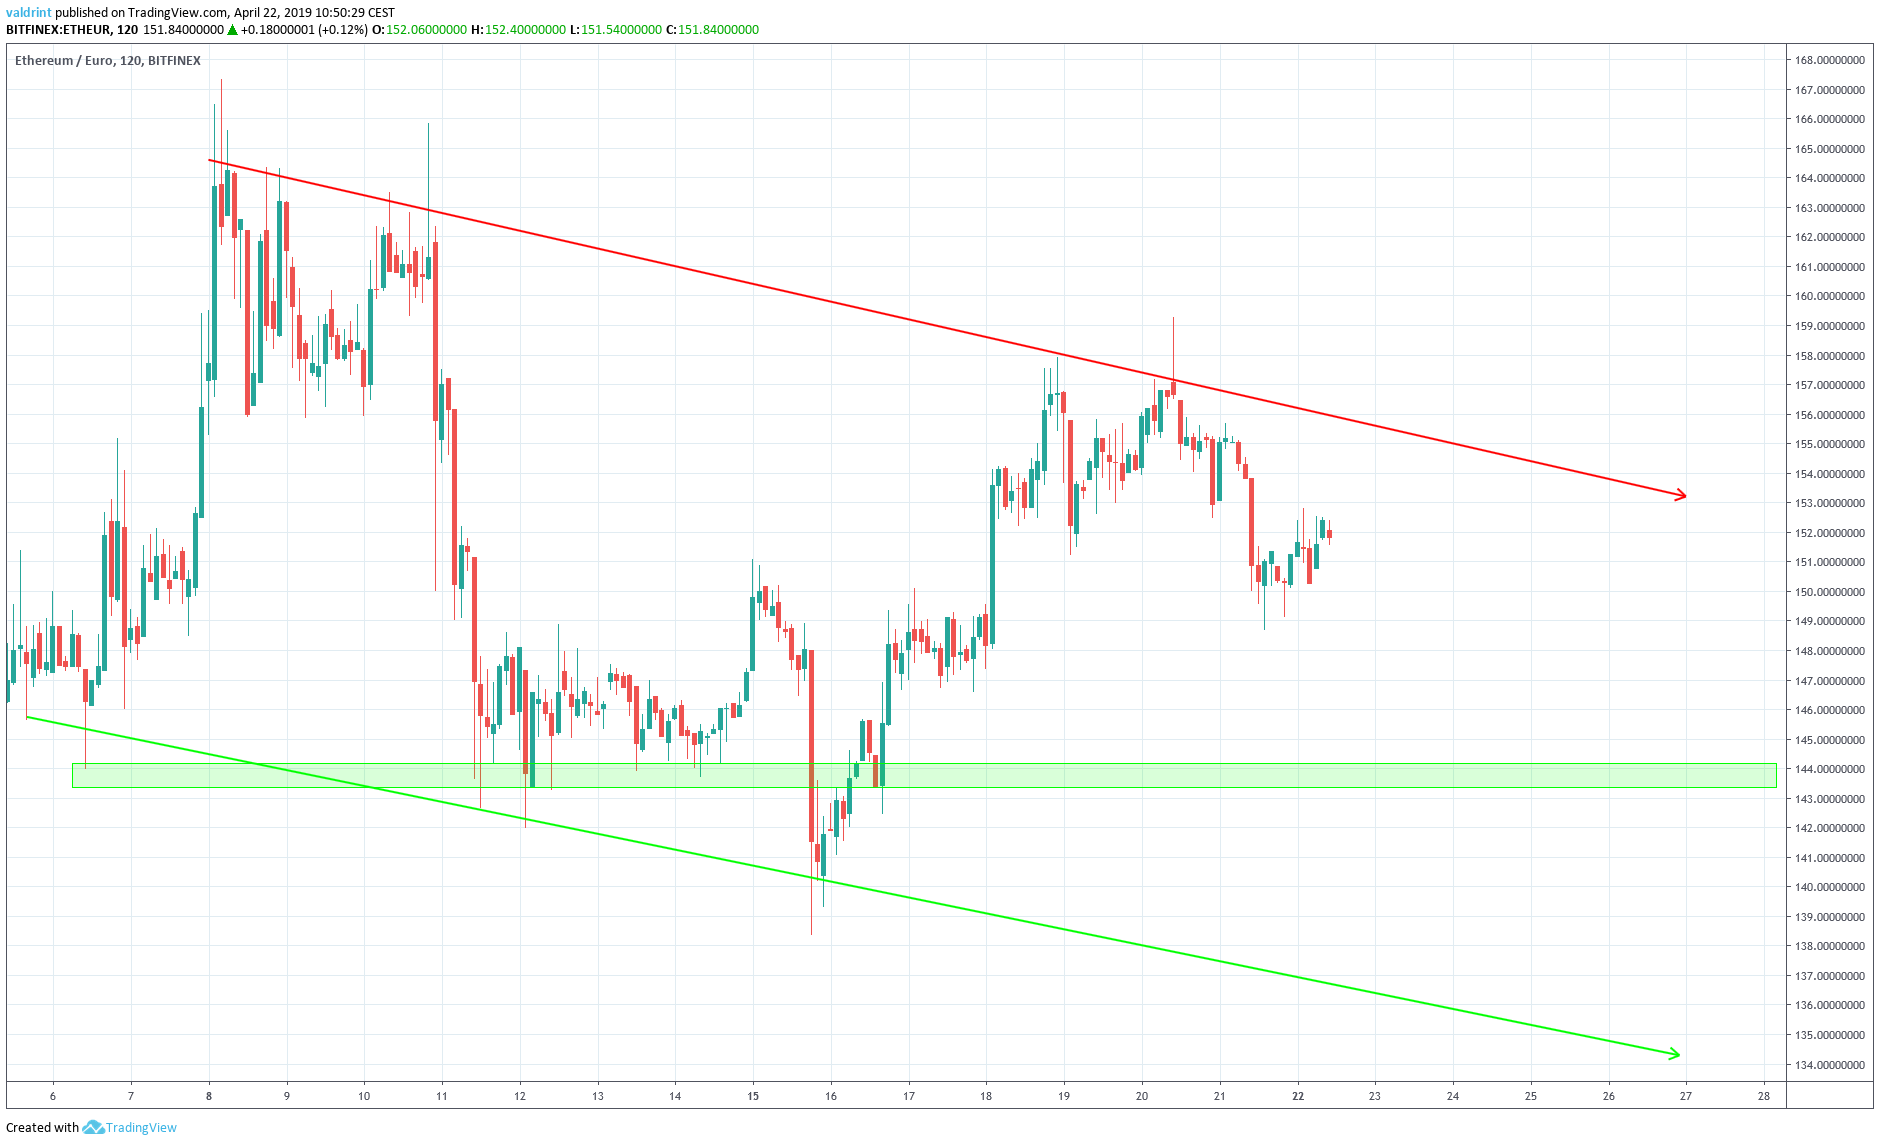
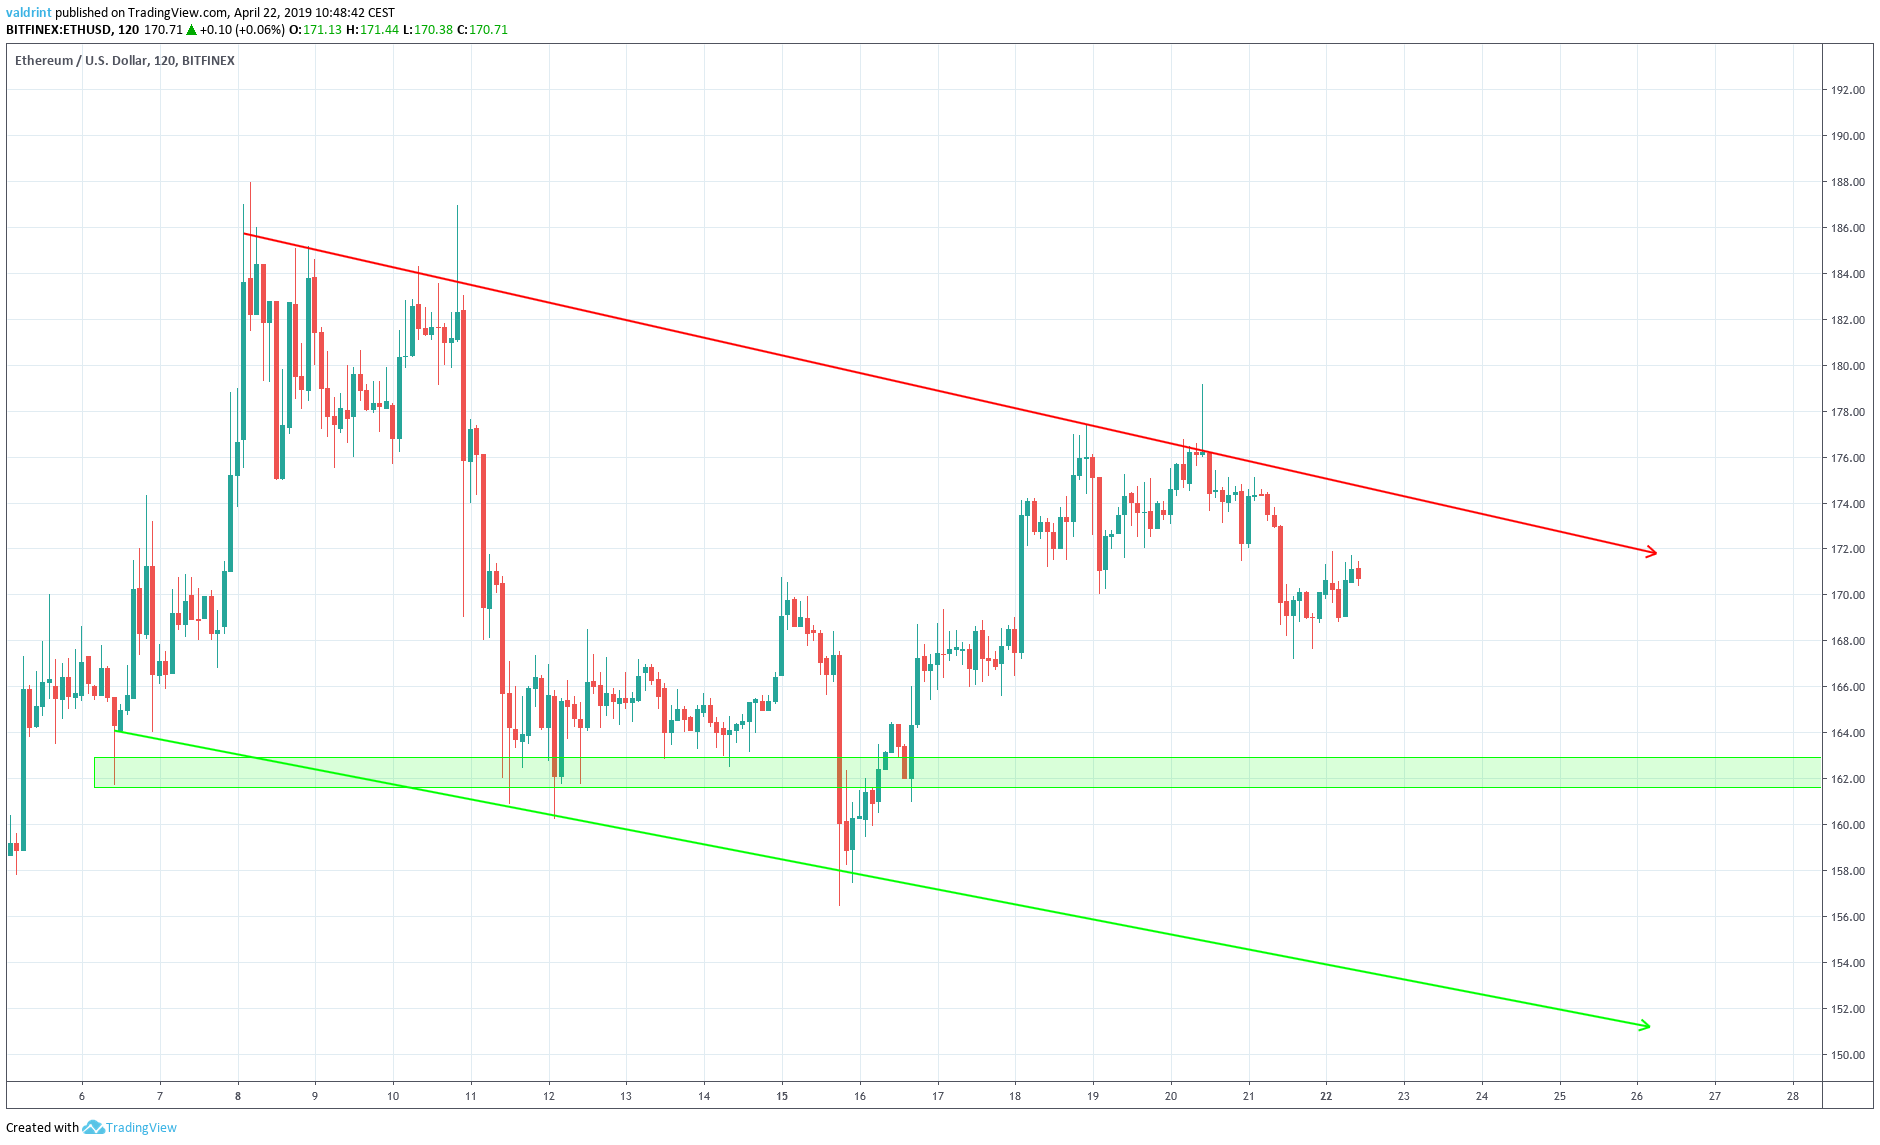
The closest support area is found near $161 and €143 and is found within the current trading pattern. Price is likely to decrease to this level and possibly reach the support line.
Summary of Analysis
Based on this analysis, the price of ethereum is likely to decrease towards the support line of the channel. It is likely to reach the support area near $161 and €143 in the short-term. In such a case that prices fall below the support area and toward the support line, Ethereum may drop into the $150s and €130s.
To read 2019 and 2020 Ethereum price predictions, click on the green button below:
Do you think ETH will break down from the wedge? Let us know your thoughts in the comments below.
Disclaimer: This article is not trading advice and should not be construed as such. Always consult a trained financial professional before investing in cryptocurrencies, as the market is particularly volatile.
