
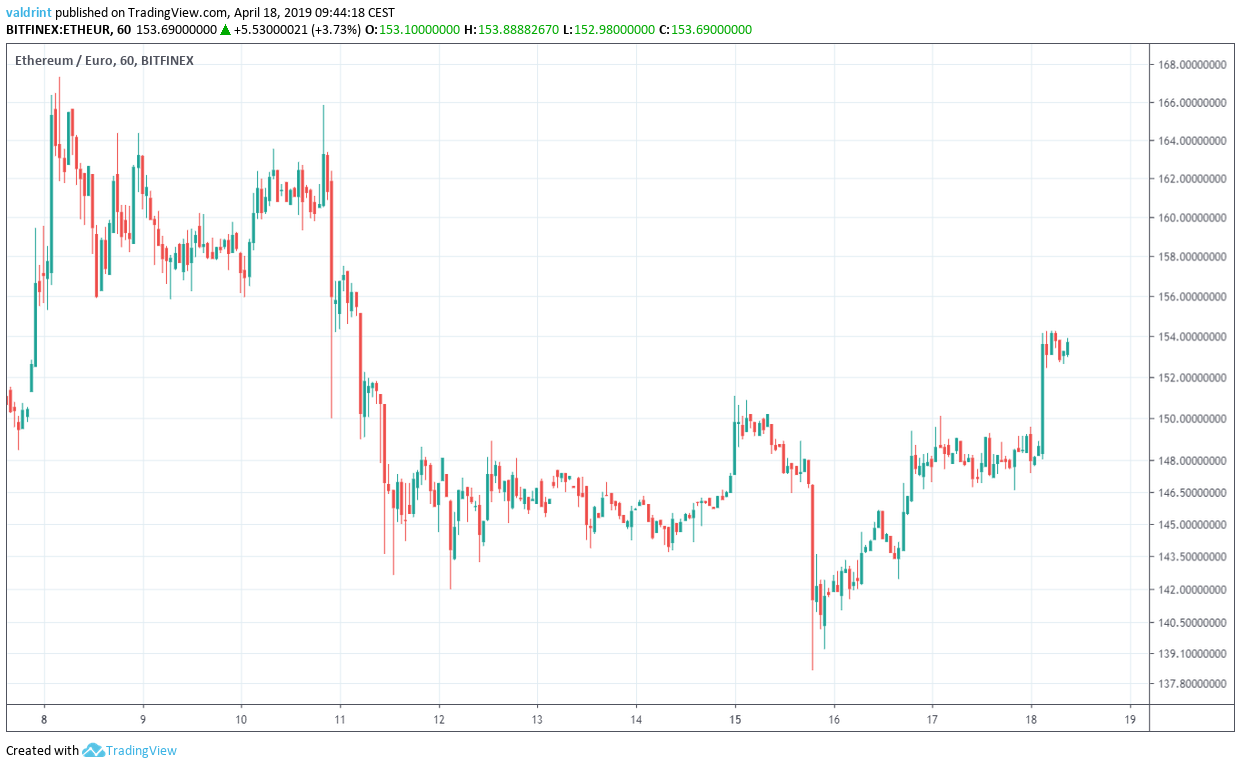
On Apr 8, 2019, the price of Ethereum (ETH) made a high of $187.98 & €167.32. A sharp drop ensued which took it to lows of $156.42 & €138.36 on Apr 15. It has been increasing since.
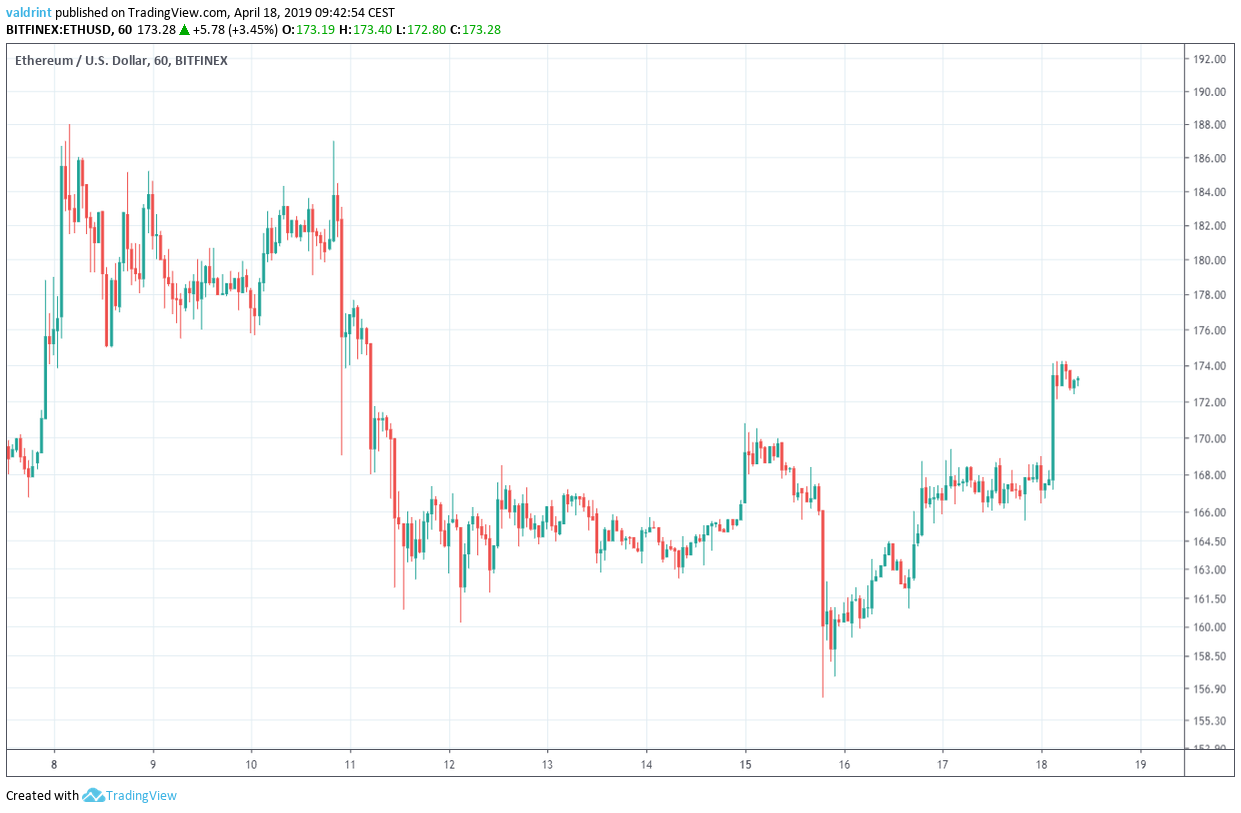
Will the price of Ethereum keep increasing or should we expect a reversal?
Let’s find out:
Ethereum (ETH): Trends and Highlights for April 18, 2019
- The price of Ethereum has been on a downtrend since Apr 8.
- ETH is trading inside an ascending wedge.
- Bearish divergence is developing in the RSI and the MACD.
- There is resistance near $175 and €155.
- There is support near $161 and €143.
Descending Wedge
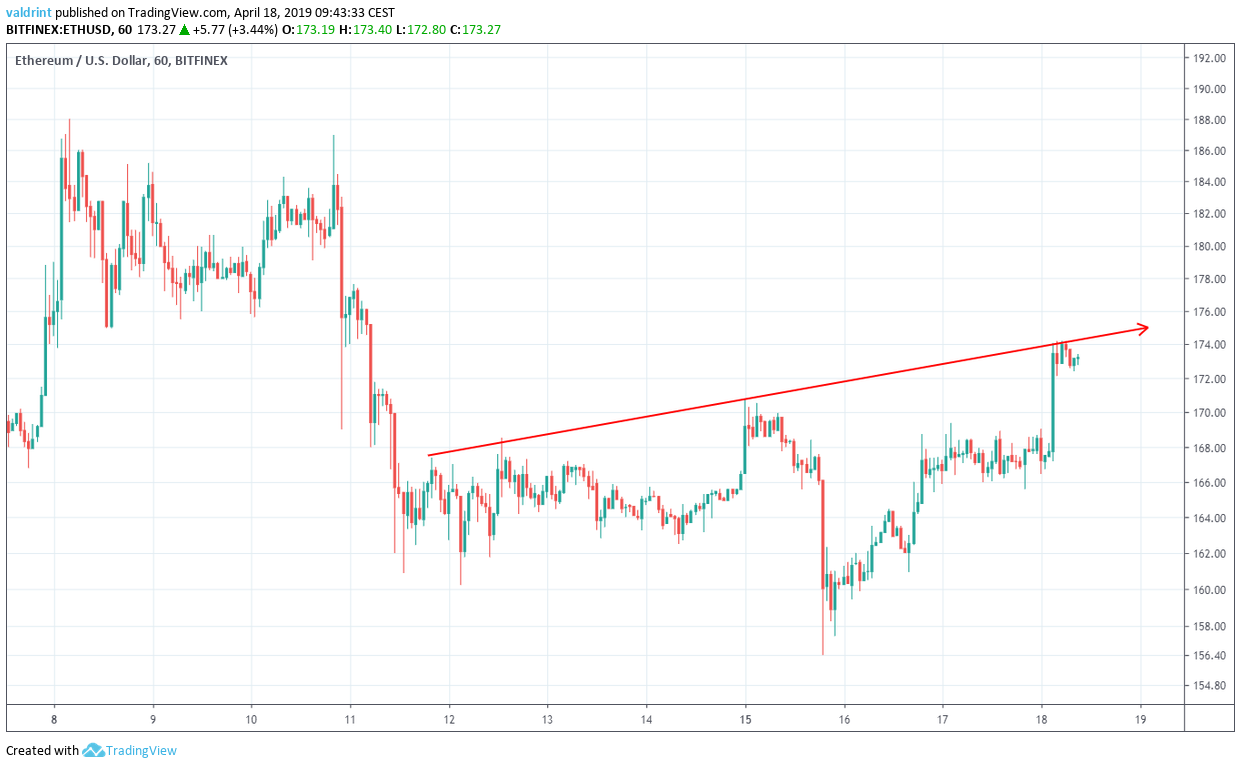
On Apr 1, Ethereum reached an hourly high of $167.37. It has been gradually increasing since.
The price has made several higher highs. Tracing these highs gives us an ascending resistance line:
On Apr 15, the price reached a low of $156.42. A gradual decrease ensued. The price has made several higher lows.
The support and resistance lines combine to create an ascending wedge:
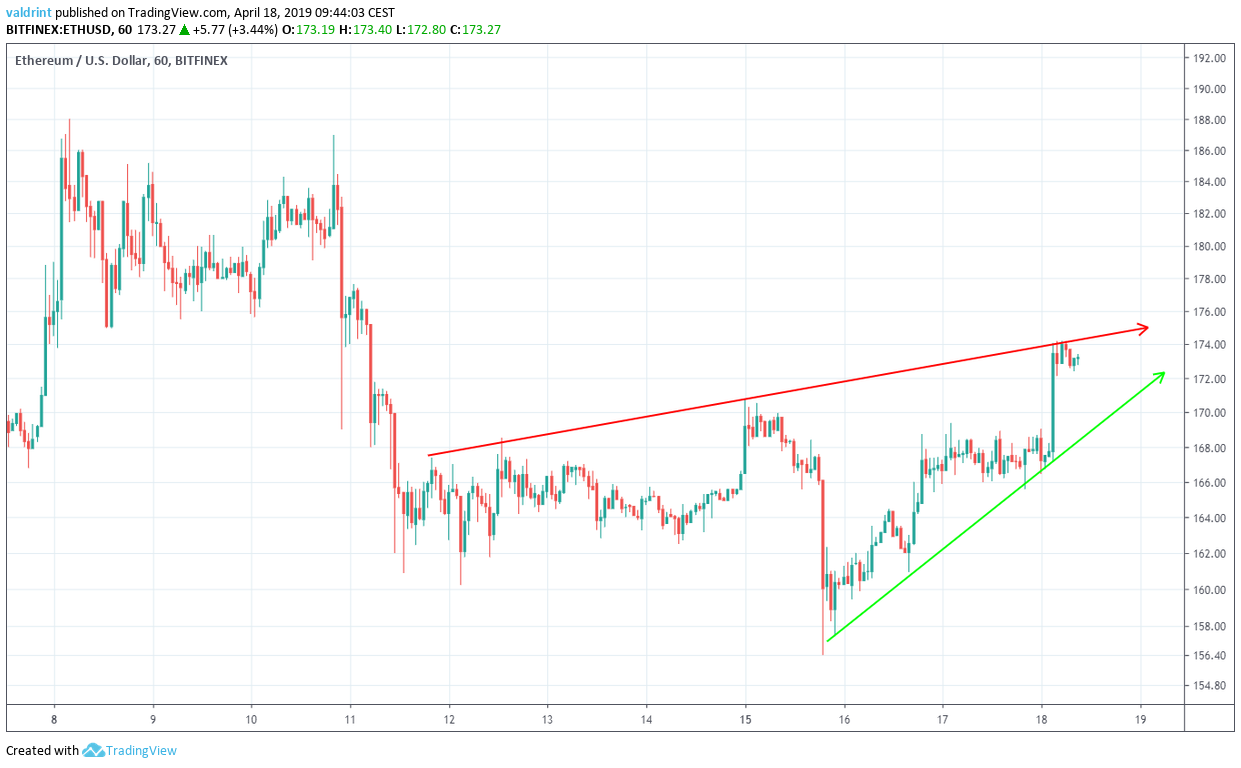
It is likely that the price will trade inside the confines of the wedge until a decisive move occurs.
To predict the direction of the move, we need to take a look at technical indicators.
Technical Indicators
Combining RSI bullish/bearish divergence with support/resistance essentially predicts price fluctuations.
They are shown in the chart below:
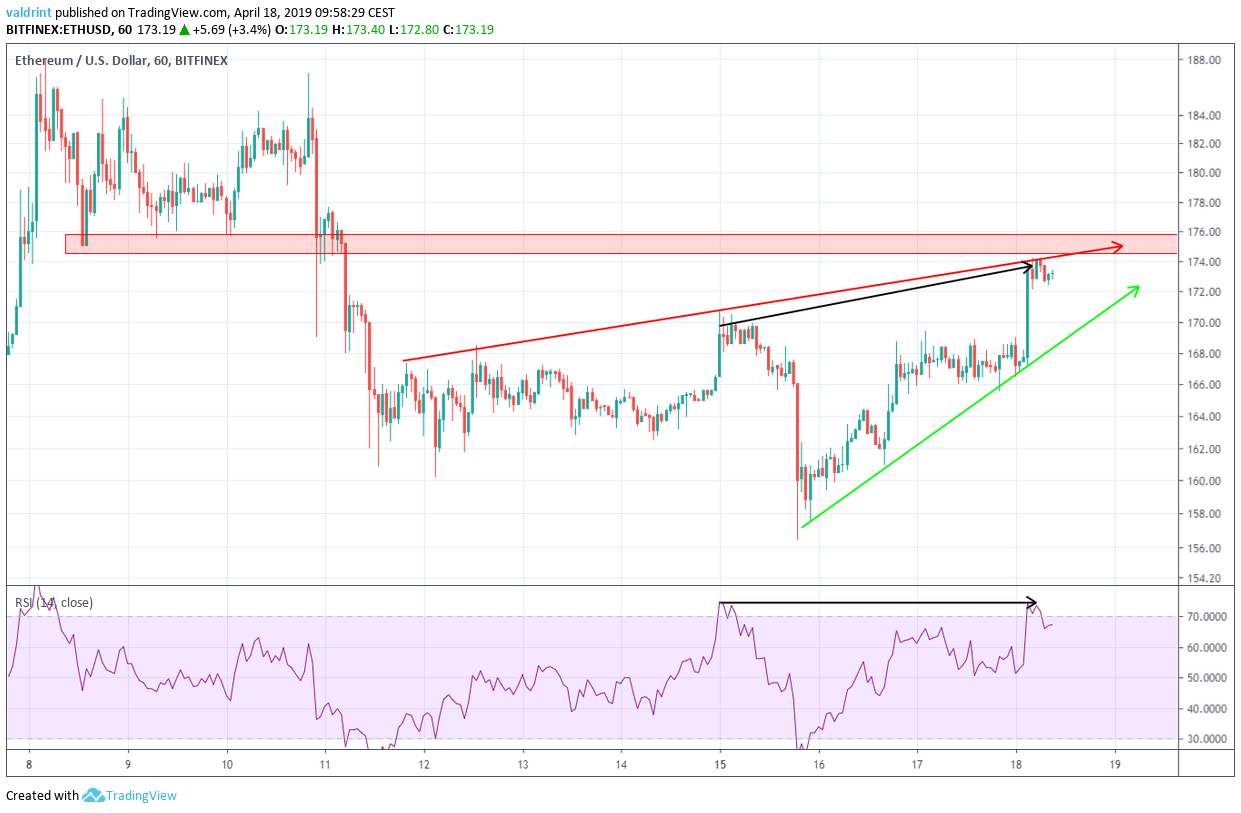
On Apr 15, the price made a high of $170.78 It made a higher high of $174.21 on Apr 17.
Similarly, the RSI made the first high on Apr 15. However, it has continued to generate higher values since.
This is known as bullish divergence and often precedes price increases. Furthermore, the divergence is occurring at the resistance line of a bearish pattern, giving it more validity.
In addition, there is significant resistance near $175. The bearish divergence makes it unlikely that the price has enough strength to break out above this level.
Using these indicators, it is likely that the price will fall down to the support line of the wedge and possibly break down.
Reversal Areas
To determine possible price levels following an increase, we continue with an analysis of resistance and support areas.
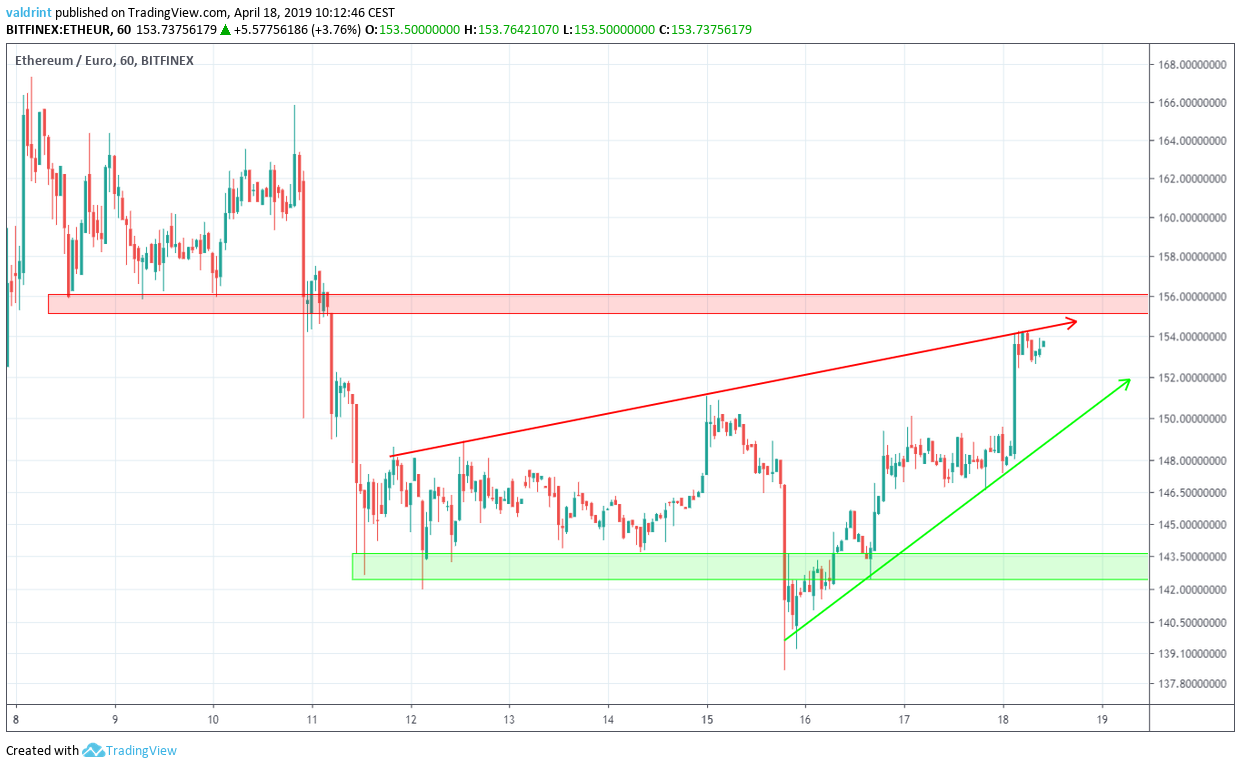
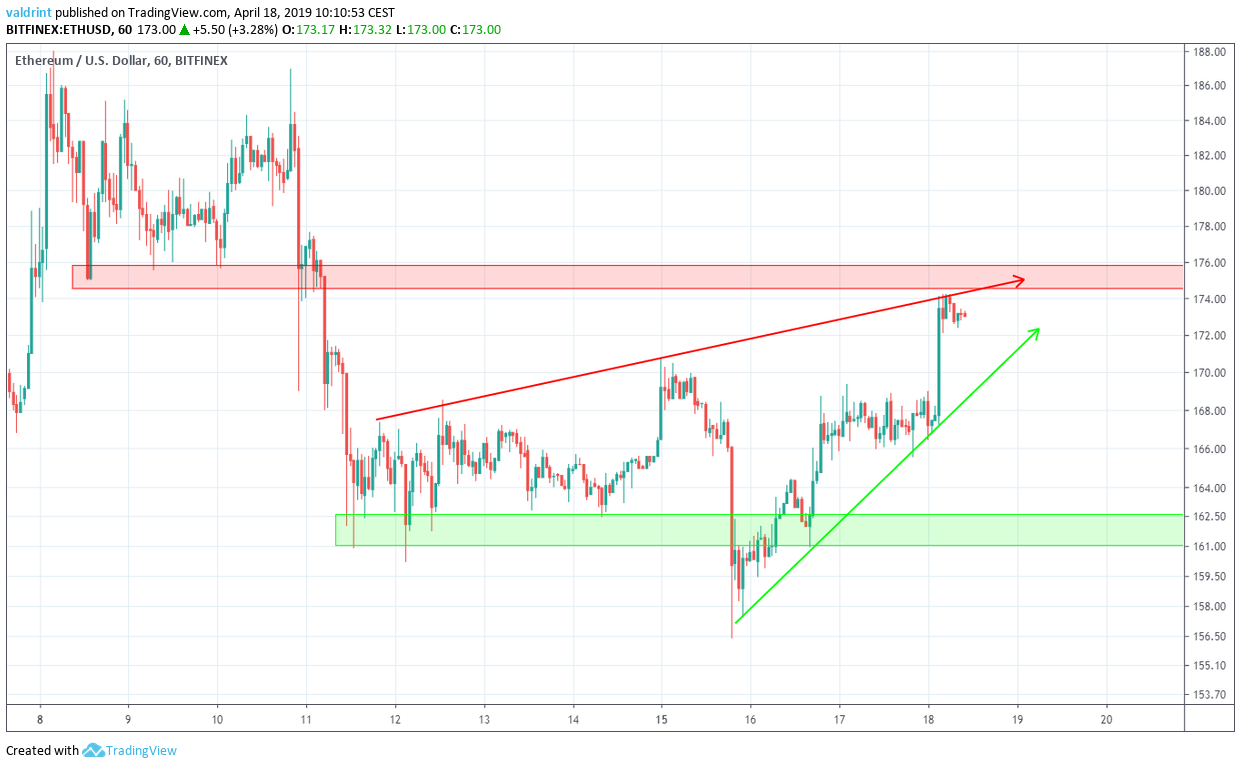
The closest support area is found near $161 and €143. If the price breaks down from the wedge, it is likely to reach this area. We believe this to be likely.
Summary of Analysis
Based on this analysis, the price of ETH is likely to decrease towards the support line of the wedge. A breakdown is likely in the medium-term. Price may fall into the $160s and €140s in the short-term.
To read 2019 and 2020 Ethereum price predictions, click on the green button below:
Do you think ETH will break down from the wedge? Let us know your thoughts in the comments below.
Disclaimer: This article is not trading advice and should not be construed as such. Always consult a trained financial professional before investing in cryptocurrencies, as the market is particularly volatile.
