
On Apr 10, 2019, the price of Ethereum (ETH) made a high of $186.97. A sharp drop ensued which took it to lows of nearly $160 on Apr 12:
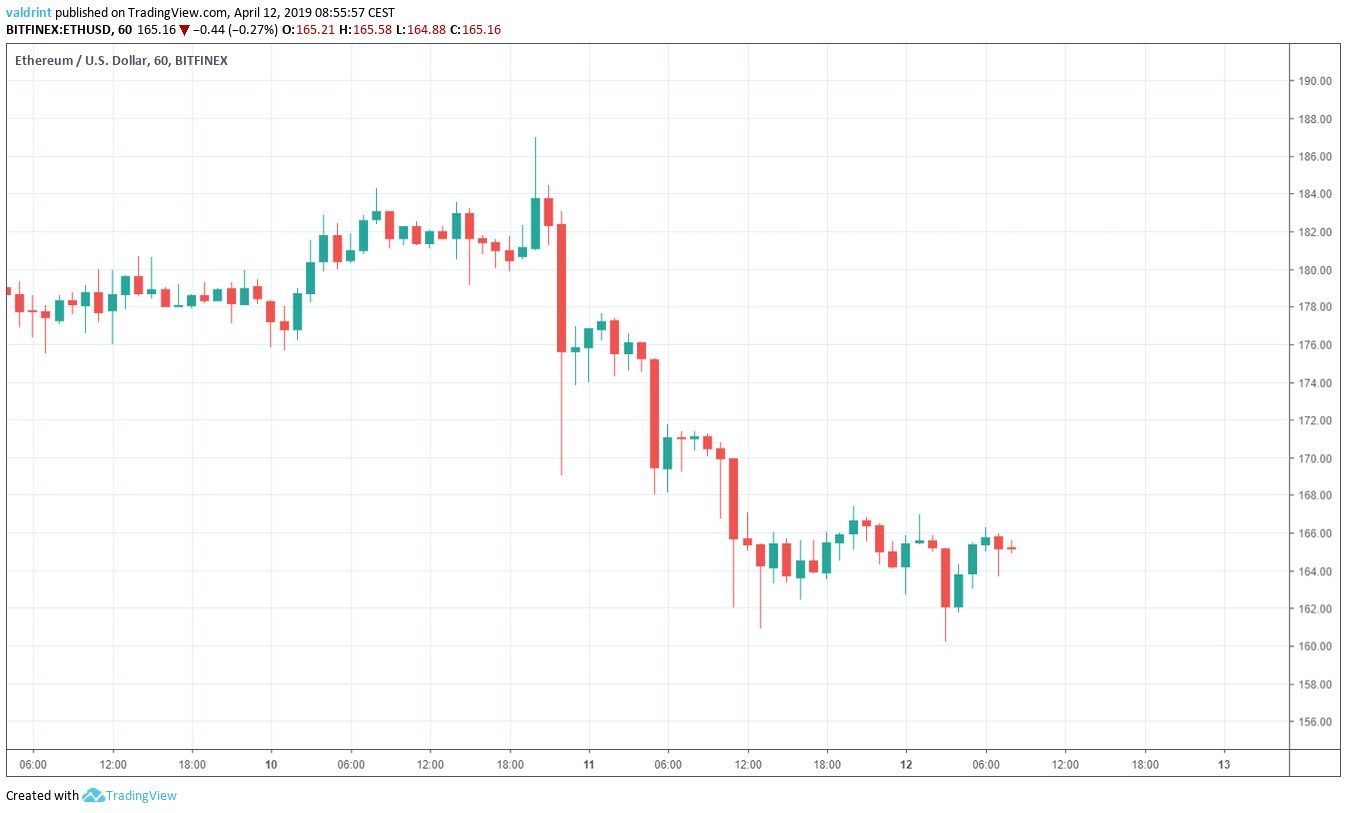
Has Ethereum found support at $160?
Let’s find out:
Ethereum (ETH): Trends and Highlights for April 11, 2019
- The price of Ethereum made a high of $186.97 on Apr 11.
- ETH/USD is following a descending support line.
- Bullish divergence is developing in the RSI and the MACD.
- There is resistance near $177 and $171.
- ETH is trading inside a long-term ascending channel.
Descending Support
On Apr 10, Ethereum reached an hourly low of $175.66. A gradual increase was followed by a decrease.
The price has made several lower lows. Tracing these lows gives us a descending support line:
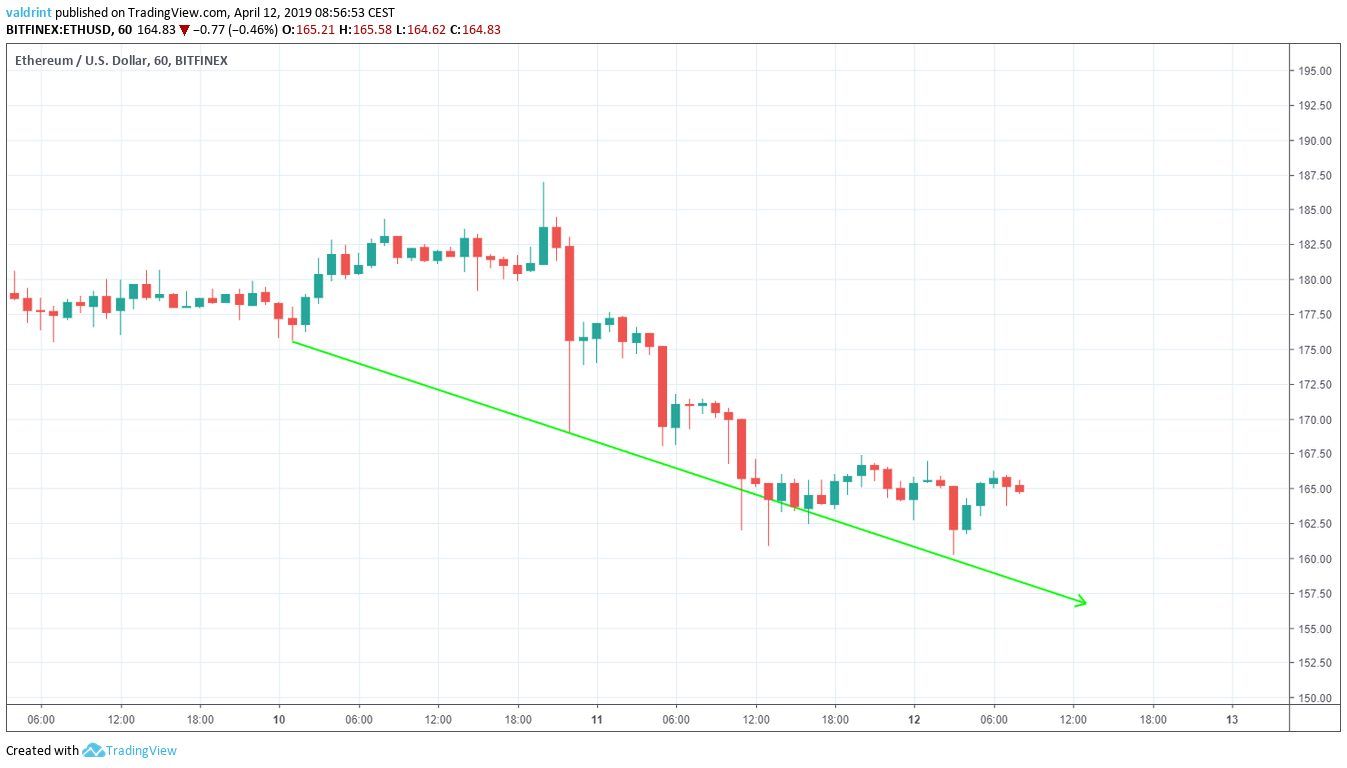
The price is not following a visible resistance line.
Will Ethereum begin a reversal?
To find out, we need to take a look at technical indicators.
Technical Indicators
Combining MACD and RSI bullish/bearish divergence with support/resistance essentially predicts price fluctuations.
They are shown in the chart below:
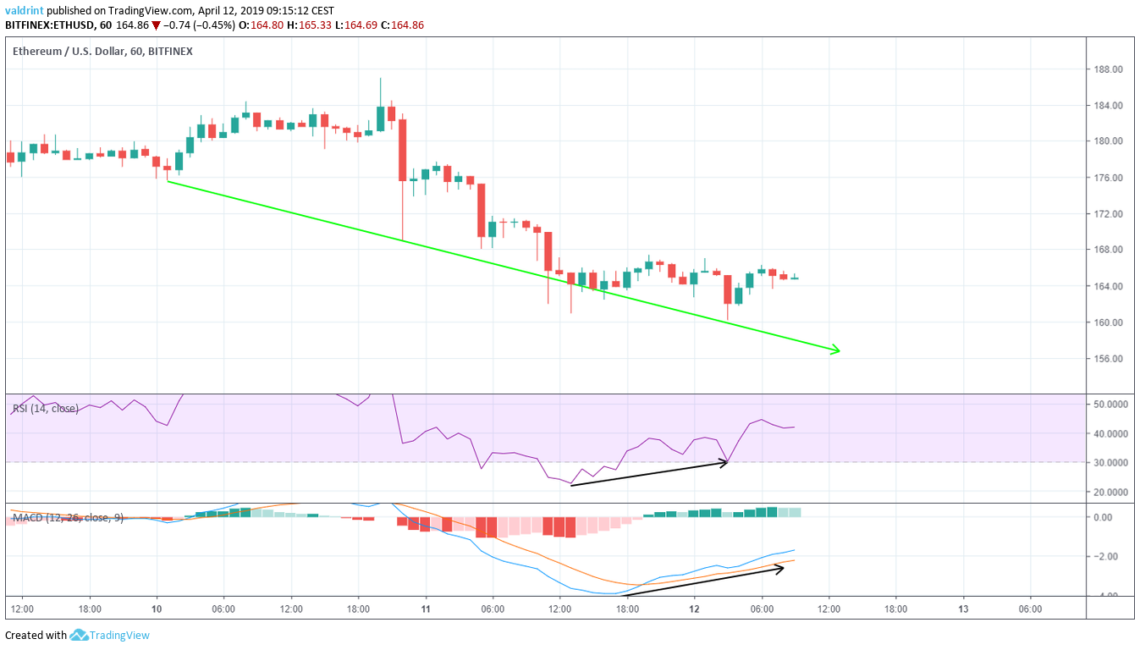
On Apr 10, the price made a low of $160.90 It made a lower low of $160.2 on Apr 11.
Similarly, the RSI and the MACD made the first low on Apr 10. However, they have continued to generate higher values since.
This is known as bullish divergence and often precedes price increases.
Using these indicators, it is likely that the price will begin to increase.
Reversal Areas
To determine possible price levels following an increase, we incorporate resistance areas into the analysis.
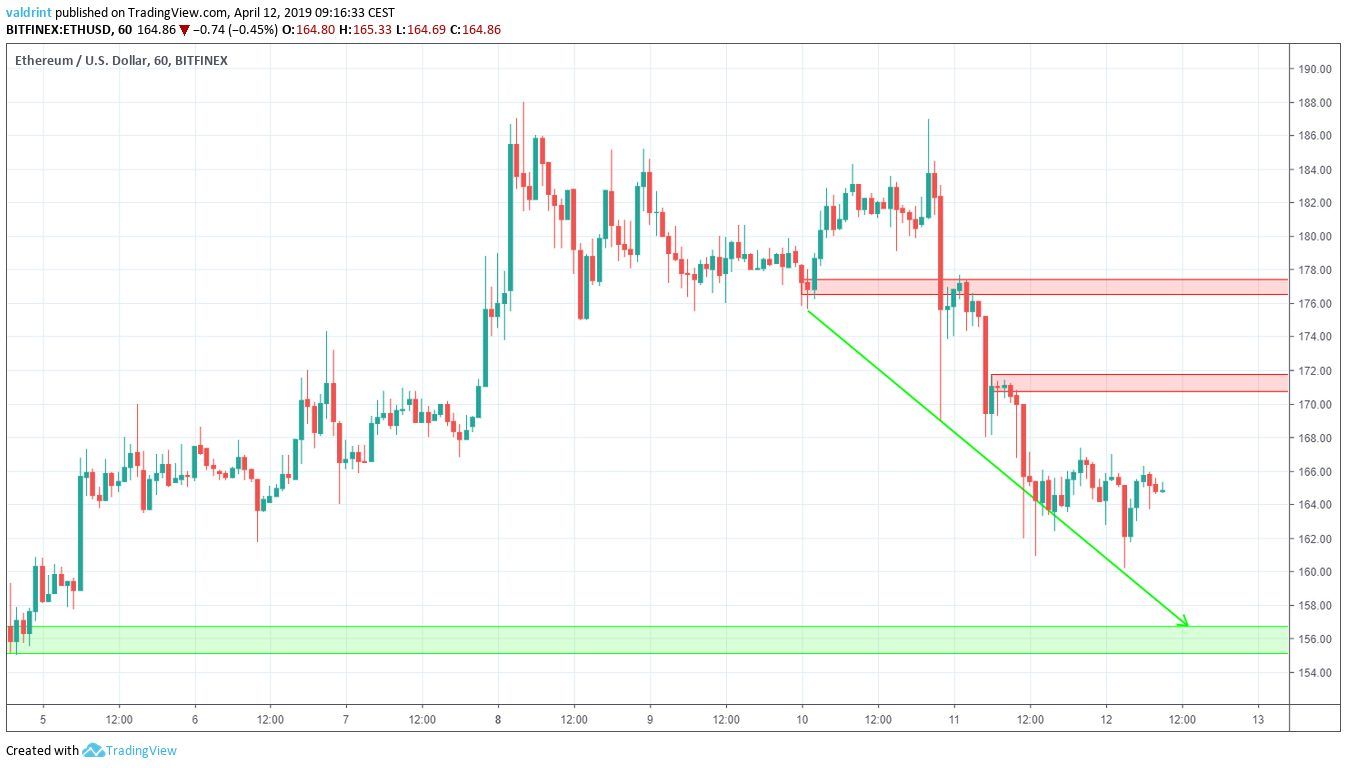
The first resistance area is located near $171. The second one is found near $1177. If the price begins to increase, it is likely it will reach at least one of these areas. We believe this scenario is likely.
The closest support area is found near $156. If the price keeps decreasing at the rate predicted by the support line, it is likely to reach this area. Price may drop toward $156 before a rise toward the resistance areas.
Long Term
So far, we have analyzed Ethereum’s short-term price fluctuation. To visualize the trading pattern over the last two months, Ethereum is analyzed from Feb 11 to Apr 11:
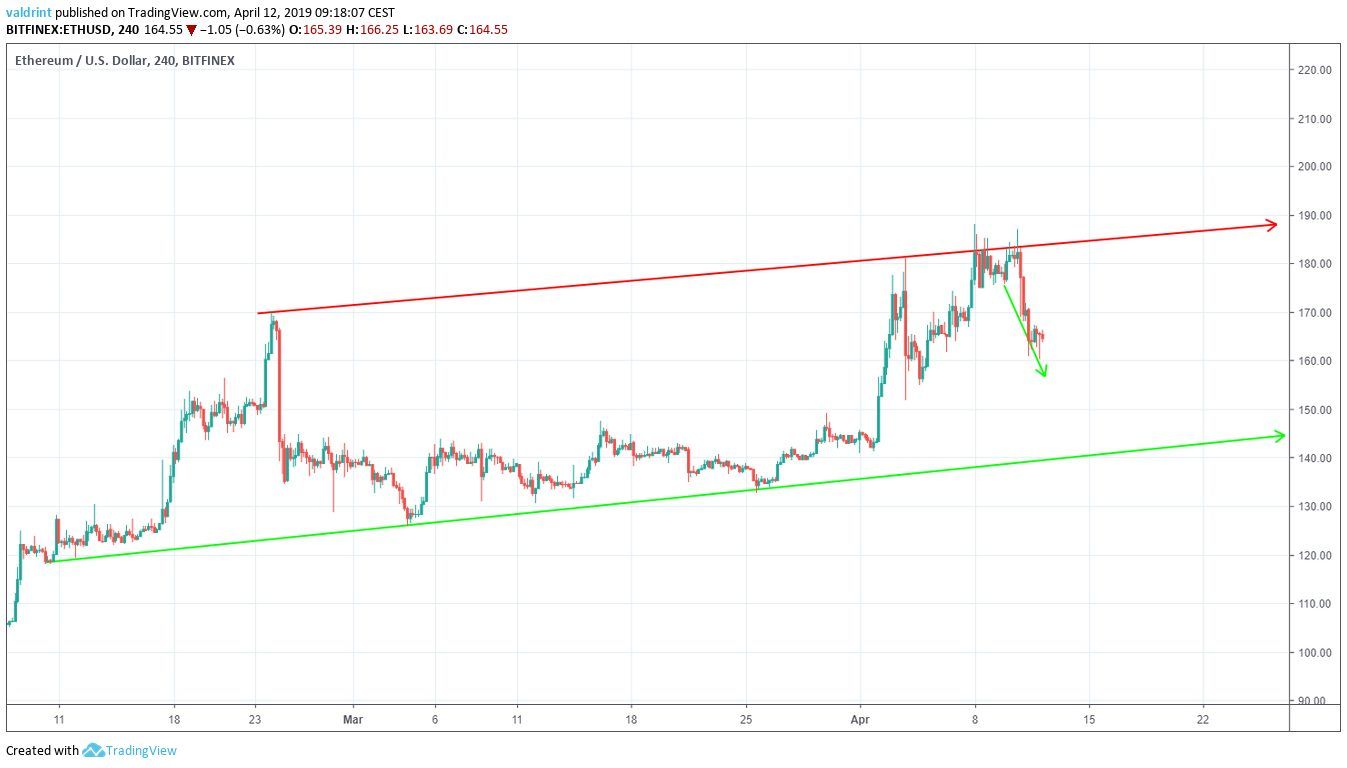
We can see that since Feb 11, the price of Ethereum has been trading inside an ascending channel.
We believe that the price will eventually drop to the support line of the channel.
Even though we predicted that there are going to be short-term increases, we should see a price decrease sometime next week as part of the long-term trend.
To read price predictions for 2019, 2020, and beyond, click the green button below:
Summary of Analysis
Based on this analysis, the price of ETH is likely to increase in the short-term and reach one of the resistance areas outlined above.
Do you think ETH will keep decreasing? Let us know your thoughts in the comments below.
Disclaimer: This article is not trading advice and should not be construed as such. Always consult a trained financial professional before investing in cryptocurrencies, as the market is particularly volatile.
