See More

Ethereum Is Slowly Pushing Toward $200 (ETH/USD Price Prediction: 04/09/19)

3 mins
Updated by Dani P
Join our Trading Community on Telegram

At BeInCrypto, we offer regular price analyses and predictions of the most popular and relevant cryptoassets. In our Apr 5 analysis of Ethereum (ETH) we predicted that the price of ETH will trade inside the channel we have defined below and will not reach the $155 area. While it has not reached the area, it broke out from the channel on Apr 6. Learn more in our latest analysis of ETH/USD:

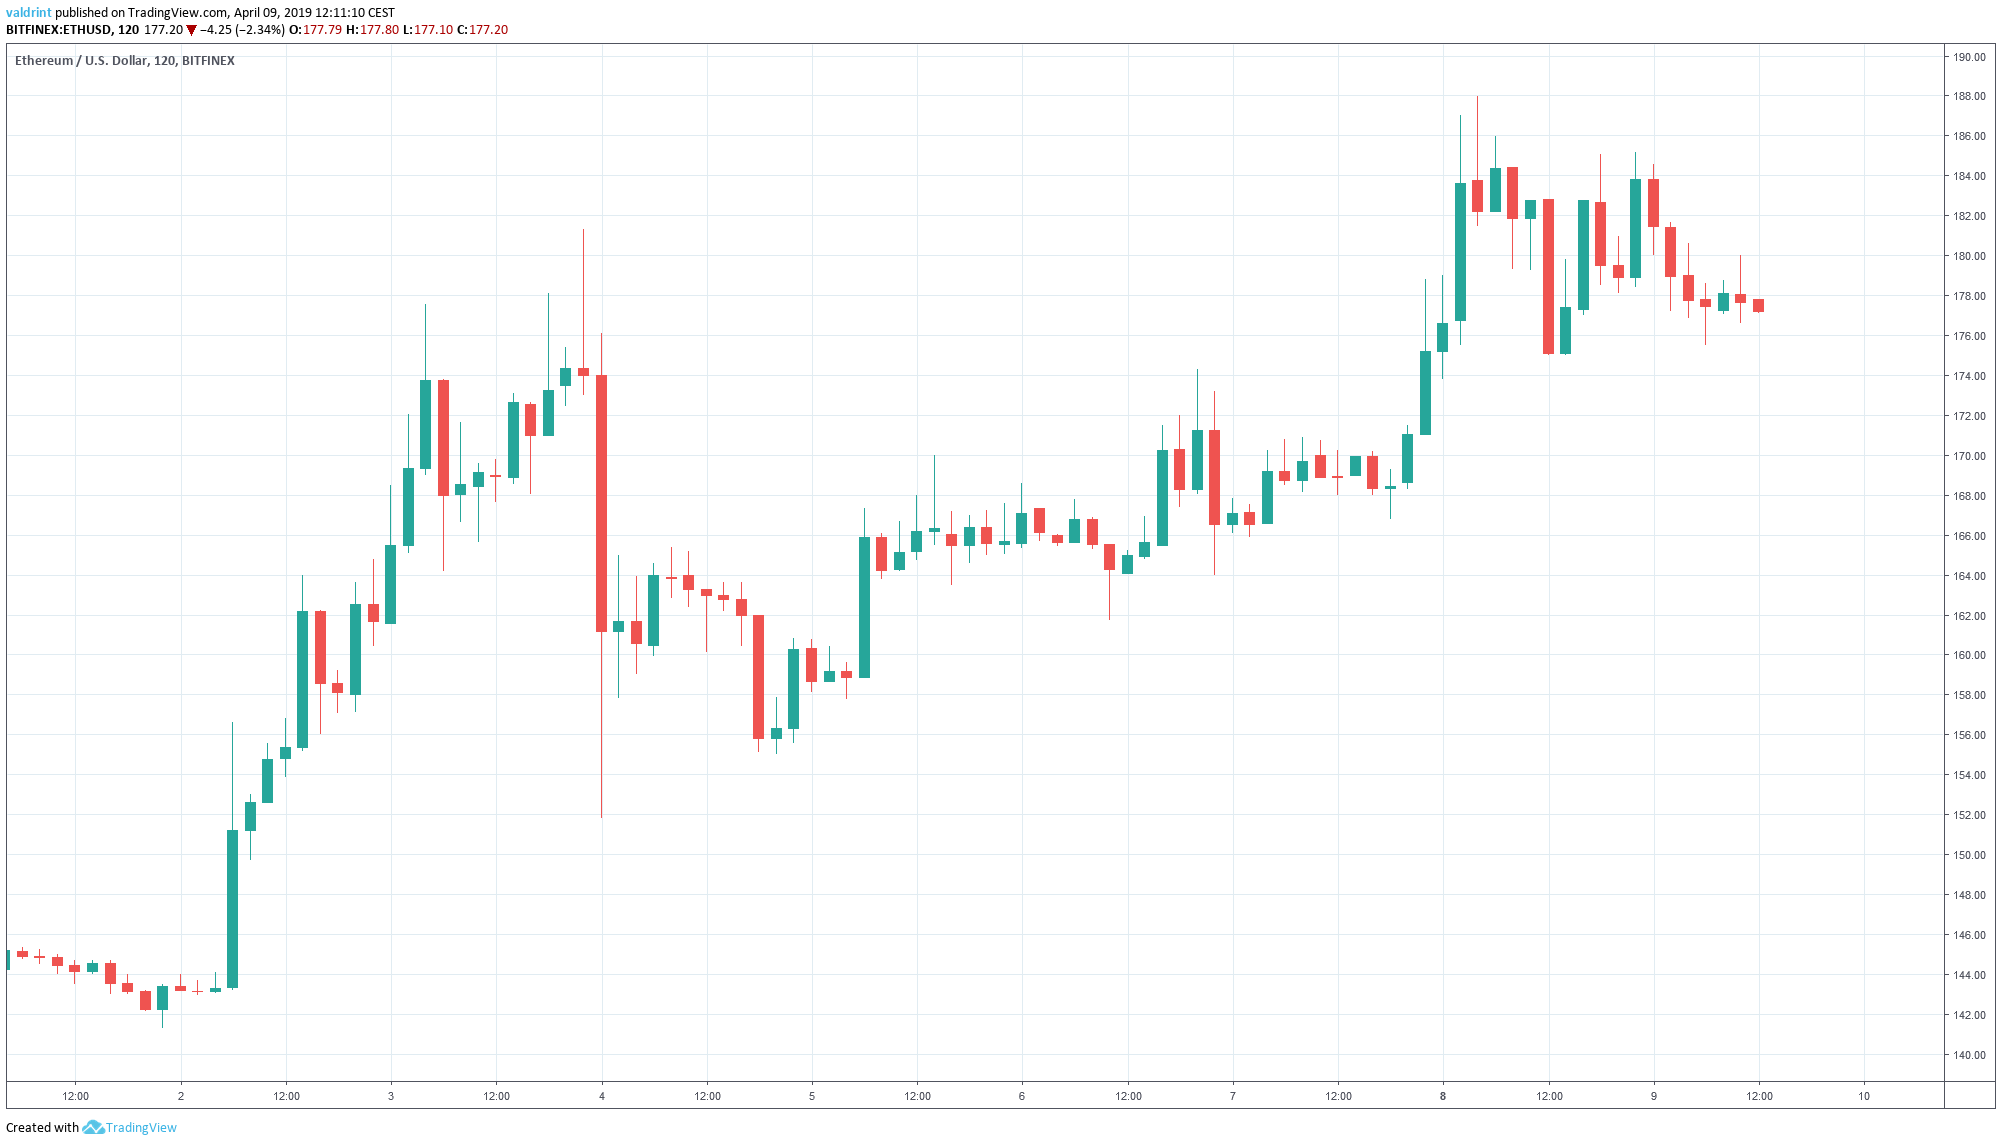
On Apr 2, 2019, the price of Ethereum (ETH) made an hourly low of $143.17. A sharp upward move ensued as part of a market-wide spike. Ethereum reached a high of $181.33 on Apr 4. A sharp decrease followed. Prices subsequently emerged on a gradual uptrend. By Apr 8, a higher high of $187.98 had been reached before prices dipped to under $180.
ETH Market Outlook
Ethereum (ETH) Prices: Apr 2 – 8
Will another upward trend bring Ethereum to $200? Let’s find out:

Ethereum (ETH): Trends and Highlights for April 9, 2019

  • The price of Ethereum made a high of $188.98 on Apr 8.
  • ETH/USD is trading inside an ascending wedge.
  • Bearish divergence is developing in the RSI and the MACD.
  • There is support near $164 and $156.

Ascending Wedge

In this section, we define Ethereum’s current trading pattern by analyzing the price of ETH on Bitfinex at one-hour   intervals from Apr 1 to Apr 9
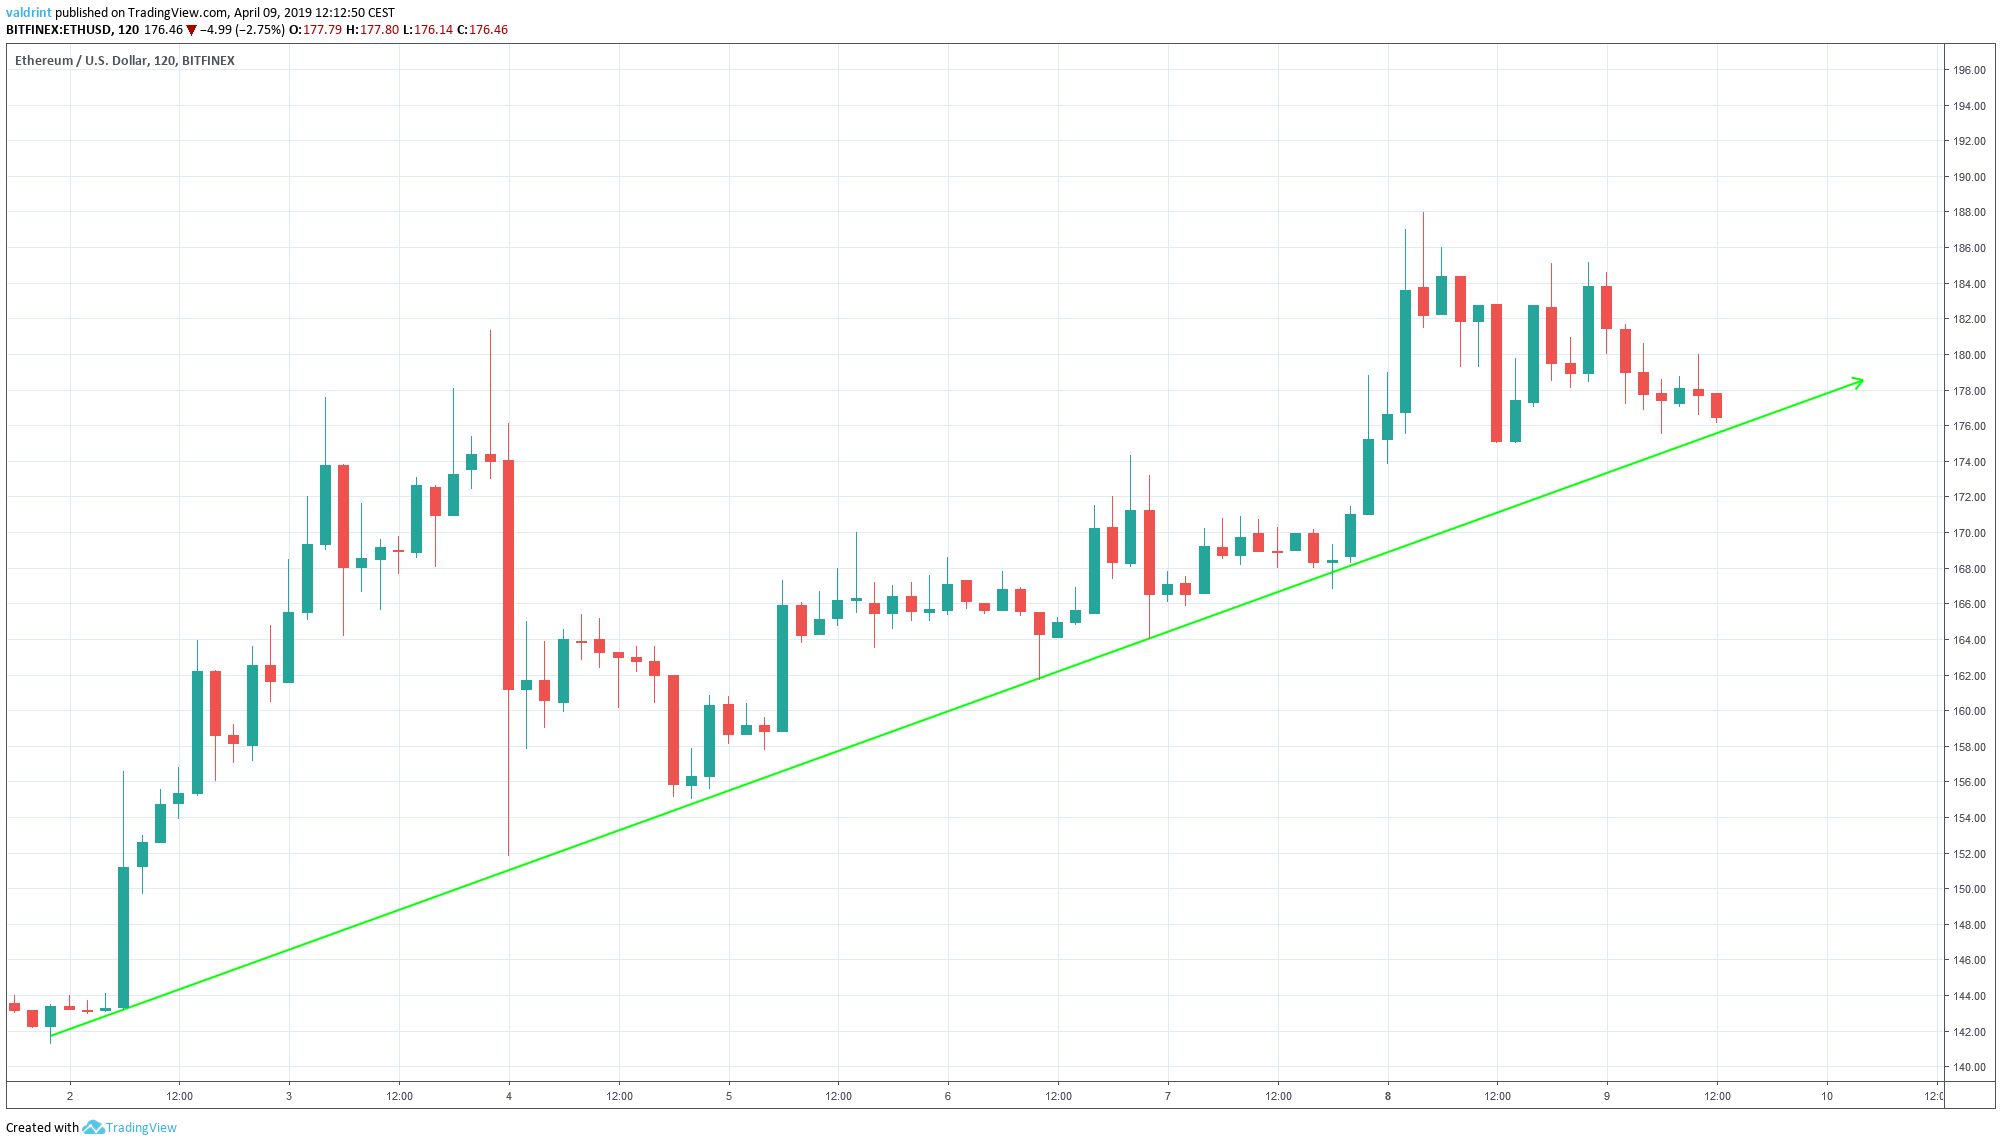
On Apr 1, Ethereum reached an hourly low of $41.28. It has been gradually increasing since. The price has made several higher lows. Tracing these lows gives us an ascending support line: Ethereum Support Line On Apr 3, the price made a high of $181.33. A sharp drop followed soon after. Since then, the price has been increasing, creating several higher highs. Tracing these highs gives us an ascending resistance line. The resistance and support lines combine to create an ascending wedge: Ascending Wedge 
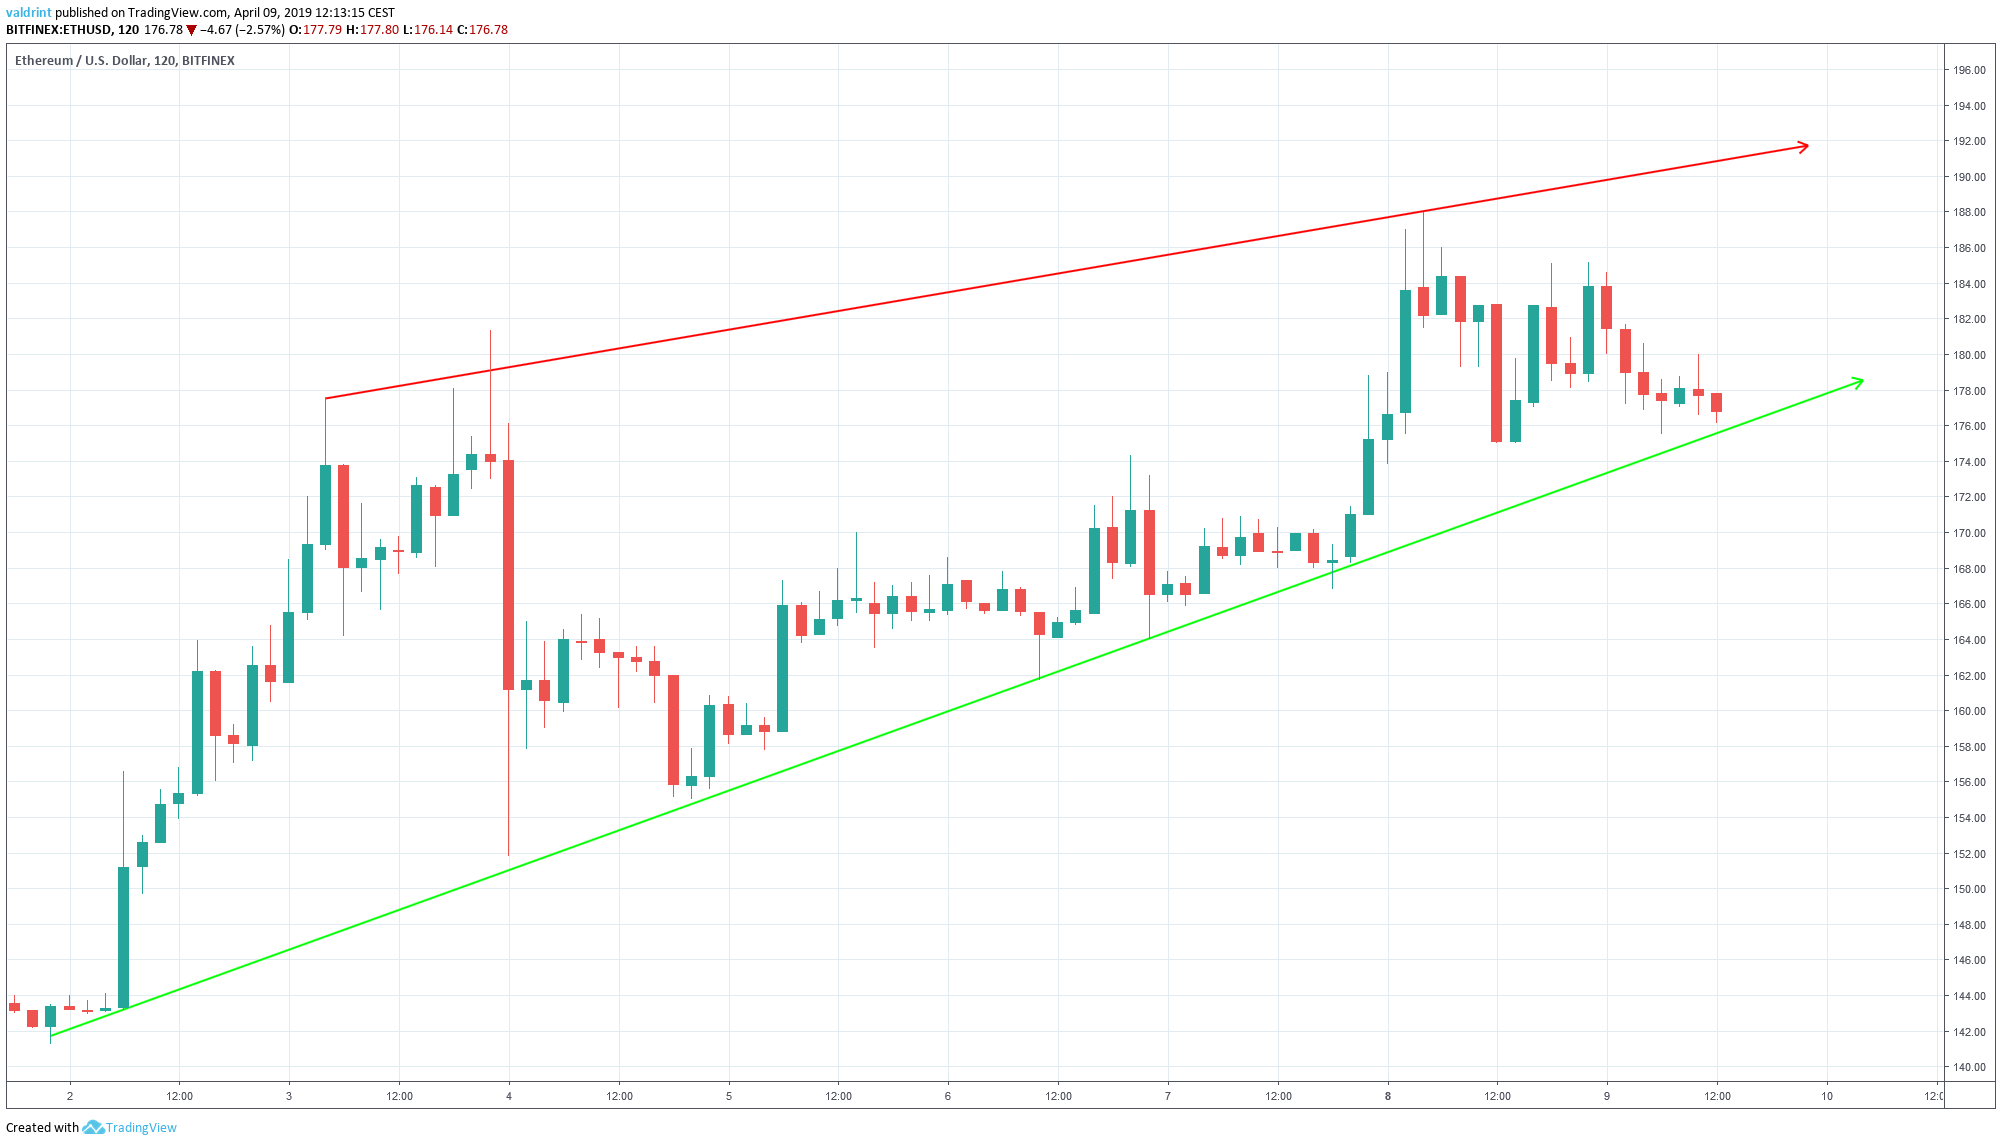
This is a bearish pattern. It suggests that price losses are more likely than price increases. As ETH/USD trades near the support line, should we expect a breakout? To find out, we need to take a look at technical indicators.

Technical Indicators

The price of ETH on Bitfinex is analyzed at six-hour intervals from Apr 1 to Apr 9 alongside the RSI and the MACD in order to better visualize divergence.
The moving average convergence divergence (MACD) is a trend indicator that shows the relationship between two moving averages (long and short-term) and the price. It is used to measure the strength of a move.
The relative strength index (RSI) is an indicator which calculates the size of the changes in price in order to determine oversold or overbought conditions in the market.
Combining MACD and RSI bullish/bearish divergence with support/resistance essentially predicts price fluctuations. They are shown in the chart below:
ETH Divergence
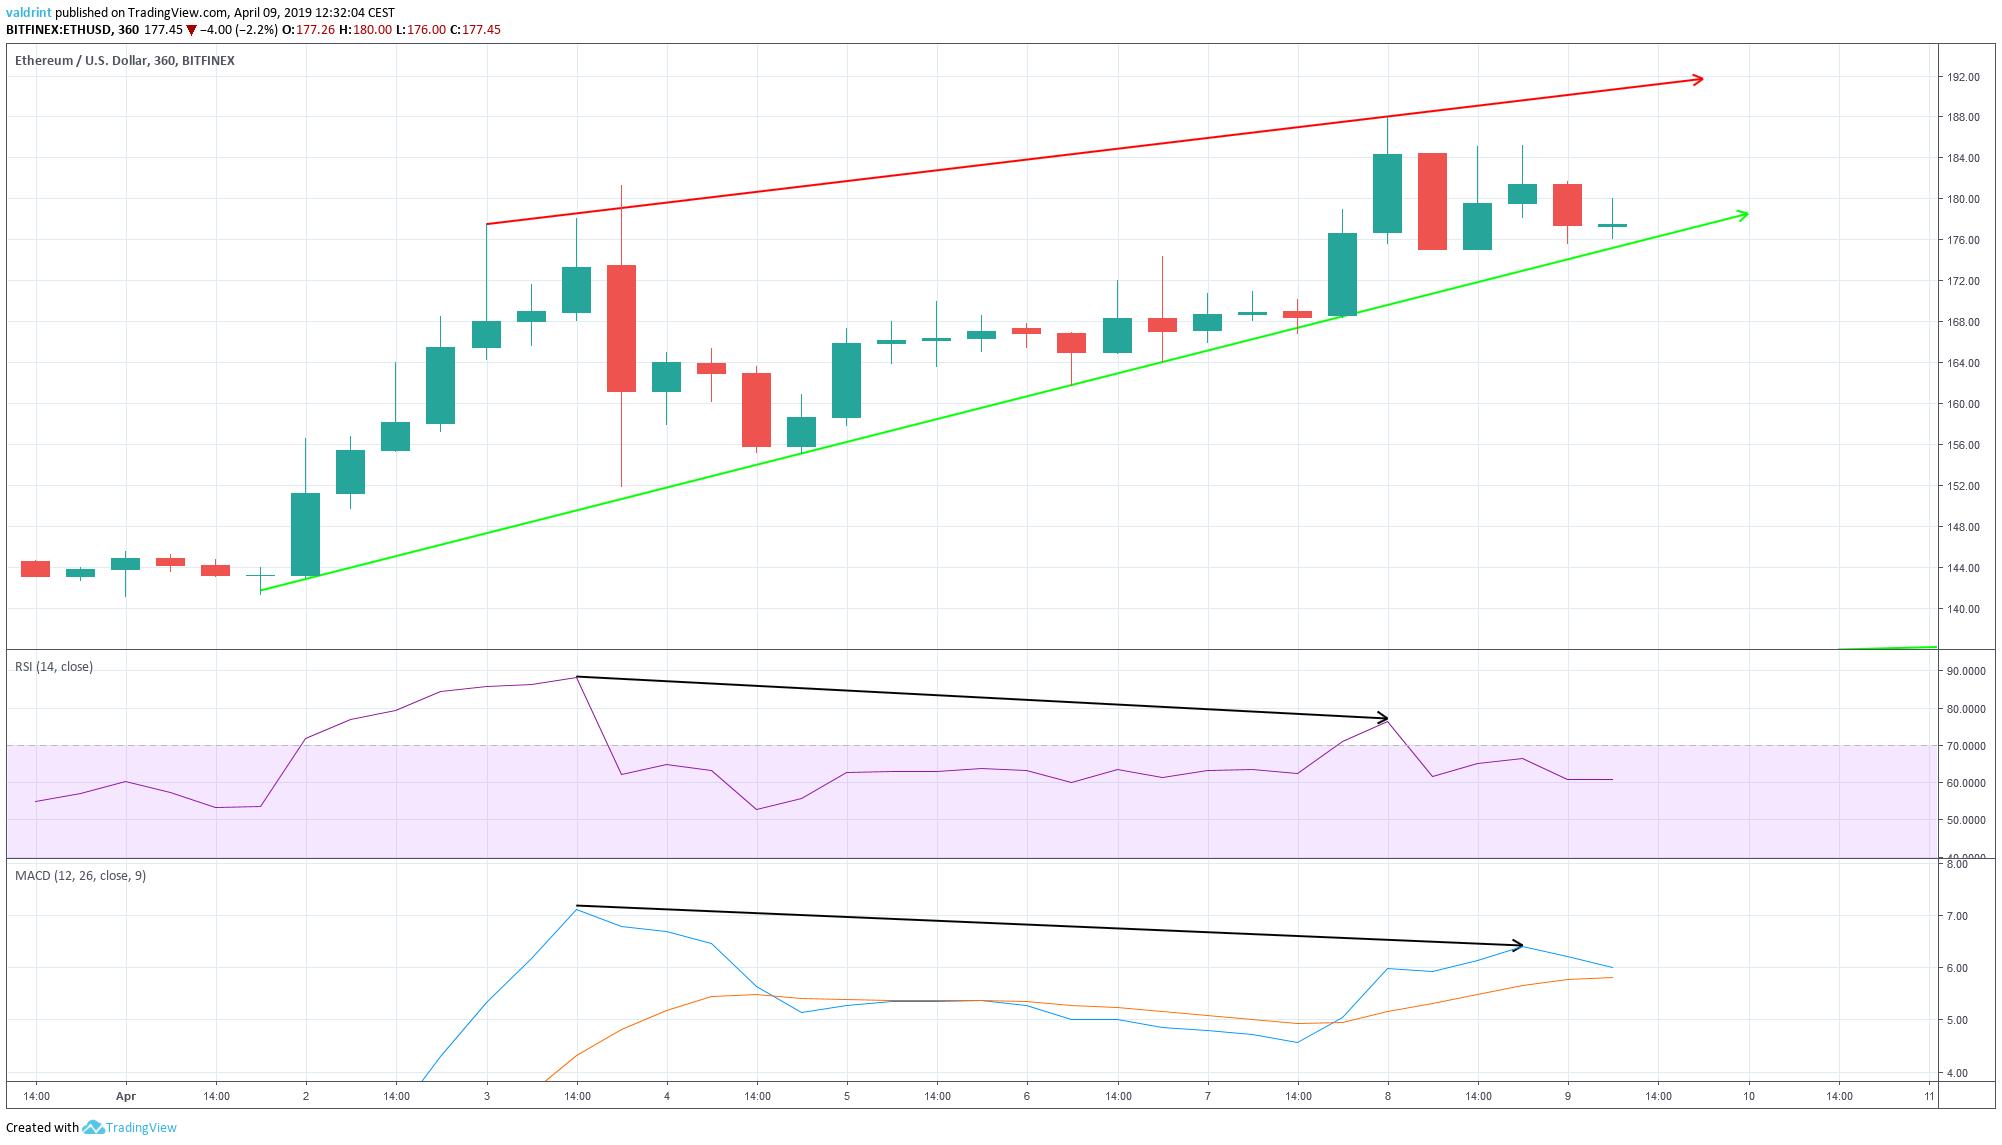
On Apr 3, the price made a high of $181.3 . It made a higher high of $187.98 on Apr 8. Similarly, the RSI and the MACD made the first high on Apr 8. However, they have continued to generate lower values since. This is known as bearish divergence and often precedes price decreases.  Furthermore, the level of divergence is significant. Using these indicators, it is likely that the price will keep trading inside the wedge until a breakdown occurs. This could happen in the very near-future given Ethereum’s current proximity to the support line.

Reversal Areas

Support and resistance areas are created when the price revisits the same level several times. They indicate the levels price might reach in the future based on past patterns.
Because we believe price decreases to be more likely than gains, we have drawn two support areas on the chart below:
Support Ethereum 
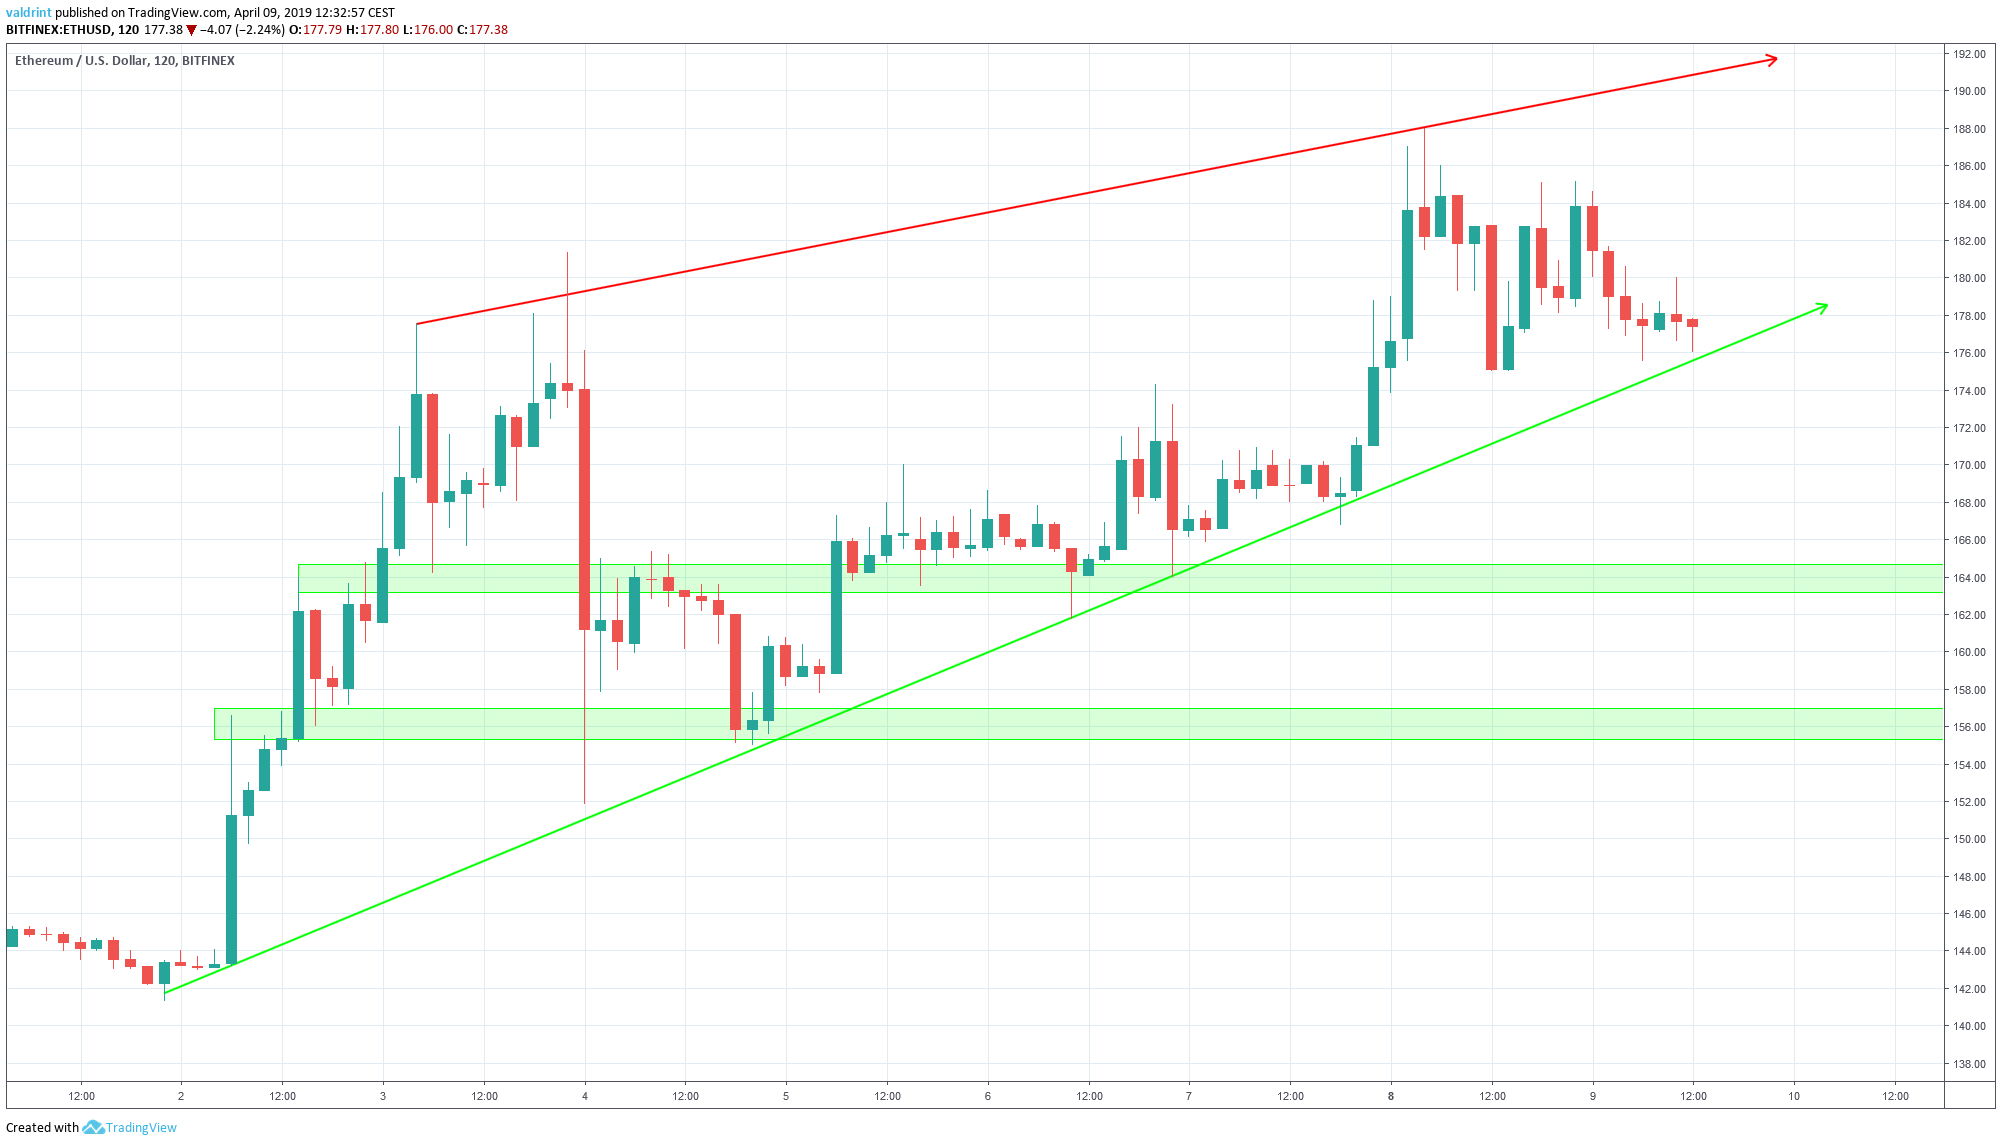
The first support area is located near $164. The second one is found near $156. If the price breaks down from the wedge, it is likely it will reach at least one of these areas.

Summary of Analysis

Based on this analysis, the price of ETH is likely to keep trading inside the wedge before it eventually breaks down. Do you think ETH will break down from the wedge?  Let us know your thoughts in the comments below.

How to Buy Bitcoin with 0 commission  

Disclaimer: This article is not trading advice and should not be construed as such. Always consult a trained financial professional before investing in cryptocurrencies, as the market is particularly volatile.
Top crypto projects in the US | April 2024

Trusted

Disclaimer

In line with the Trust Project guidelines, this price analysis article is for informational purposes only and should not be considered financial or investment advice. BeInCrypto is committed to accurate, unbiased reporting, but market conditions are subject to change without notice. Always conduct your own research and consult with a professional before making any financial decisions. Please note that our Terms and ConditionsPrivacy Policy, and Disclaimers have been updated.

Valdrin-Tahiri.jpg
Valdrin Tahiri
Valdrin discovered cryptocurrencies while he was getting his MSc in Financial Markets from the Barcelona School of Economics. Shortly after graduating, he began writing for several different cryptocurrency related websites as a freelancer before eventually taking on the role of BeInCrypto's Senior Analyst. (I do not have a discord and will not contact you first there. Beware of scammers)
READ FULL BIO
Sponsored
Sponsored