
On Mar 16, 2019, the price of Ethereum (ETH) made a high of $147.50. A gradual downtrend followed with lows around $139 experienced on Mar 18 and 20.
Price drops accelerated on Mar 21 when Ethereum reached lows near $135. A lower low under $133 was experienced on Mar 25.
Shortly, thereafter price went up. On Mar 26, a surprise spike resulted in a high over $140.
Should we expect continued price gains or will prices fall down to a new lower low in the coming days? Keep reading to find out.
Based on today’s analysis, we predict that the prices of ethers—the native cryptocurrency deployed on the Ethereum network—will not break out above $142. On the contrary, we believe the price will drop to one of the support areas outlined below.
However, Ethereum’s recent losses do not invalidate the overall upward trend that began in February 2019. Long-term price gains are still expected.
Ethereum (ETH): Trends and Highlights for March 27, 2019
- The price of Ethereum has been on a downtrend since Mar 16.
- ETH broke out from a descending parallel channel.
- The moving averages have indicated that a downtrend has begun.
- There are resistance areas near $145, $142 and $140.
- There are support areas near $137, $133 and $128.
Descending Channel
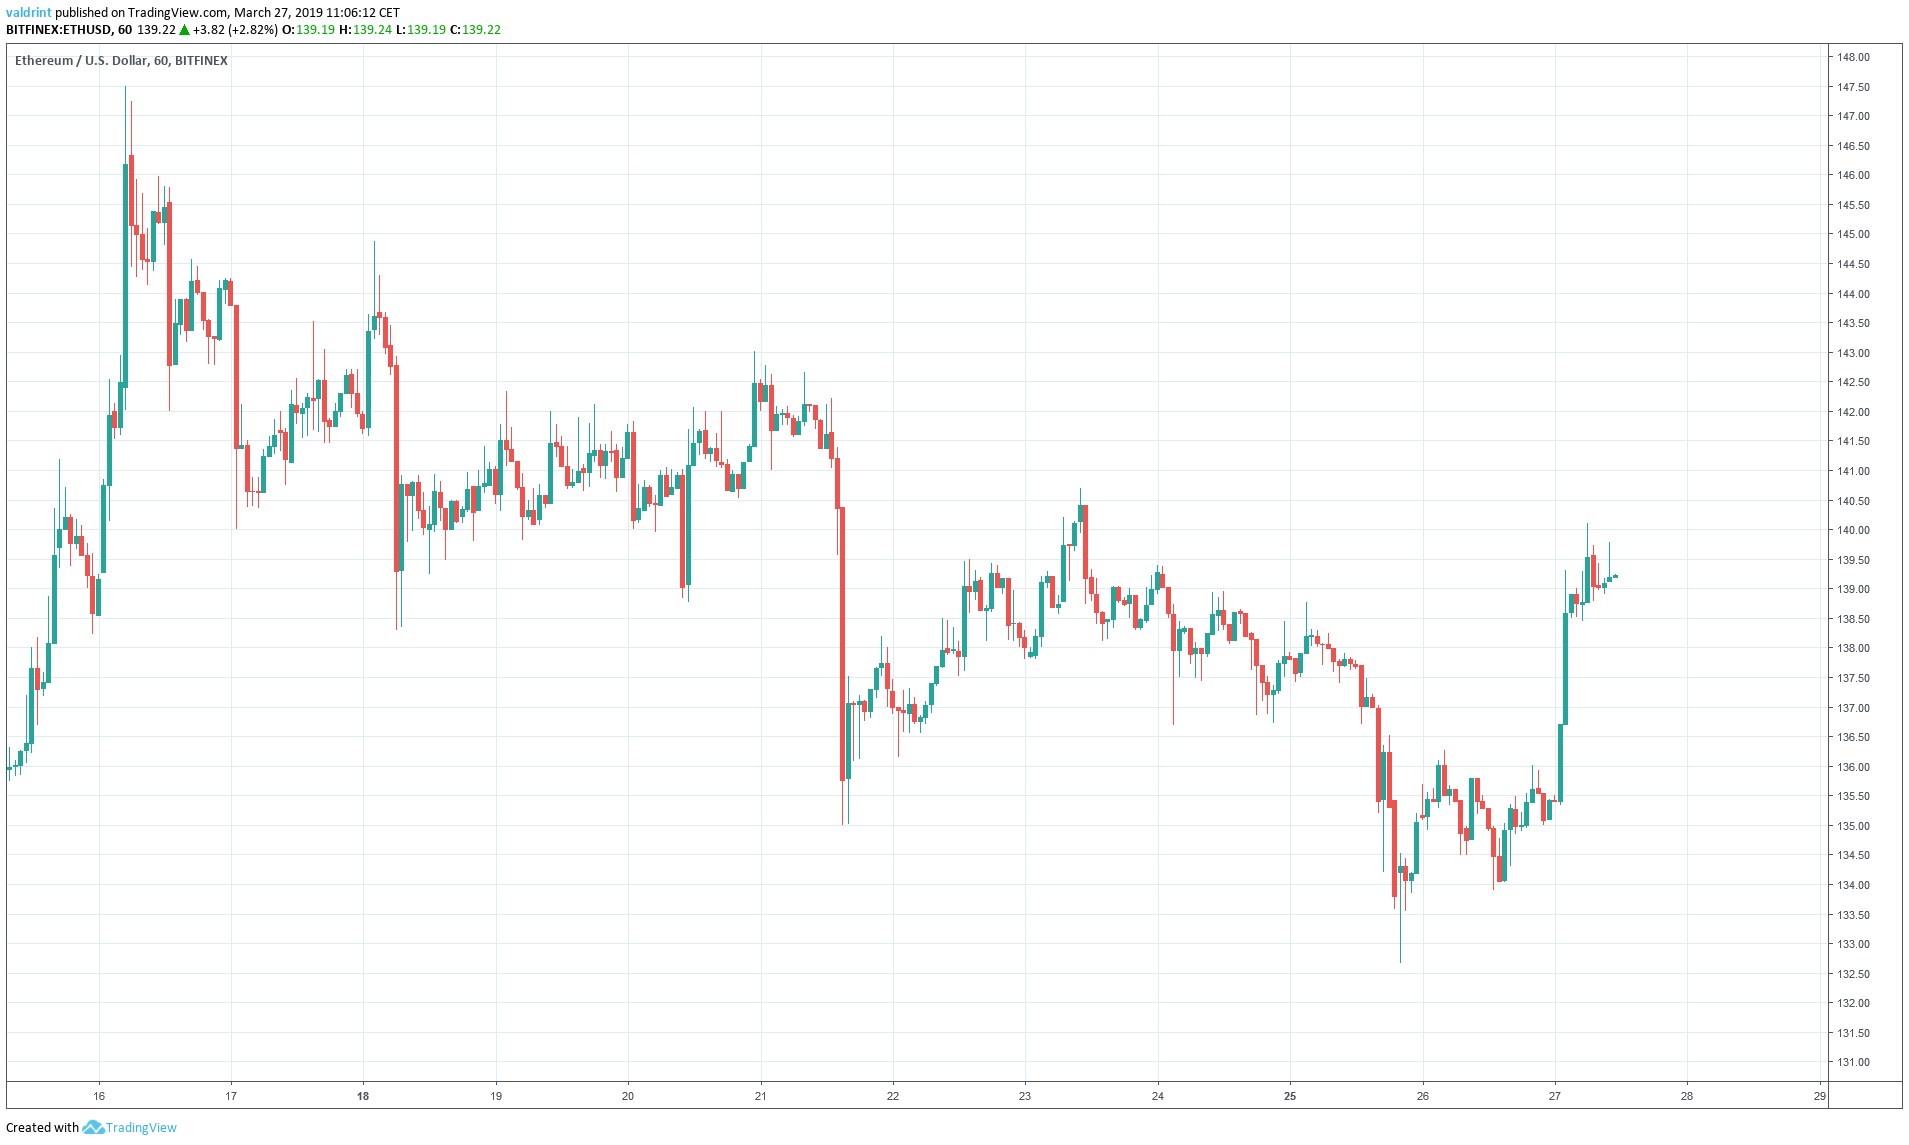
The price of ETH on Bitfinex is analyzed at one-hour intervals from Mar 13 to Mar 26.
On Mar 16, the price made a high of $147.50. A gradual downward move followed. Several market cycles have been completed and each high has been lower than the previous one.
Now that the resistance line is defined, we trace the support to complete the trading pattern.
On Mar 18, the price made a low of $138.30. A gradual increase was followed by a sharp decrease. Each low has been lower than the previous one.
Tracing these lows beginning with the Mar 18 low gives us an ascending support line.
Coupled with resistance, we have a downward facing parallel channel:
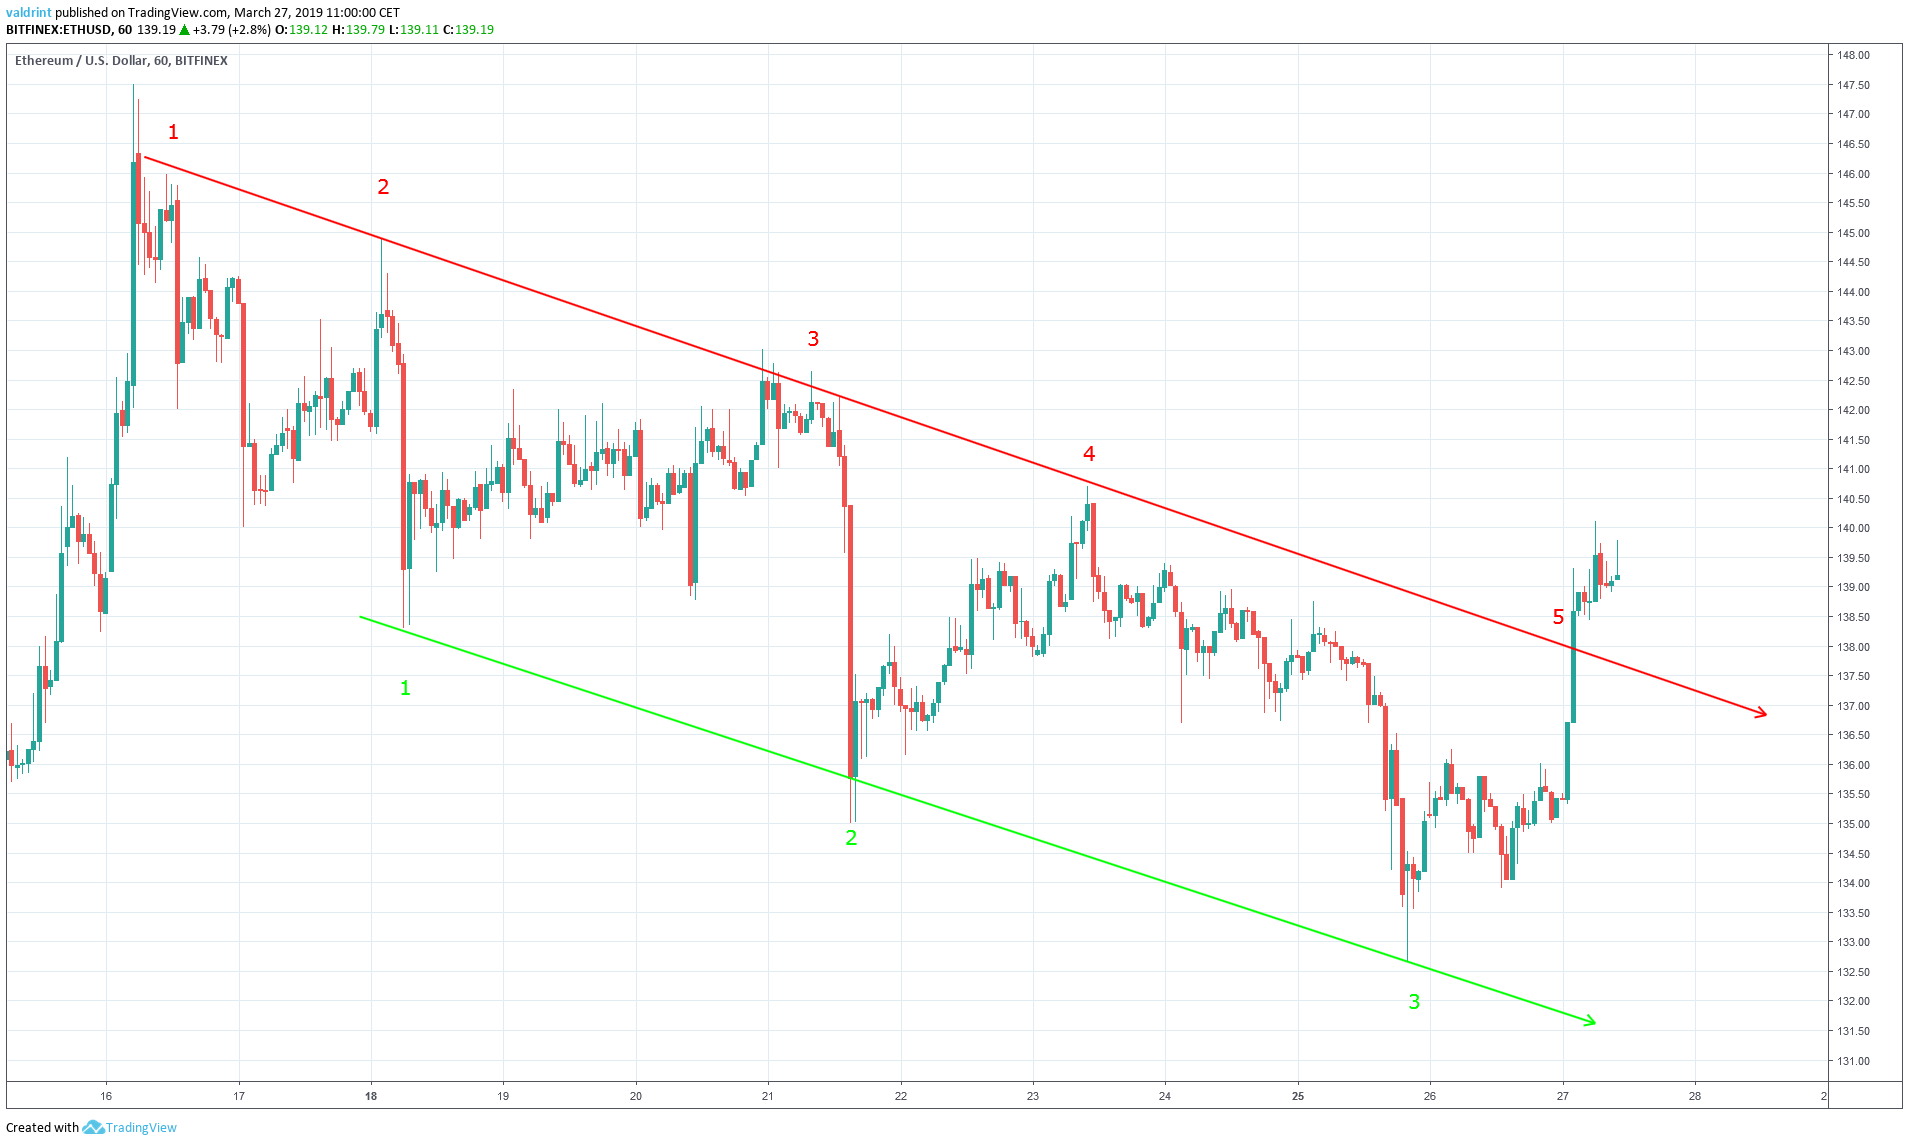
Since Mar 16, the price has been decreasing at the same rate as predicted by the channel. It has validated the resistance and support lines five and three times respectively.
However, a breakout occurred on March 27 taking the price slightly above the channel.
Is this the beginning of an uptrend or a correction in regards to the prior decreases?
Previous Movement
In order to find out, we need to examine the price of Ethereum over a longer time-period. In the graph below, the price of ETH on Bitfinex is analyzed at two-hour intervals from Mar 4 to Mar 27:
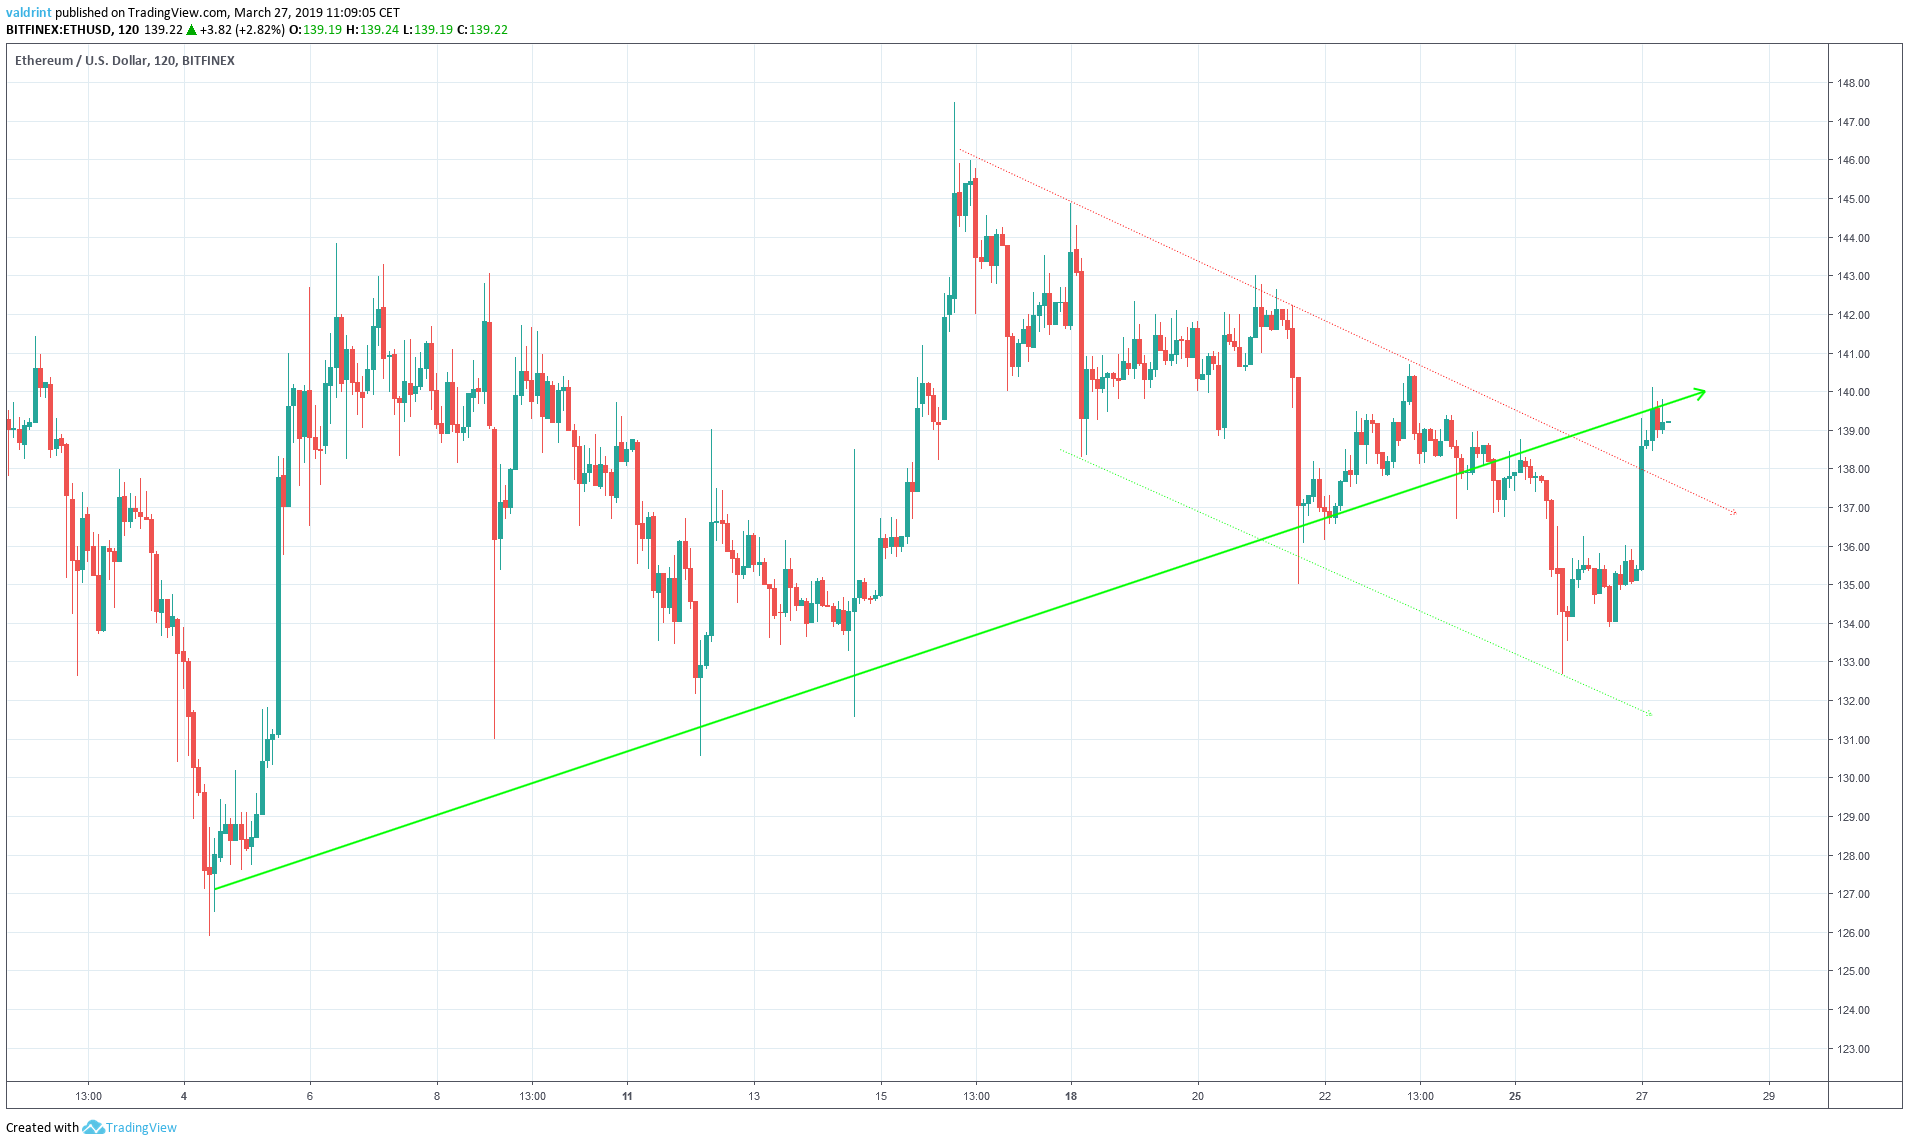
On Mar 4, the price made a low of $125.88. Since then, several market cycles have been completed, with each low being higher than the previous one. Tracing these lows gives us an ascending support line.
The support line acts as a floor to price, preventing further downward movement. It also serves to measure the rate of increase.
Price has been increasing at the same rate as predicted by the line until Mar 26 when a breakdown occurred. At this point, the support appears to have become resistance as prices continue falling.
The support and resistance lines of the descending channel traced in the previous section are lightly shaded. This illustrates that the earlier uptrend may now be reversing. Such behavior is often observed after a breakout or breakdown.
In order to further test the validity of the recent upward move, a closer look at technical indicators is required.
Beginning Of An Uptrend?
In order to illustrate the previous movement, the price of ETH on Bitfinex was analyzed at two-hour intervals from Mar 4 to Mar 27.
A moving average (MA) is an indicator which helps smooth out price action by removing random short-term price fluctuations. It is a lagging indicator since it is based on an average of past prices. Actions between two or more moving averages of different time periods can be used to identify the beginning of a trend.
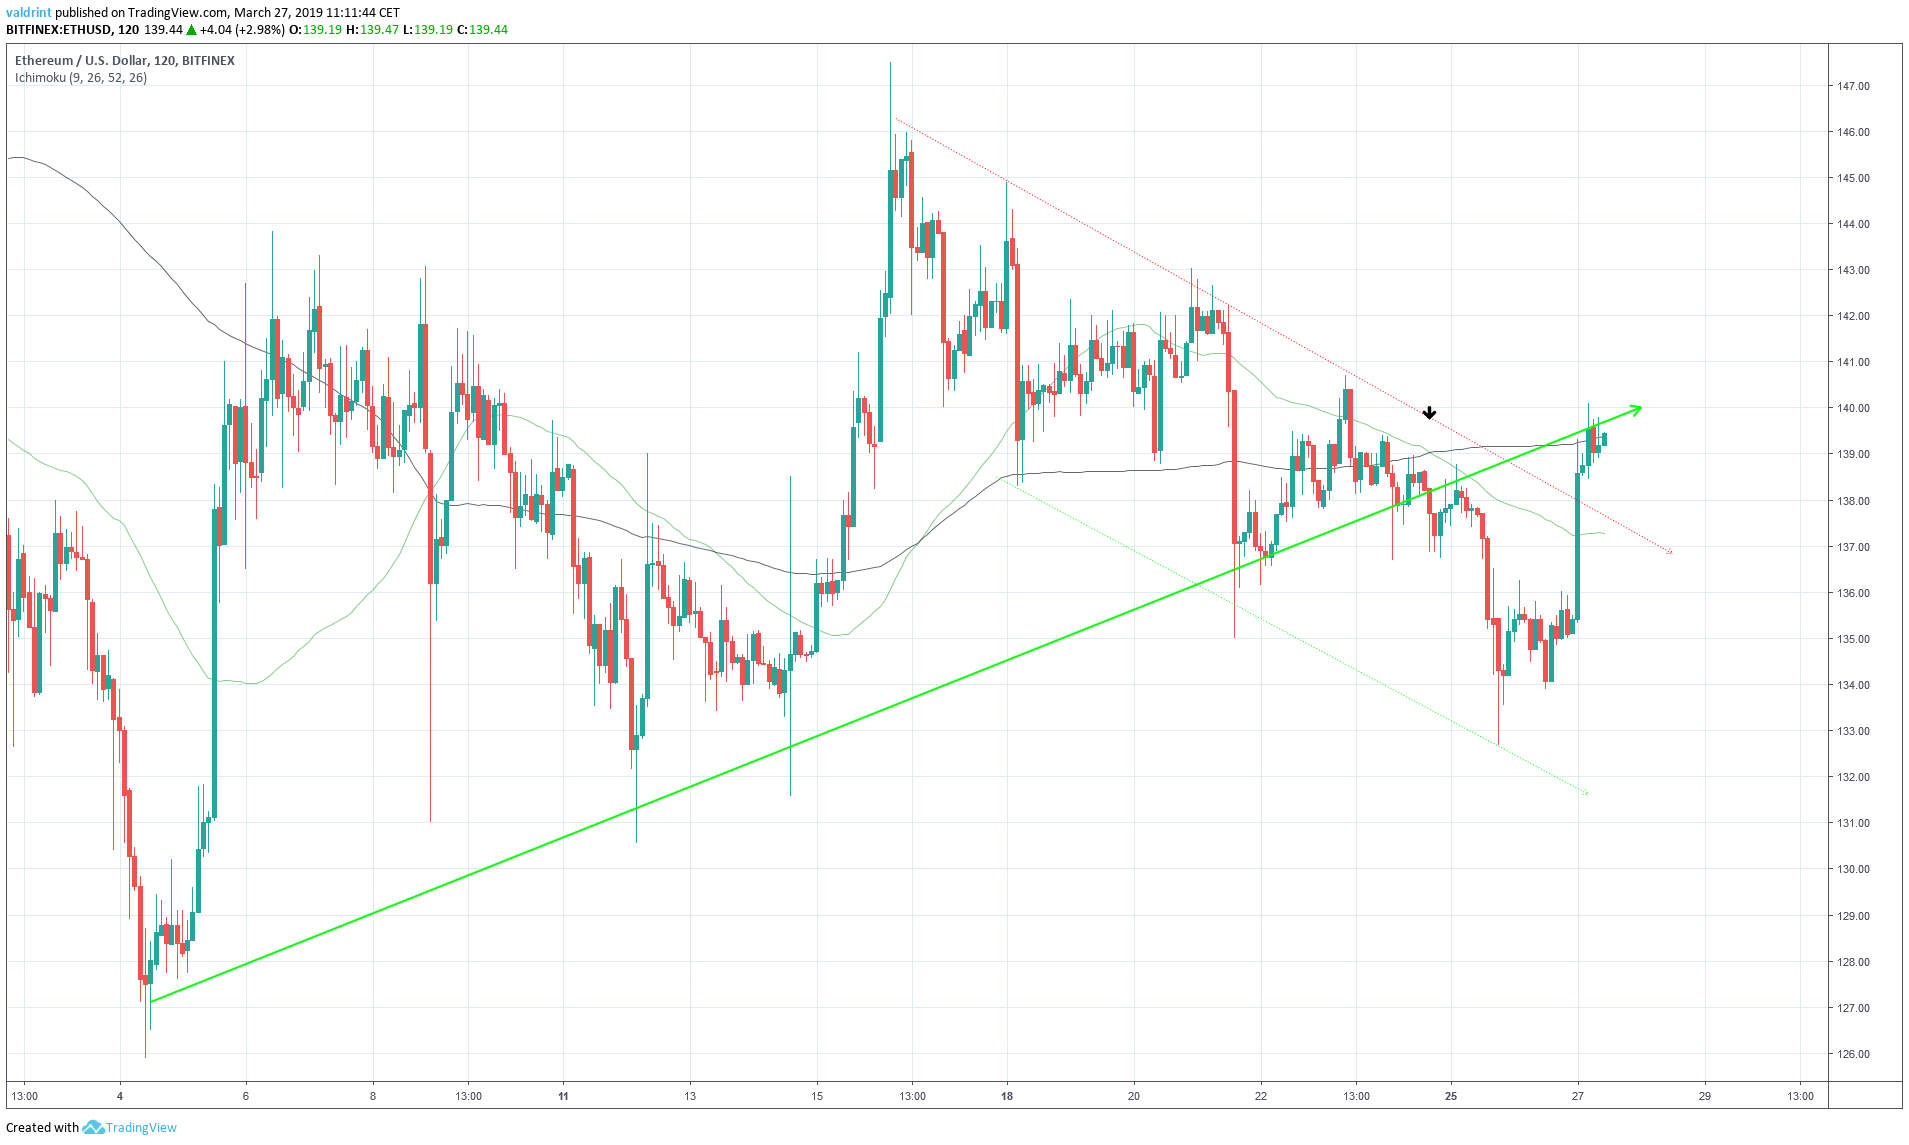
On Mar 25, the 50-period MA (Green) crossed below the 100-period MA(black). This is known as a bearish cross and can signal the beginning of a downtrend.
On Mar 26, a breakdown below the support line occurred, further giving validity to the hypothesis that a downtrend has begun.
On Mar 27, the price began an upward move. However, it stopped short at the 100-period MA, which coincides with the ascending support line.
Using this indicator, the prior uptrend now appears over. Ethereum is now trading downward. It is unlikely it appears unlikely that the price will begin an uptrend unless a confirmed breakout above the support line and 100-period MA occurs simultaneously. This downtrend still may be part of a much longer upward trend we’ve traced in our 2019, 2020, and 5 Year Price Predictions for Ethereum.
Reversal Areas
The price of ETH on Bitfinex was analyzed at two-hour intervals from Mar 5 to Mar 26 to determine possible values that may be reached.
Resistance and support areas are created when the price revisits the same level several times.
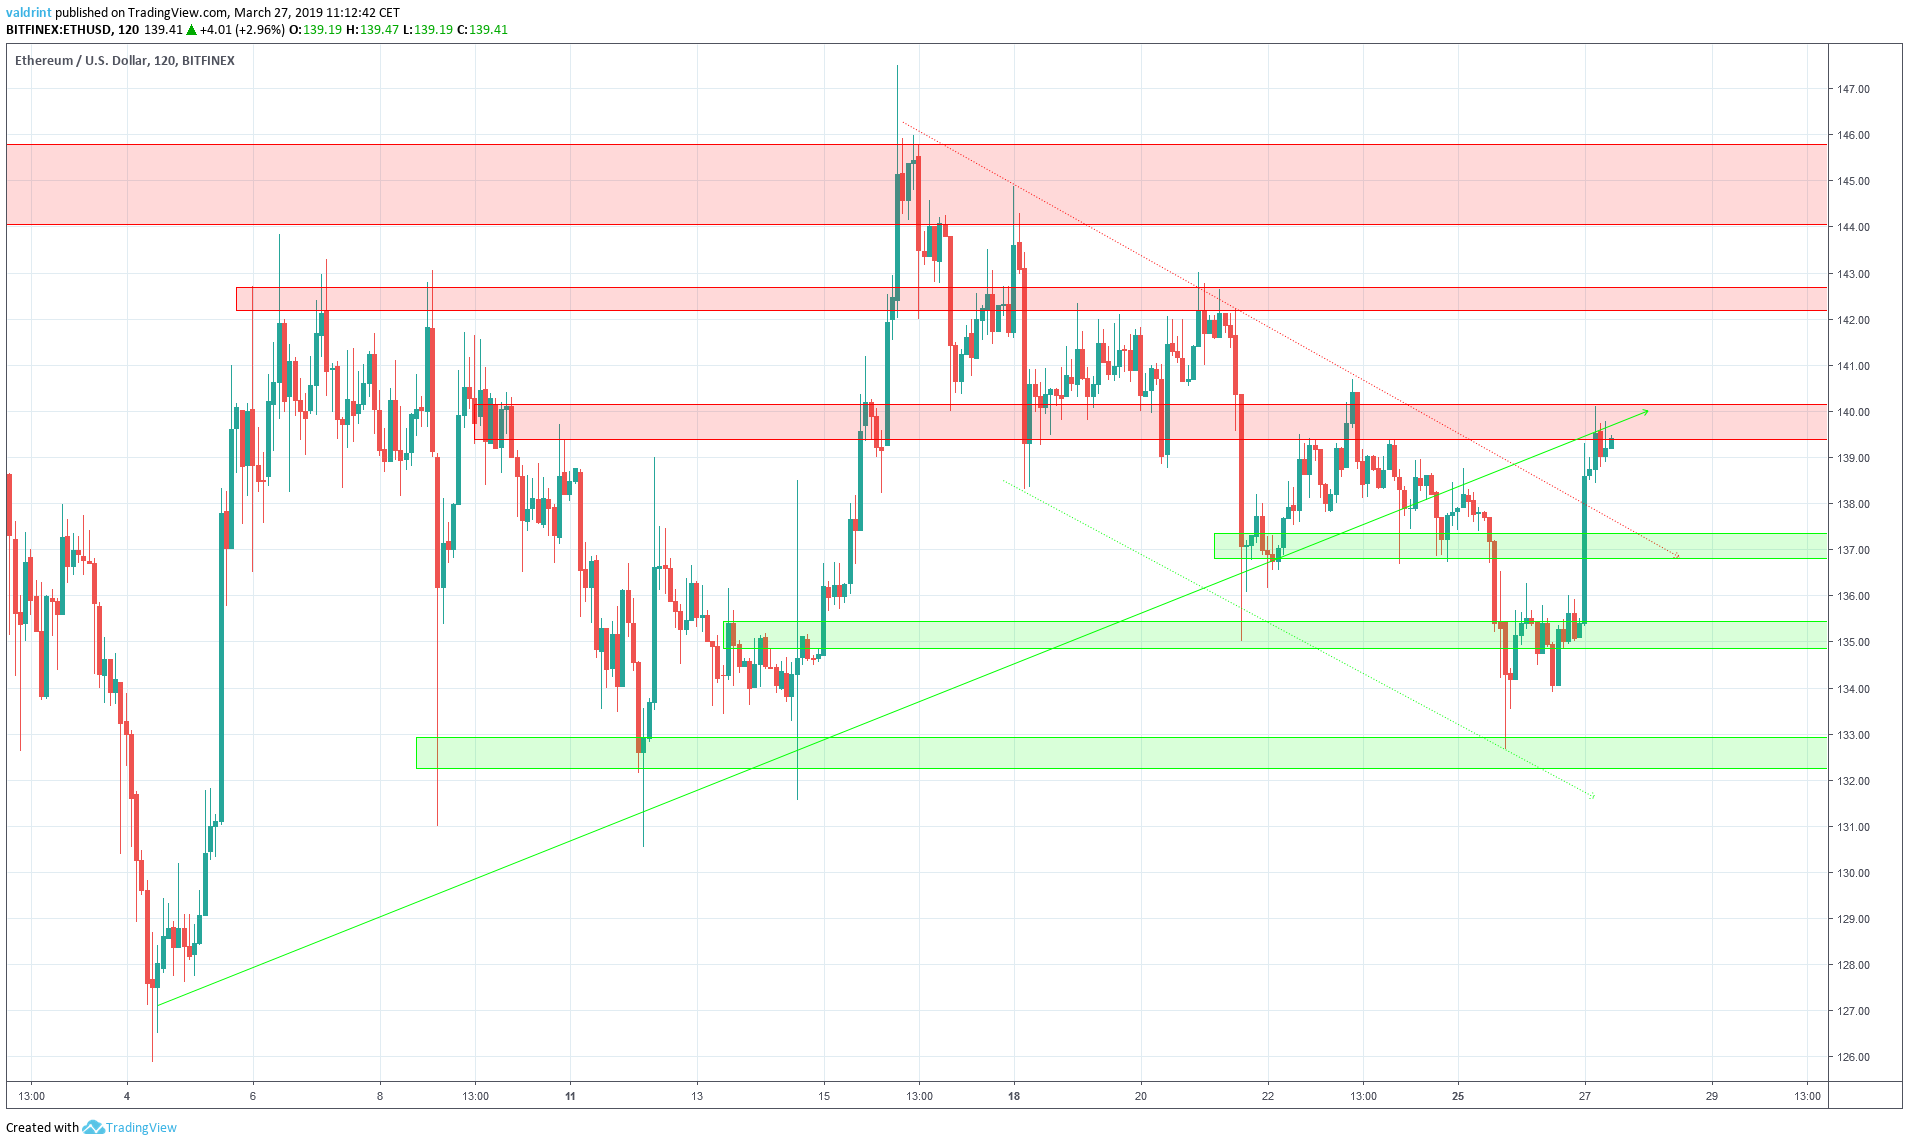
The first resistance area is located near $140, where the price is currently trading. A second minor resistance area is found near $143, while the main resistance area is found near $145. We do not expect the price to breakout of the first resistance area and reach the second and third one.
The closest support area is found near $137 followed by support areas near $133 and $128. According to our analysis, it is likely that the price reaches at least one of these areas.
Summary of Analysis
Based on this analysis, the price of ETH may drop to the closest support line and create a new trading pattern. Gradual price decreases should continue.
If the price reaches the first support line at $137, this prediction will be partially validated. This prediction would be invalidated if the price reaches the resistance area at $143.
Do you think ETH will keep increasing? Let us know your thoughts in the comments below.
Disclaimer: This article is not trading advice and should not be construed as such. Always consult a trained financial professional before investing in cryptocurrencies, as the market is particularly volatile.
