


Ethereum (ETH) has been rejected by a long-term resistance area at ₿0.084, but is in the process of making another breakout attempt.
Despite trading close to a significant resistance area, long-term indicators show strength, indicating that the trend is still bullish.
Long-term ETH movement
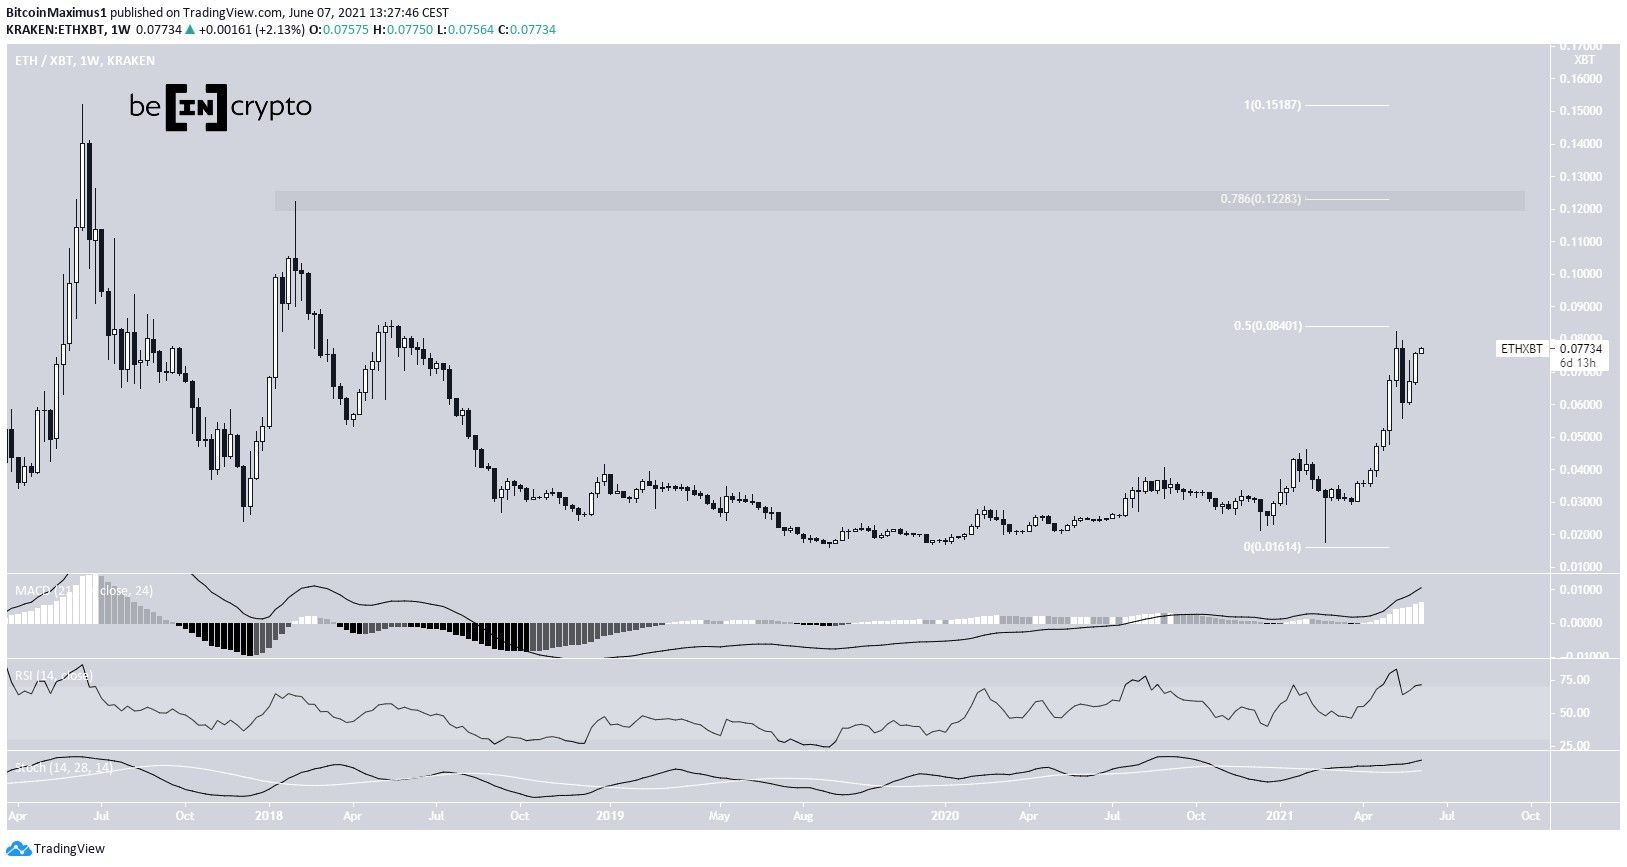
On May 14, ETH reached the long-term ₿0.084 resistance area and was rejected. The area is the 0.5 Fib retracement level of the entire downward movement, measuring from the all-time high price of April 2017.
Despite the decrease, ETH has regained the majority of the losses and is close to making another breakout attempt.
Technical indicators are bullish. While the RSI has fallen below 70, both the MACD and Stochastic oscillator are increasing. The next resistance is at ₿0.122, the 0.786 Fib retracement level and the 2018 highs.
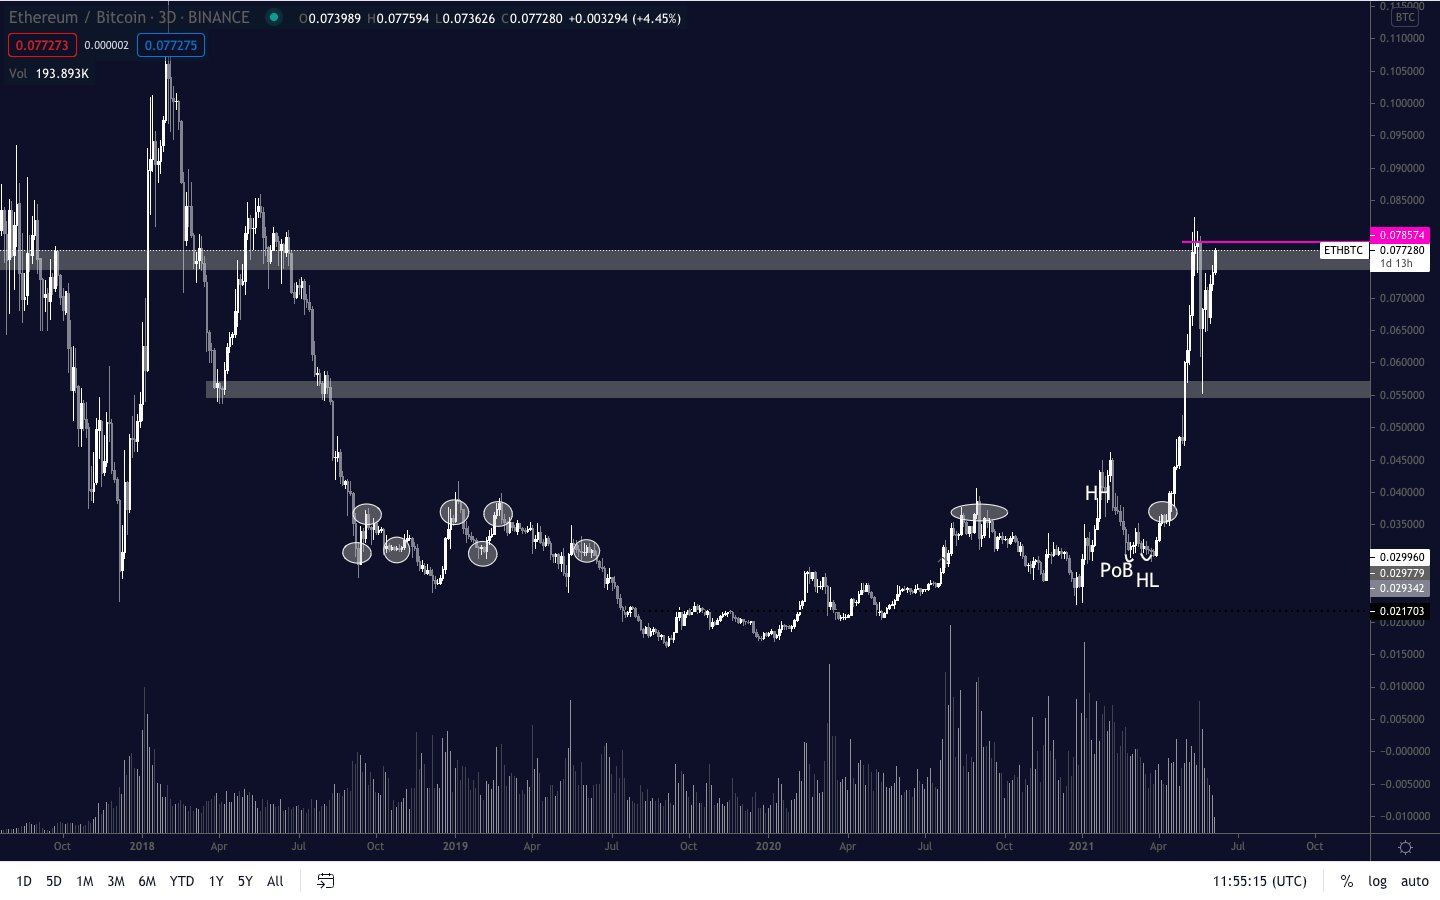
Cryptocurrency trader @Pentosh1 outlined an ETH/BTC chart, which shows the price being close to a long-term resistance. This is the same resistance area created by the 0.5 Fib retracement level.
Fourth wave pullback
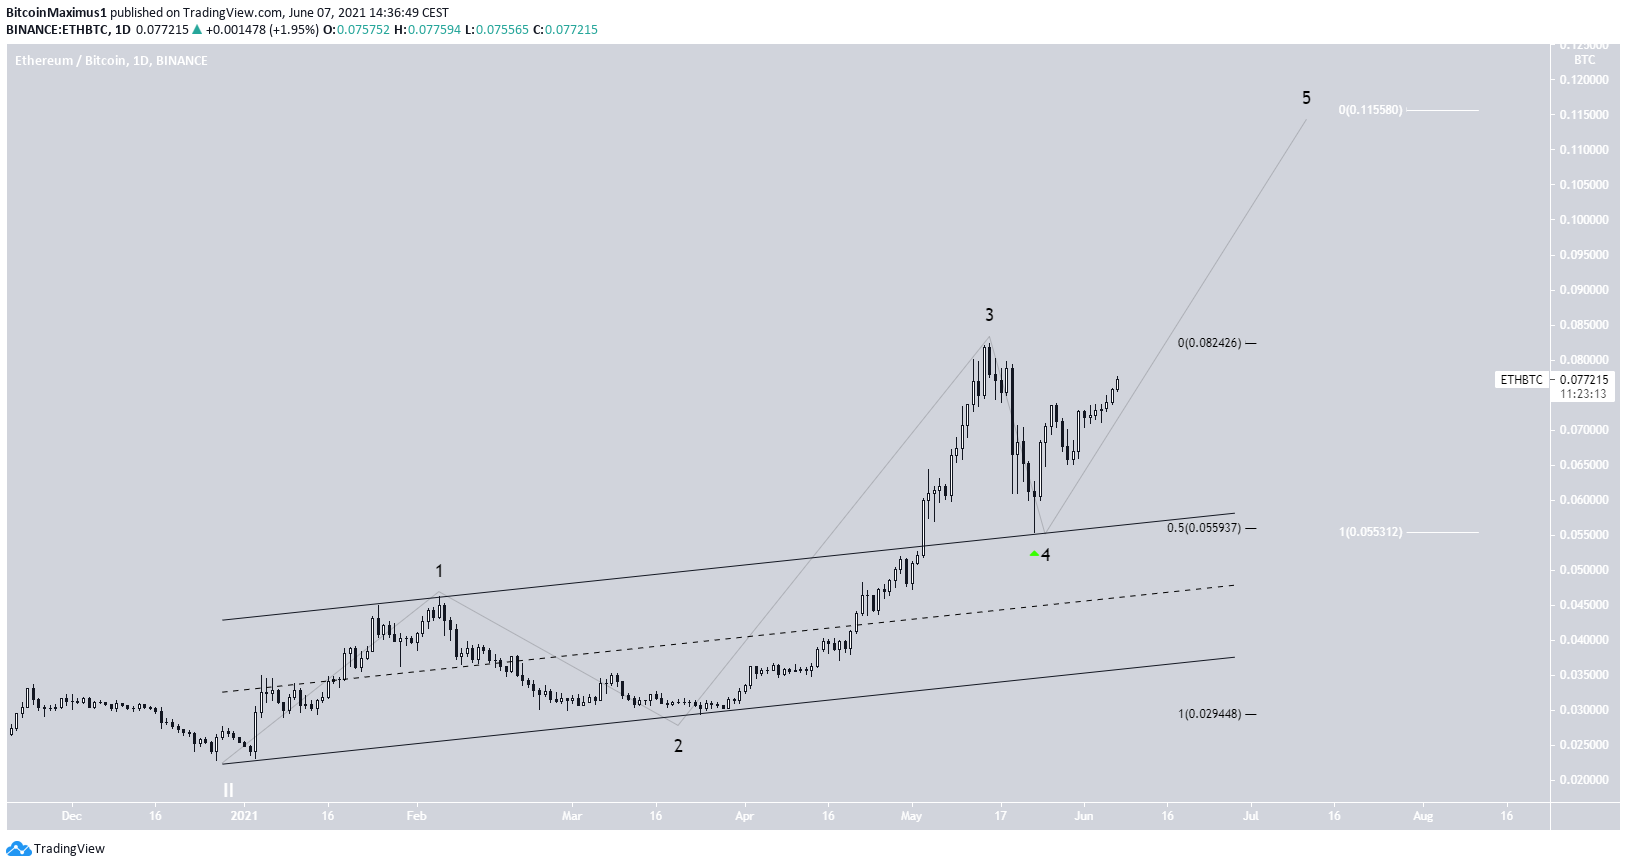
Technical indicators in the daily chart are also bullish. This is especially evident by the bullish cross in the Stochastic oscillator (green icon). The MACD and RSI are also moving upwards.
The price action shows that ETH has either completed a fourth wave pullback or is still in wave four of a bullish impulse.
The May 19 bounce at the resistance line of the channel suggests that wave four is complete (green icon). If correct, wave five could take the price all the way to ₿0.115, close to the previously outlined long-term resistance at ₿0.122.
Future ETH movement
Despite the bullishness in both long- and medium-term indicators, the shorter-term-six hour show that ETH is trading inside resistance.
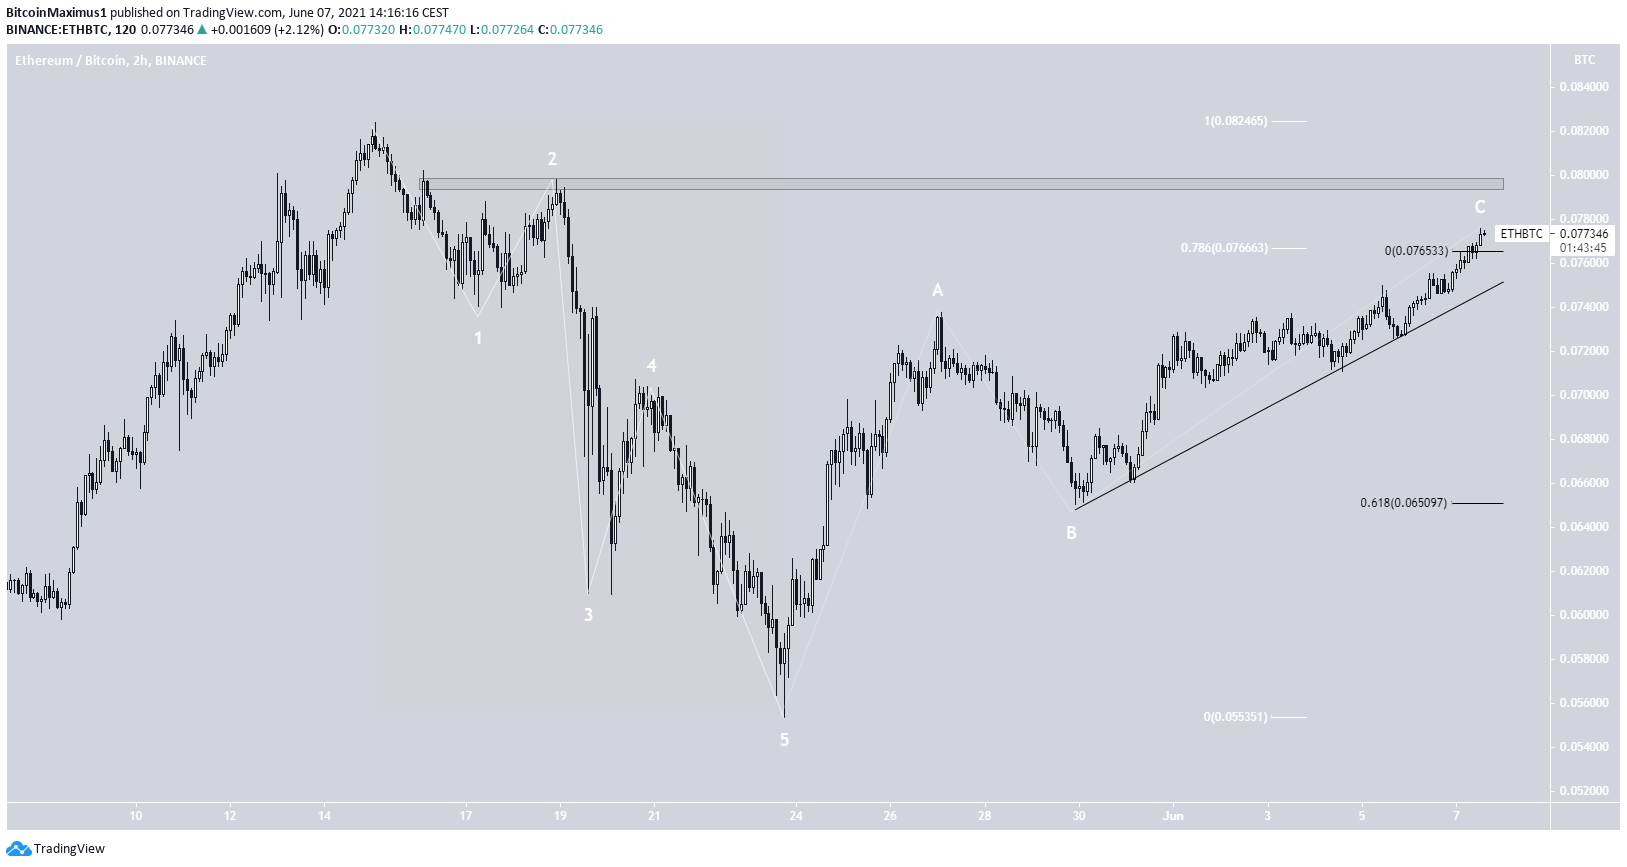
Furthermore, the downward movement looks like a complete bearish impulse. Therefore, it is likely to have been the first portion of a larger correction. In that case, the current upward movement is an A-B-C corrective structure.
Currently, ETH is trading at the 0.786 Fib retracement resistance at ₿0.076. If the upward movement were to reach a top here, it would also give waves A:C a 1:0.61 ratio, common in such structures. In addition to this, there is horizontal resistance at ₿0.0795.
A breakdown from the short-term ascending support line would confirm this. Therefore, while both the weekly and daily charts look bullish, it is possible that ETH will fall once more, before resuming its upward movement.
It is worth noting that there is no clear weakness even in lower time-frames. Therefore, until a breakout from the short-term ascending support line occurs, the trend remains bullish.
For BeInCrypto’s latest bitcoin (BTC) analysis, click here.



