The Ether (ETH) price began an increase on Sept. 24 which is still ongoing. However, the price has not yet confirmed that it has begun an upward trend, making it likely that the current increase is corrective.
Bullish Engulfing Candlestick
The ETH price has been decreasing since a high of $489.57 on Sept. 1, following a descending resistance line.
On Sept. 5, the price reached a low of $311.04, creating a minor support area at $315 and began an upward move, which was short-lived. The price revisited the $315 area once more on Sept. 24 and created a bullish engulfing candlestick.
Despite the increase, technical indicators are not yet bullish. The RSI is below 50 and the Stochastic Oscillator has rejected a bullish cross. While the MACD is increasing, it has not crossed into positive territory yet.
If the price were to break out from the descending resistance line, it would be expected to find resistance once more at $385. A breakout above this area would suggest that the trend is bullish, since it would likely cause a bullish cross in the Stochastic Oscillator.
Short-Term Movement
Cryptocurrency trader @Altcoinsherpa outlined an ETH chart, stating that while the long-term trend is likely bullish, he expects a short-term decrease.
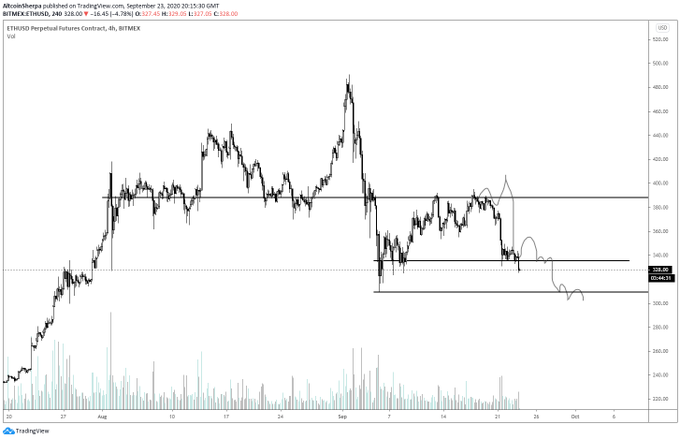
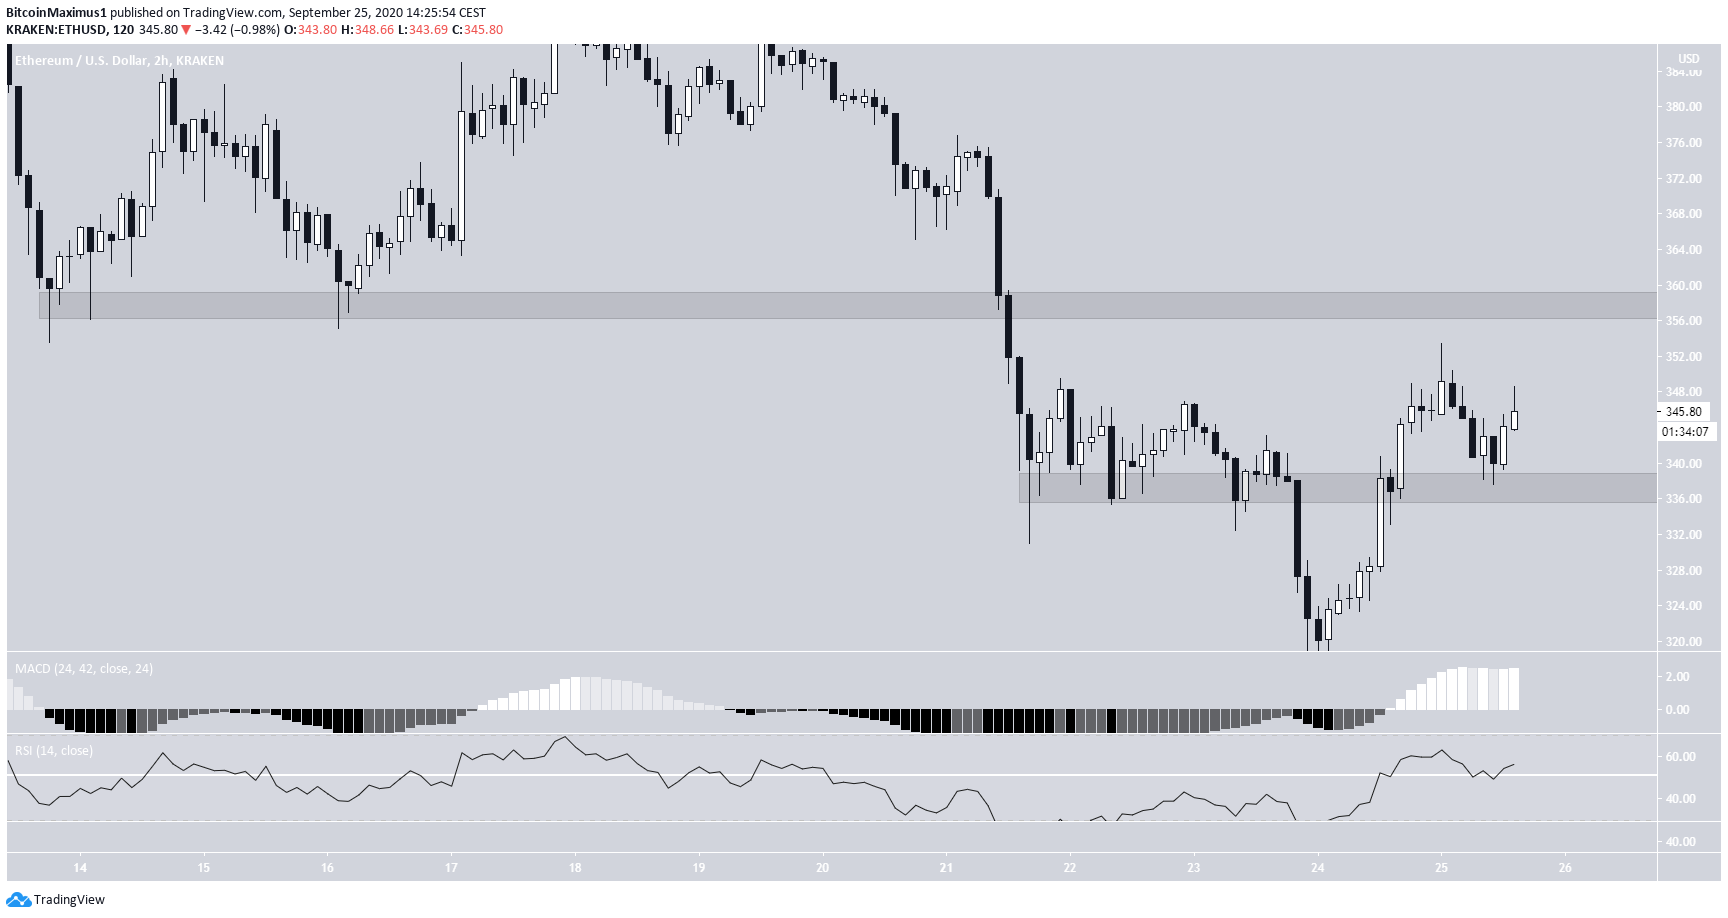
However, since the tweet, the ETH price has reclaimed the minor $336 area, which previously acted as support.
Technical indicators are turning bullish, since both the RSI & the MACD are increasing, the former being above 50.
The closest resistance area is found at $358, and an increase above it would suggest that the trend is bullish.
Wave Count
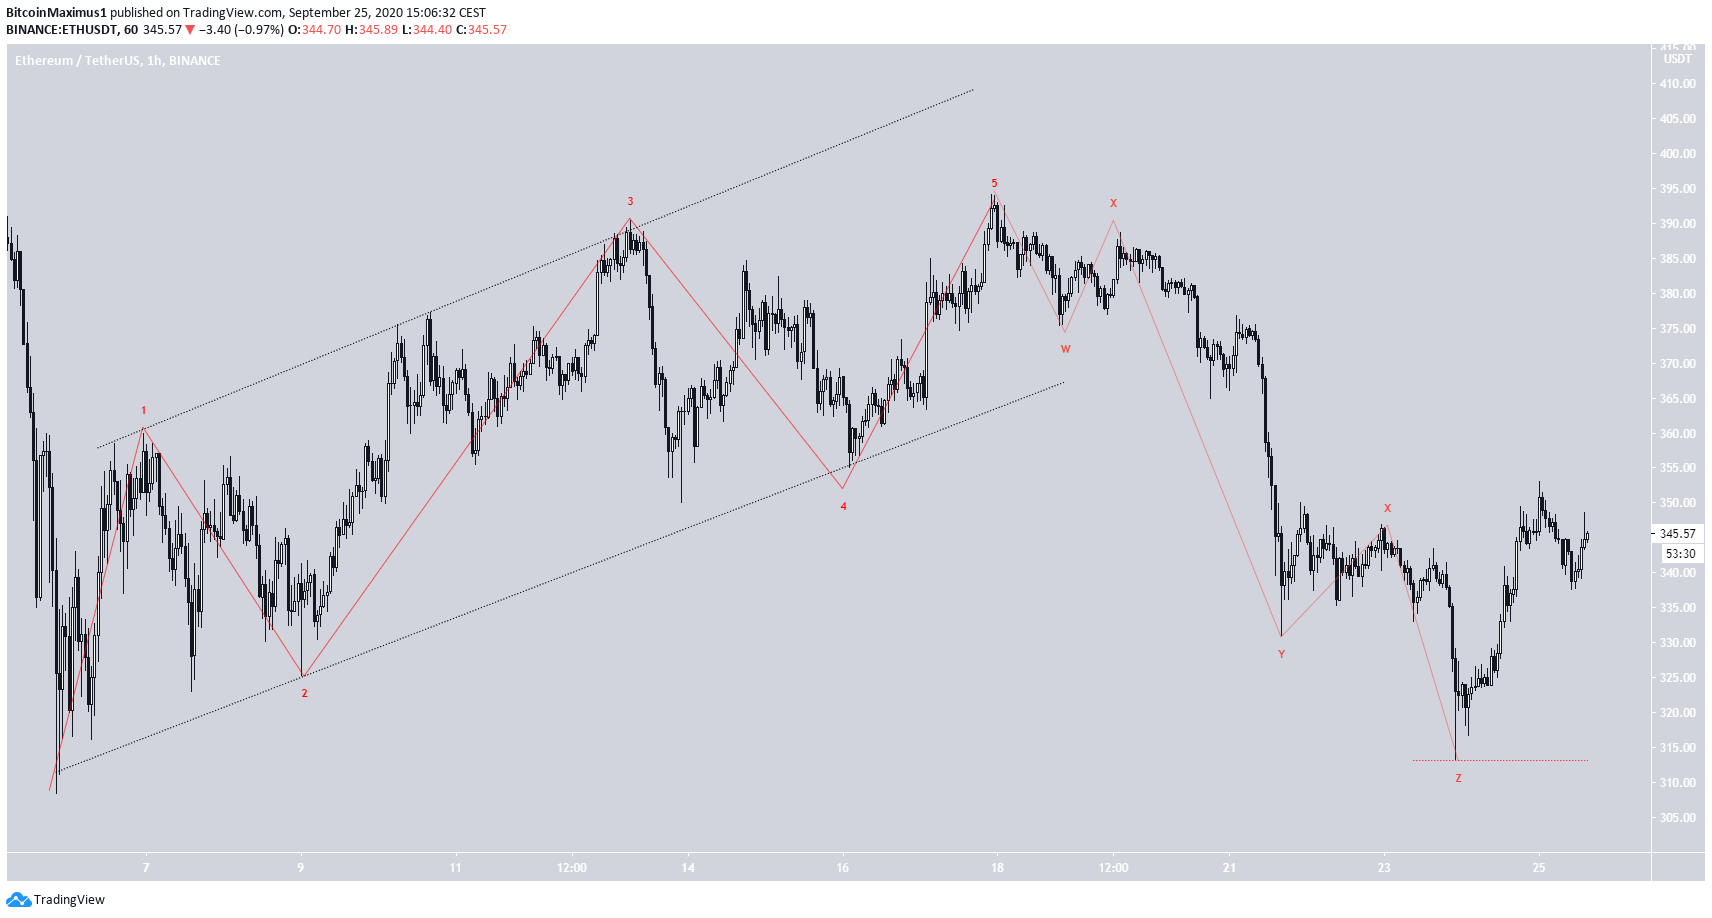
The wave count since Sept. 17 suggests that the trend is still bearish. The decrease until Sept. 24 looks impulsive (in red below), and while yesterday’s increase also looks impulse, it could very well be the A wave of an A-B-C correction.
If so, the $363 area would be expected to act as resistance once the price gets there.
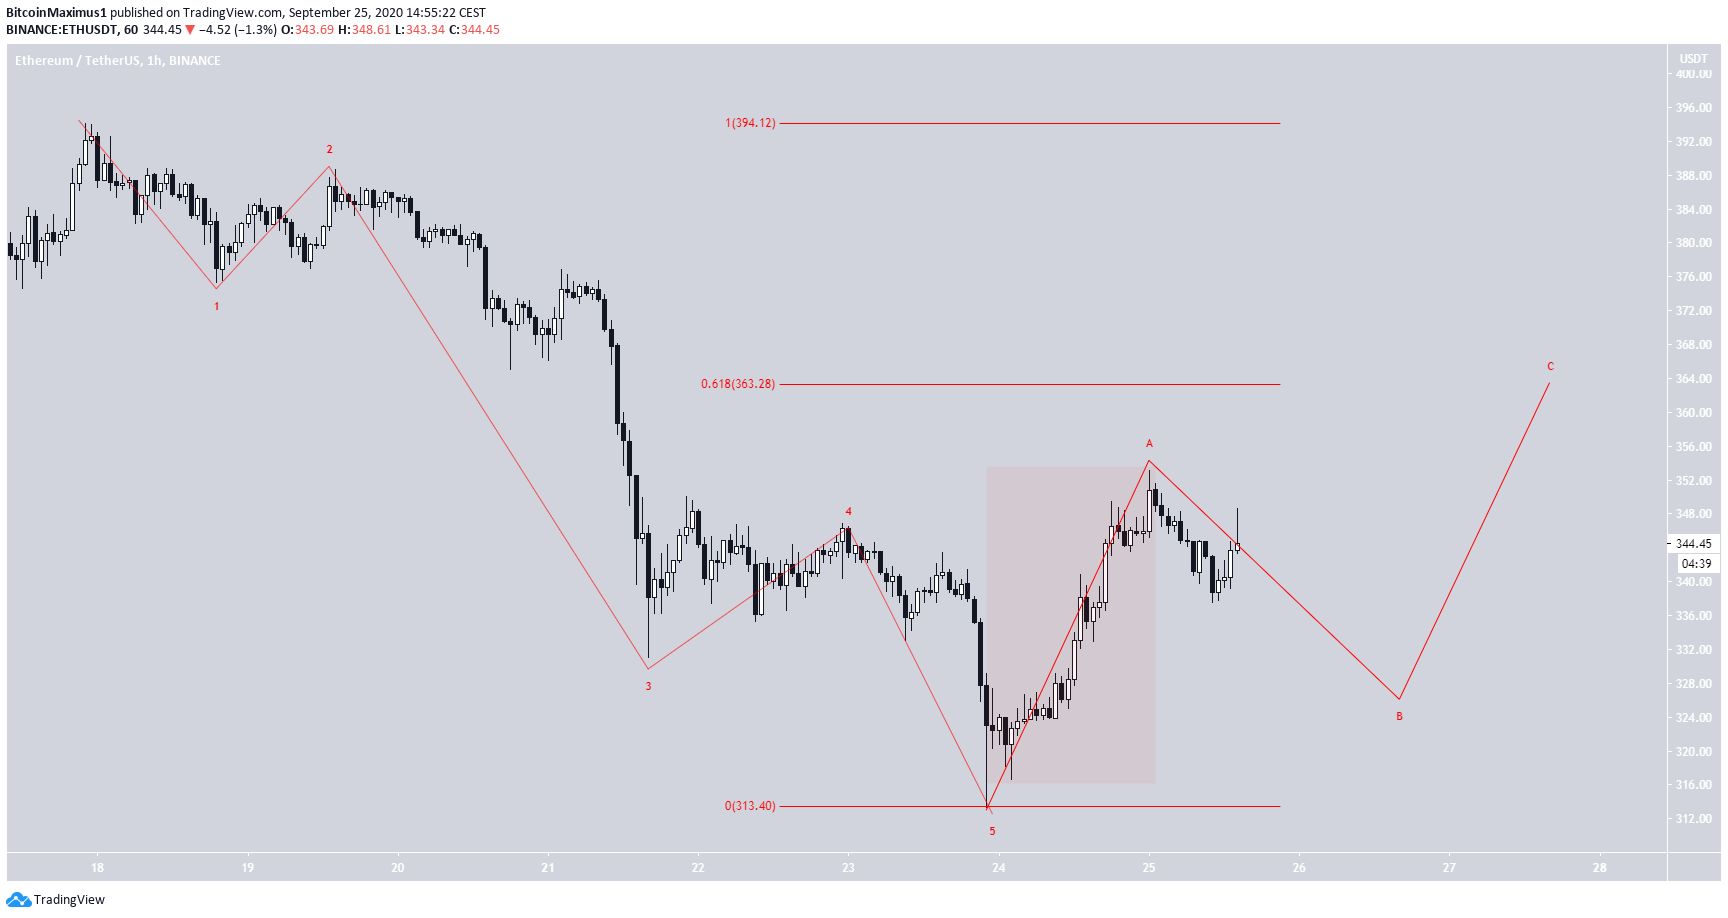
The only way in which the formation would be the beginning of a new impulse is if the price completed a leading diagonal (in red below), which was followed a triple zigzag correction (W-X-Y-X-Z). This formation would be invalidated by a decrease below yesterday’s low at $313.29.
ETH/BTC
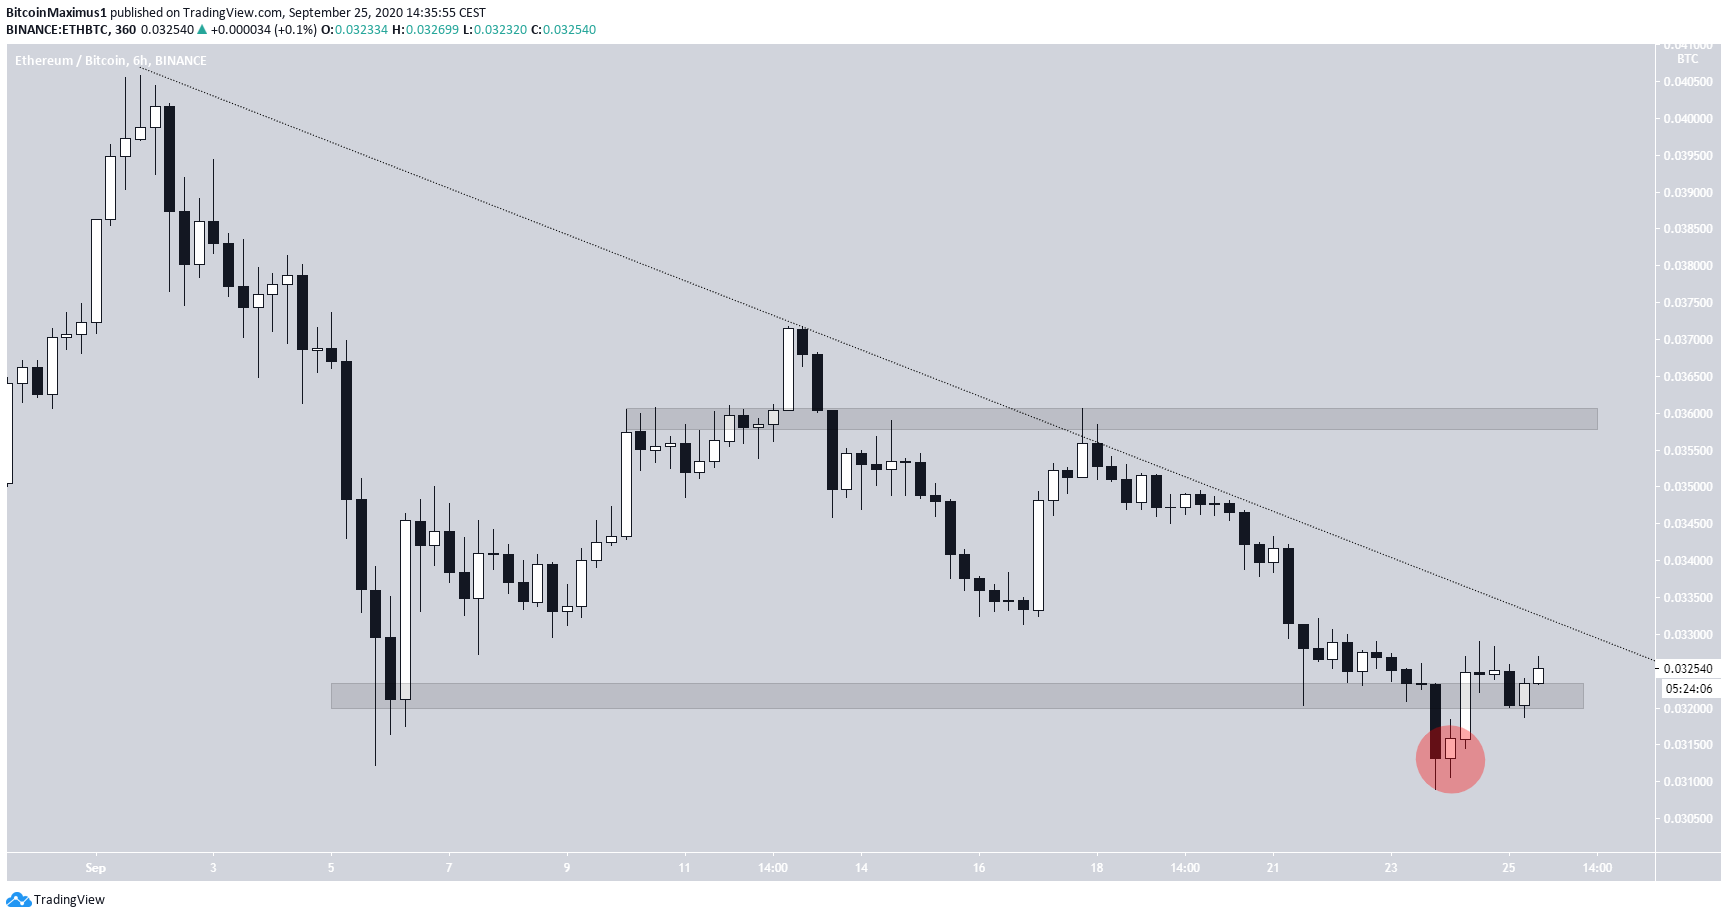
The ETH/BTC chart looks more bearish than its USD counterpart. The price has not created a bullish engulfing candlestick nor are there any reversal signs in the daily time-frame.
However, the price has possibly deviated and then reclaimed the ₿0.0322 support area. If so, it would be a major bullish development that would suggest ETH is likely to head higher.
If the price breaks out from the descending resistance line, it could increase all the way to ₿0.036.