


The ETC price is following a short-term ascending support line and has currently made a double top relative to the January 17 high. A breakout above this area would likely take the price to 15,000 satoshis.
Highlights
- The ETC price is following a short-term ascending support line.
- There is a possible double top developing.
- The 100- and 200-day moving averages (MA) have made a bullish cross.
- There is support at 10,400 & 9400 satoshis.
- There is resistance at 13,500 & 15,000 satoshis.
Cryptocurrency trader @CryptoNTez outlined the ETC price chart and noted that rather than re-testing the previous breakout level, the ETC price has continued to increase instead. He considers the growing volume as a bullish sign, and he is looking for a re-test to enter the trade.
update on $ETC
Retest never happened, straight up to target at ~124k sats..
Volume growing again (bullish)Looking for any retest or R/S Flip as an entry for a potential higher target #ETC pic.twitter.com/2UAjkHteSb
— Nico (@CryptoNTez) January 28, 2020
Will the ETC price pullback to allow the re-entering? If so, where is the optimal level to do so? Keep reading below to find out.
ETC Parabolic Increase
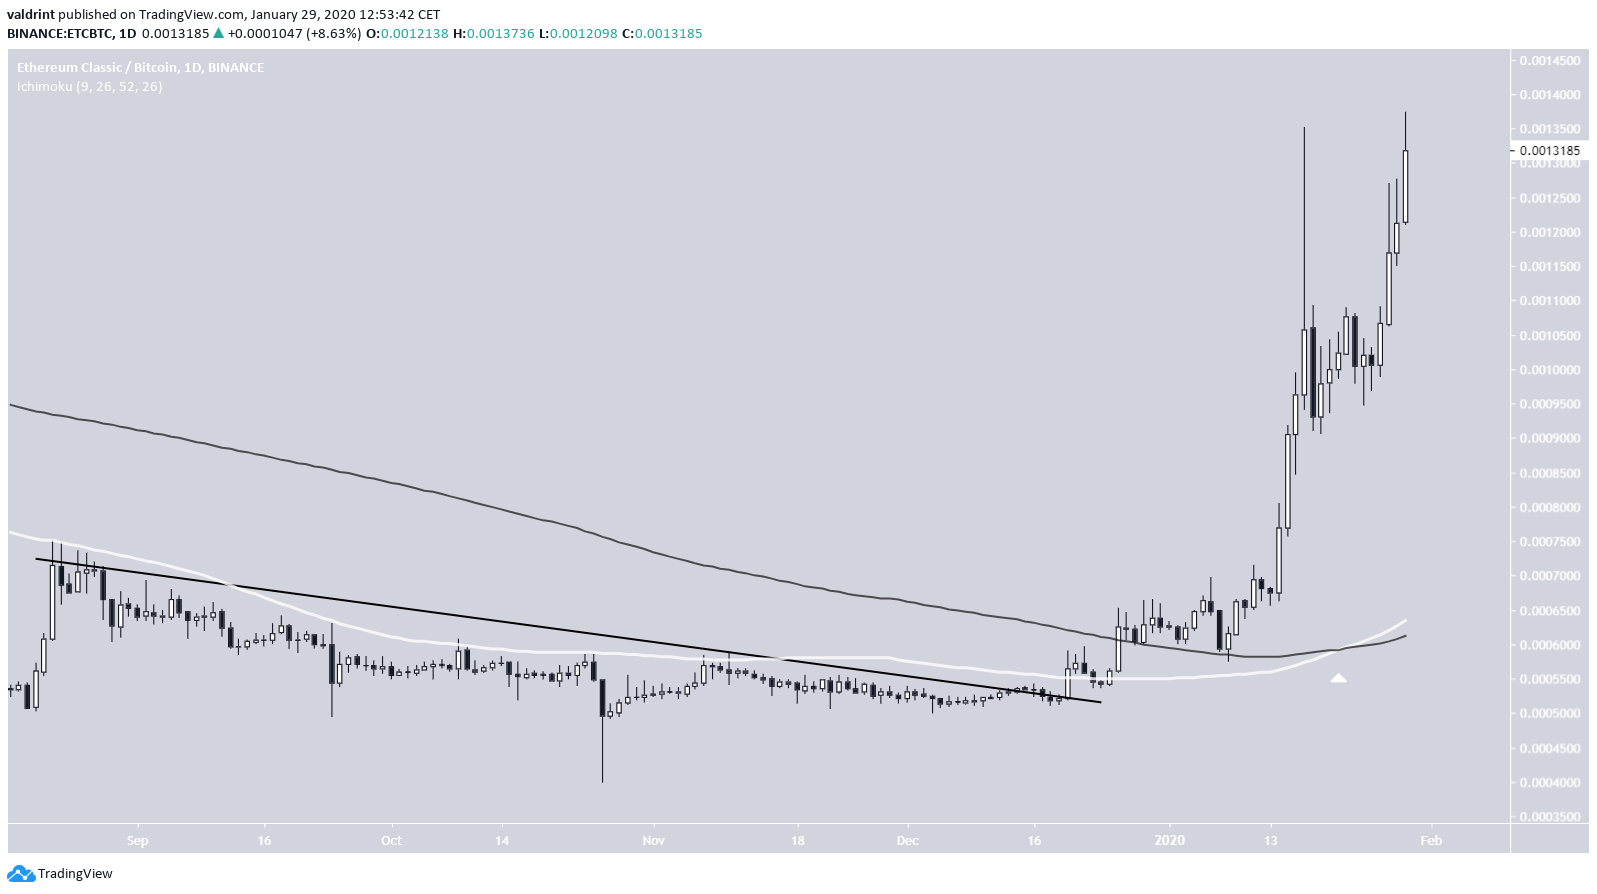
The ETC price increase can be traced to December 20, 2019, when the price broke out above the long-term descending resistance line. Since then, the upward movement has become quite parabolic.
A bullish sign is given by the 100- and 200-day moving averages (MA), which have made a bullish cross.
But, the price is considerably above both MAs, so if it were to decrease and validate them as support, it would entail an almost 50% decrease from the current price, depending on where the MAs are at that time.
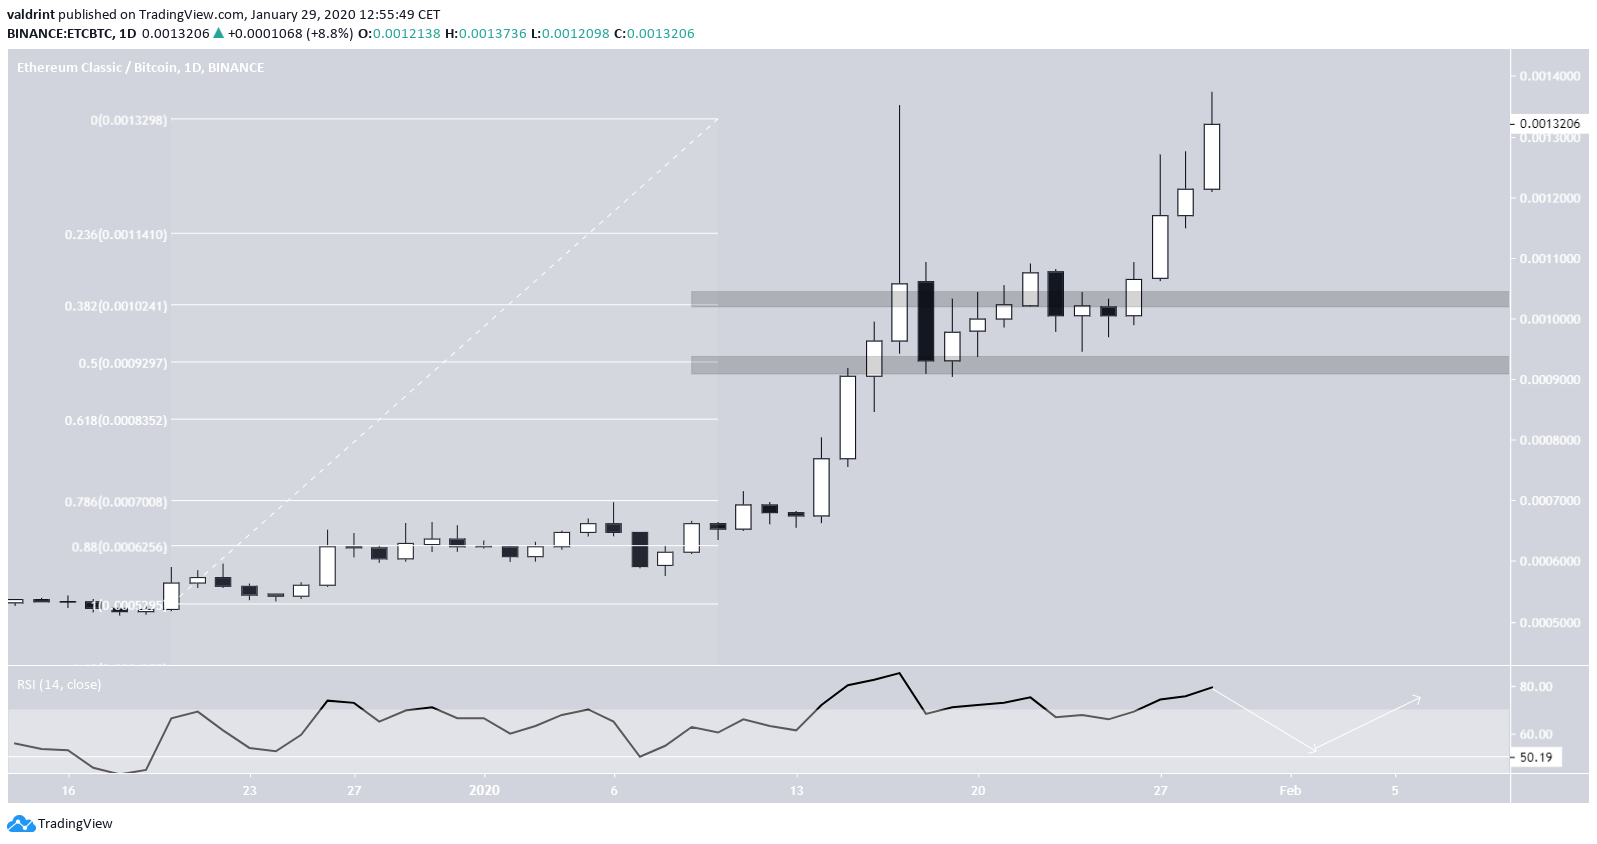
Looking closer at the movement, we can see that the daily RSI has reached the overbought region and has generated a slight bearish divergence. However, the divergence is not as pronounced as to confirm the breakdown. In addition, the daily RSI has been above the 50 line for more than a month, a movement it has not done since the 2017/2018 bullish cycle. This suggests that the price could be in the initial phases of an upward trend, as long as the RSI stays above 50.
The price has possibly created a double top, but the daily candlestick has yet to reach a close. If the price were to decrease, the closest resistance areas would be found at 10,400 and 9400 satoshis, coinciding with the 0.382 and 0.5 fib levels.
This hypothetical decrease would likely cause the RSI to fall towards the 50 line, where a bounce is expected. With this in mind, let’s take a closer look at the short-term movement to determine if the rally has any strength left.
Ascending Support
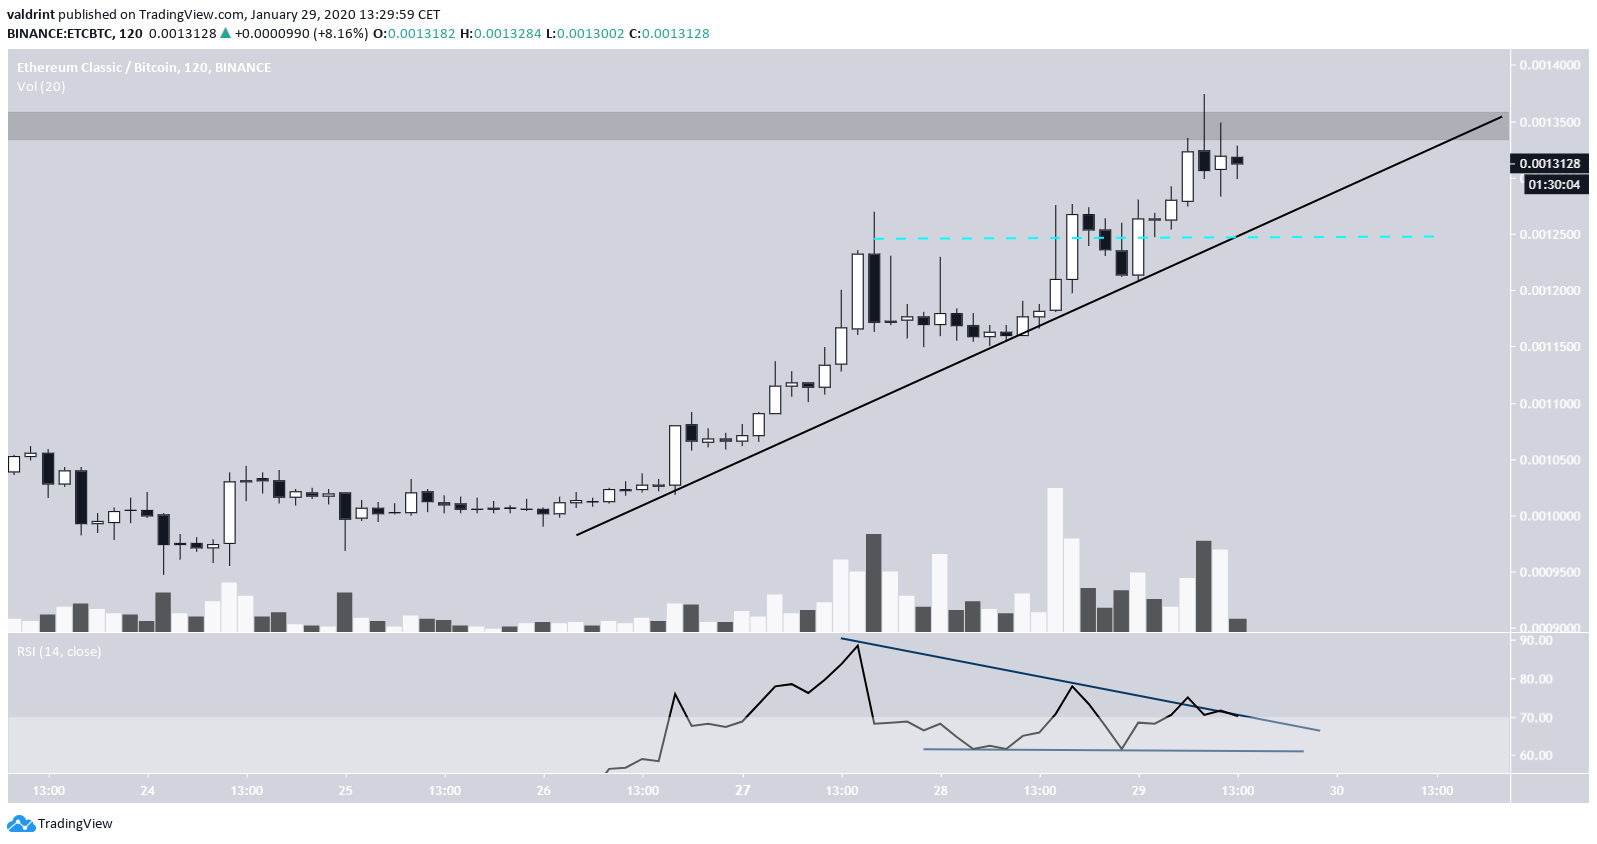
The ETC price has been following an ascending support line since January 26 and has reached the double top resistance area at 35,00 satoshis. The RSI has generated bearish divergence and has created a descending triangle.
However, this is somewhat offset by the increasing volume, making the outlook neutral. In any case, placing a stop loss below 12,500 satoshis is recommended to prevent from rapid losses in case the price breaks down, with the aim of re-entering at one of the support areas outlined above. This would present the case outlined in the tweet, in which a pullback allows to re-enter the trade.
ETC Future Movement
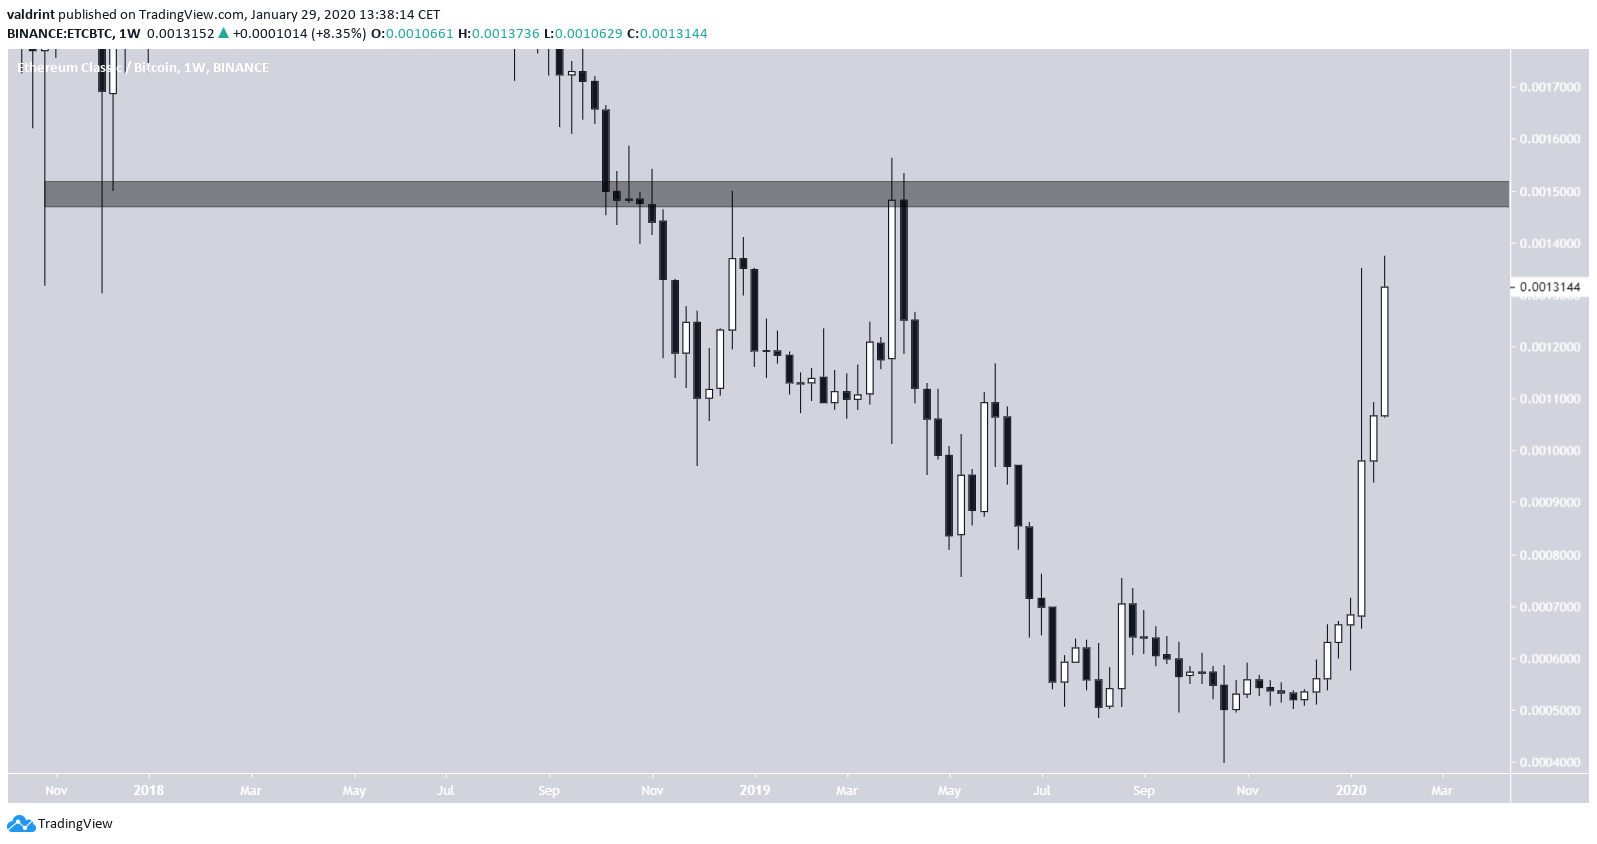
In case the price continues to move upward, we believe the 15,000 satoshis would present the upper limit of its increases. This presents the previous breakdown level, and the price has since twice failed to break out above.
We do not think the price will be successful in breaking out above this level, at least not on the first attempt.
To conclude, the ETC price has been increasing in a parabolic fashion since December 20, 2019. We believe the price increase has an upper limit of 15,000 satoshis. We have a relatively neutral outlook on whether the price will be successful in breaking out, thus recommend a stop loss placement below 12,500 satoshis to mitigate losses in case of a rapid price decrease.


