


Ethereum Classic (ETC) has fallen below a long-term resistance level but has bounced. The direction of the trend remains unclear for now.
IOTA (IOTA) is trading inside a strong support level at $0.92. While there are no clear bullish reversal signs, the possibility of a reversal looks stronger than that for ETC.
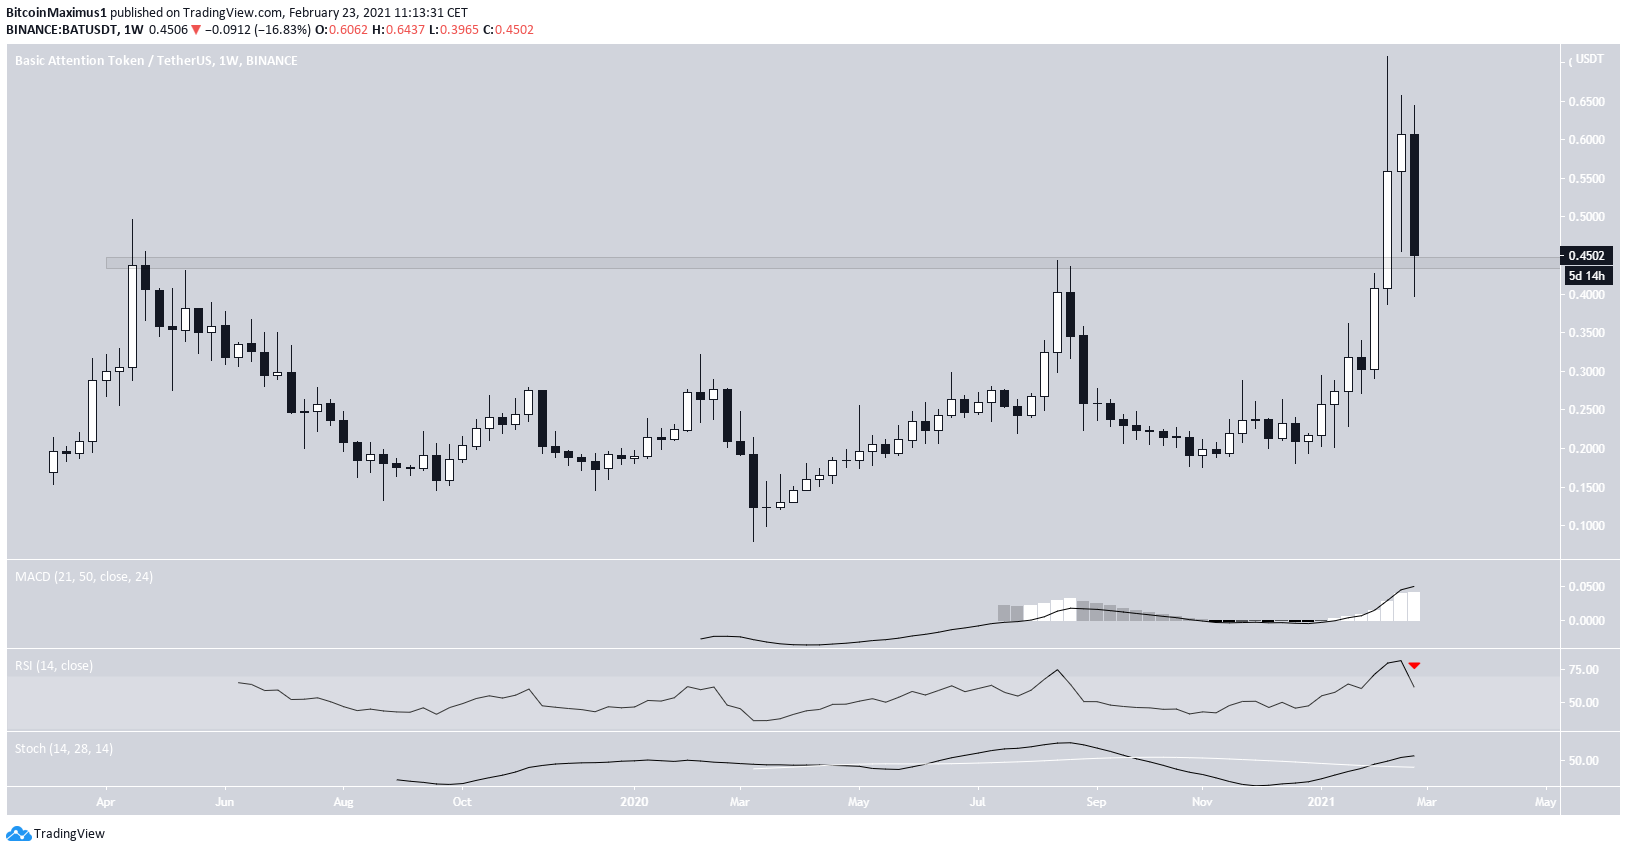
Basic Attention Token (BAT) has fallen considerably since its all-time high of $0.70 but is currently in the process of validating the previous all-time high resistance area as support.
Ethereum Classic (ETC)
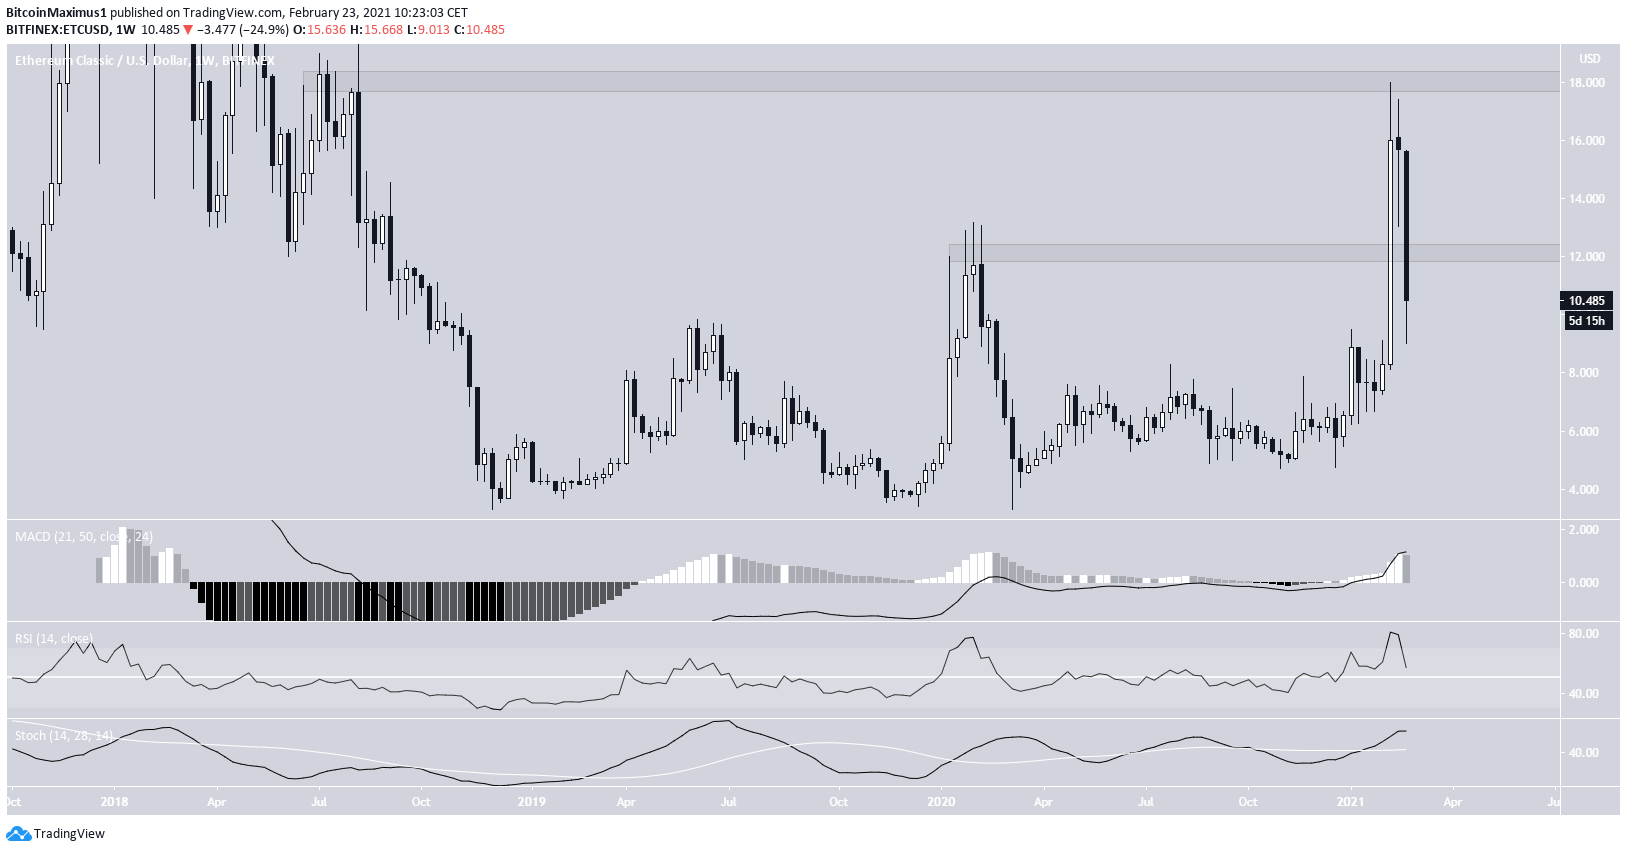
The weekly chart shows that ETC has fallen below the $12 area. This level previously acted as resistance at the beginning of 2020.
While the same area was expected to act as support on the way down, ETC has blown right through it. Nevertheless, there are still five days left until the weekly close, which could allow for ETC to move upwards and reclaim the $12 level.
Technical indicators are neutral, but leaning on bearish. The RSI has fallen below 70 and the MACD has generated a lower momentum bar.
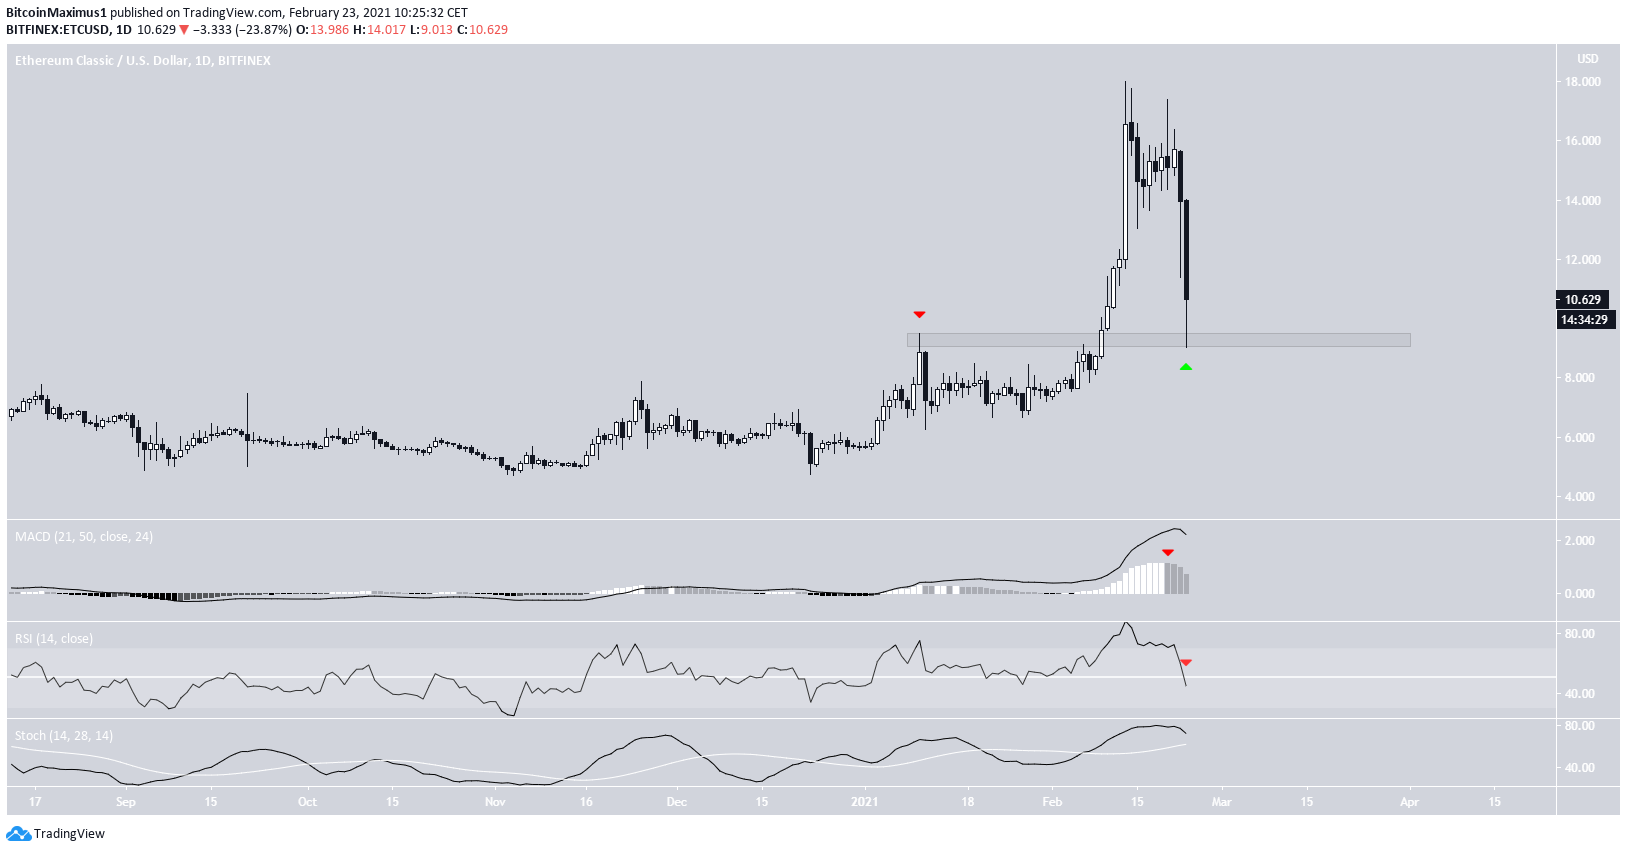
The daily chart shows a cleaner re-test at the $9 area, which previously acted as a resistance.
Despite this being a very likely level for a potential bounce, there are no clear signs that ETC will do so. Technical indicators are gradually turning bearish. A bearish cross in the Stochastic oscillator would likely confirm that the trend is bearish.
Therefore, while some type of bounce is expected from the $9 support, the direction of the trend cannot be accurately determined at the current time.
Highlights
- ETC has fallen below the $12 area once again.
- Technical indicators are leaning bearish.
IOTA (IOTA)
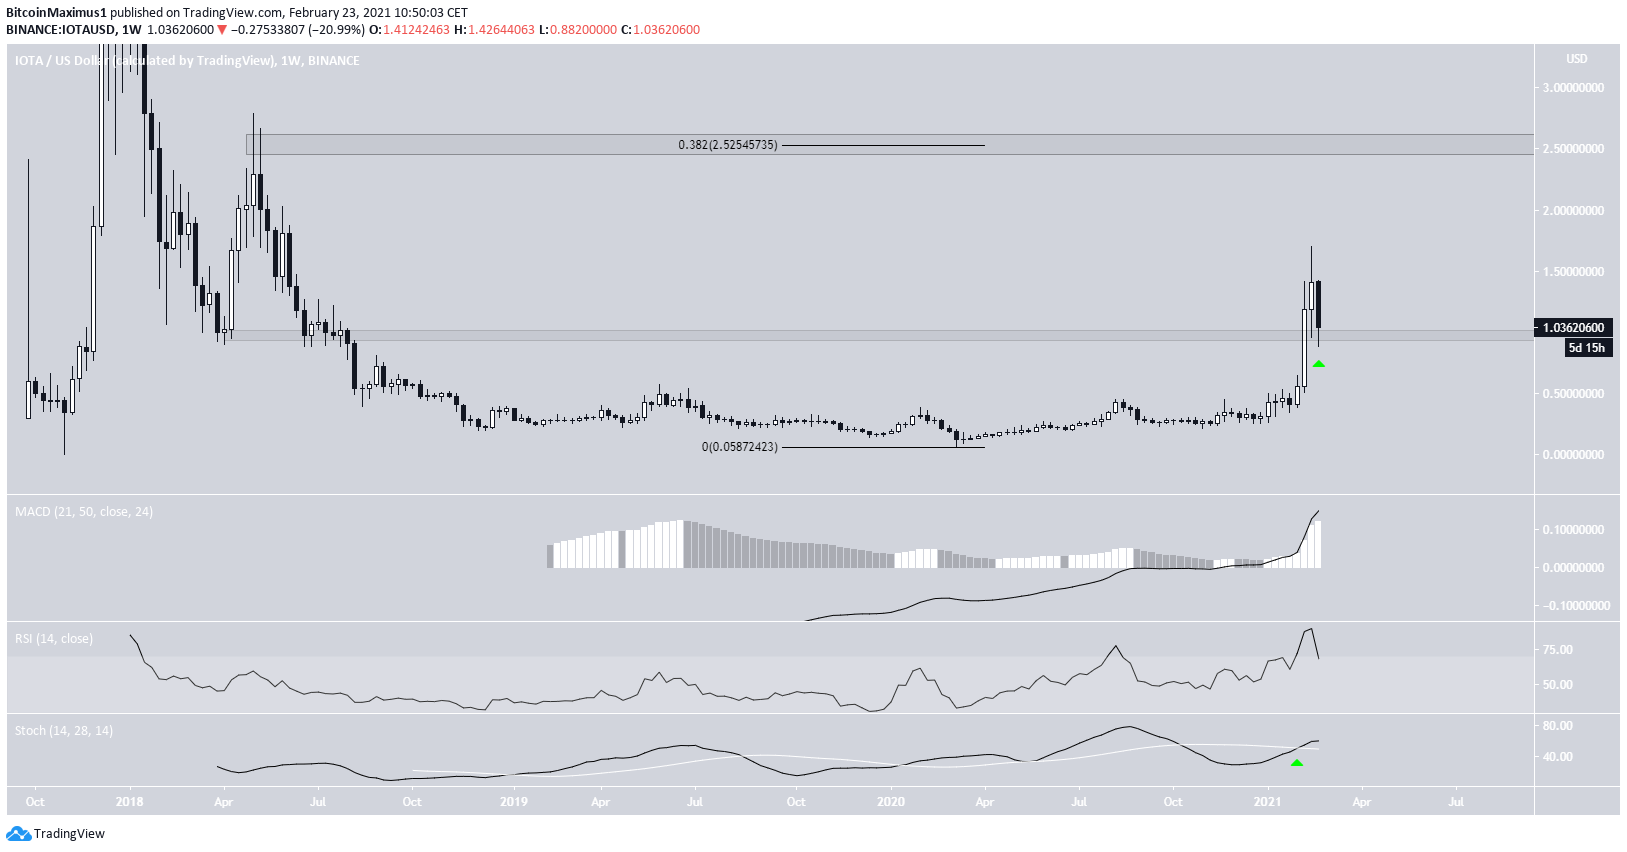
The weekly chart shows that IOTA has decreased considerably since reaching a high of $1.60 last week. It’s still holding above the $0.90 support area and is potentially in the process of creating a long lower wick.
While the RSI is dropping, the Stochastic oscillator has just made a bullish cross and the MACD is increasing. This suggests that the trend remains bullish.
The next closest resistance area is found at $2.52.
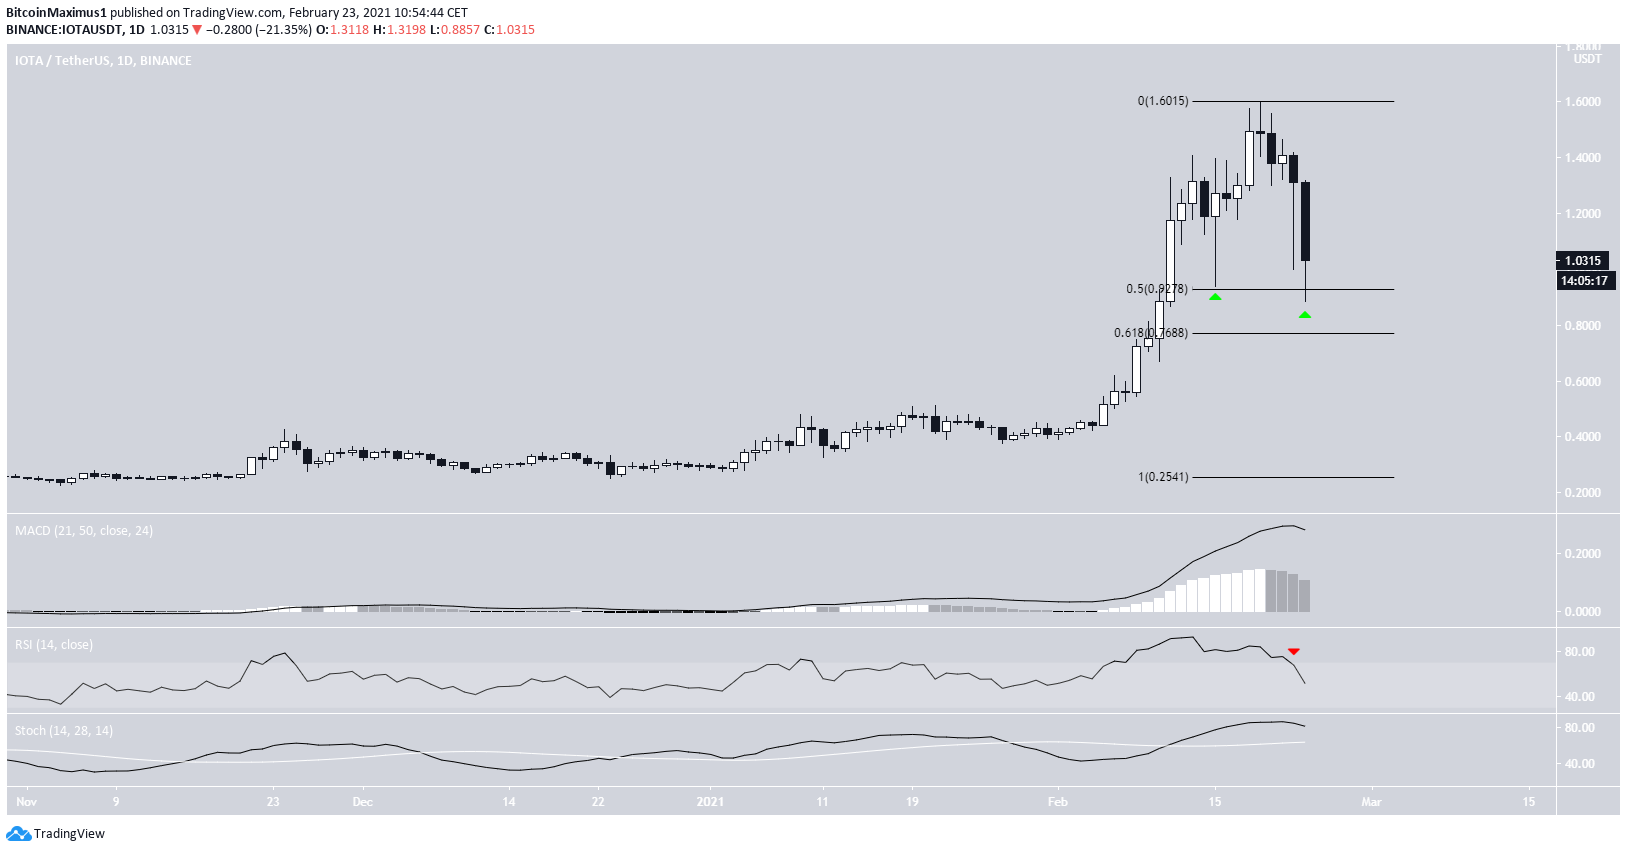
The daily chart supports the possibility of a bounce. The $0.90 area is also the 0.5 Fib retracement level of the most recent upward movement and has provided some relief in the past.
If IOTA were to close the day with a long lower wick, it would be an extremely bullish signal.
While technical indicators are more bearish than those in the weekly time-frame, there are not sufficient signs to confirm a bearish trend reversal. A bearish cross in the Stochastic oscillator or an RSI cross below 50 would change this outlook.
Highlights
- IOTA has bounced at the $0.90 support area.
- A daily close with a long lower wick would confirm a bounce.
Basic Attention Token (BAT)
The weekly chart shows that BAT has been decreasing for its second successive week after reaching an all-time high price of $0.70.
Despite the drop, BAT is still trading above $0.44, which was the previous all-time high resistance area. As long as BAT is trading above this level, the trend is likely to be bullish.
Despite an RSI cross below 70, the MACD and Stochastic oscillator are still bullish.
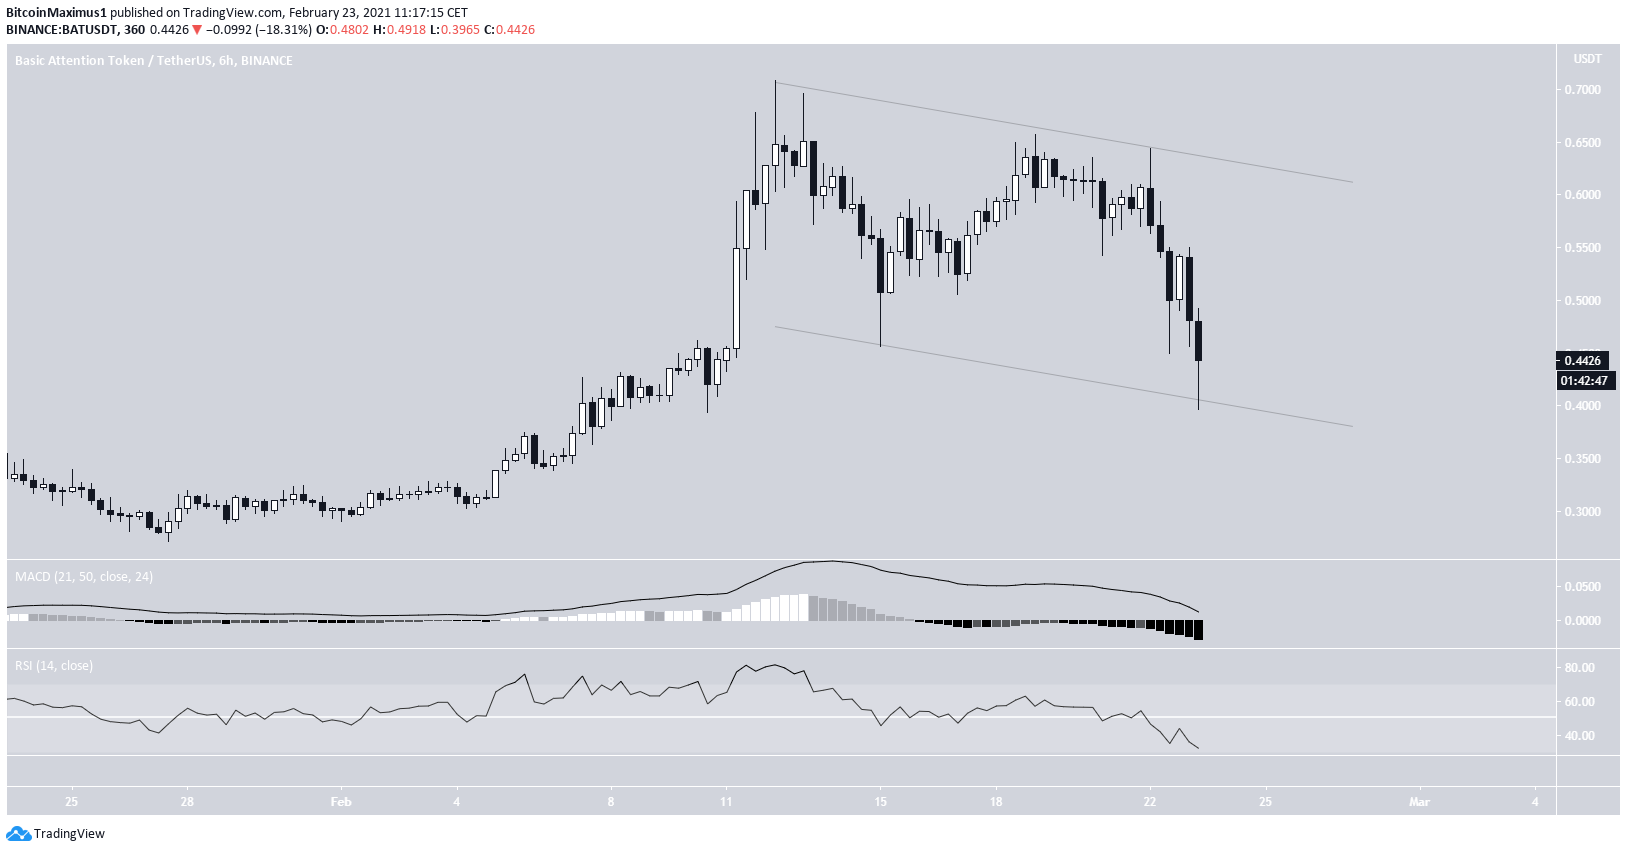
The six-hour chart shows that BAT is also trading inside a parallel descending channel, close to its support line.
Nevertheless, other short-term indicators are bearish.
Since there is a lack of bullish reversal signs, a bounce at this support line is crucial for the possibility of bullish continuation to remain.
Highlights
- BAT is testing the $0.44 level as support.
- BAT is trading inside a short-term parallel descending channel.
For BeInCrypto’s latest Bitcoin (BTC) analysis, click here.


