
On Mar 16, 2019, the price of Ethereum Classic (ETC) made a high of $4.70. It has been on a gradual downtrend without experiencing significant fluctuations since.
Here is a look at the price in the period from Mar 16 to Mar 19: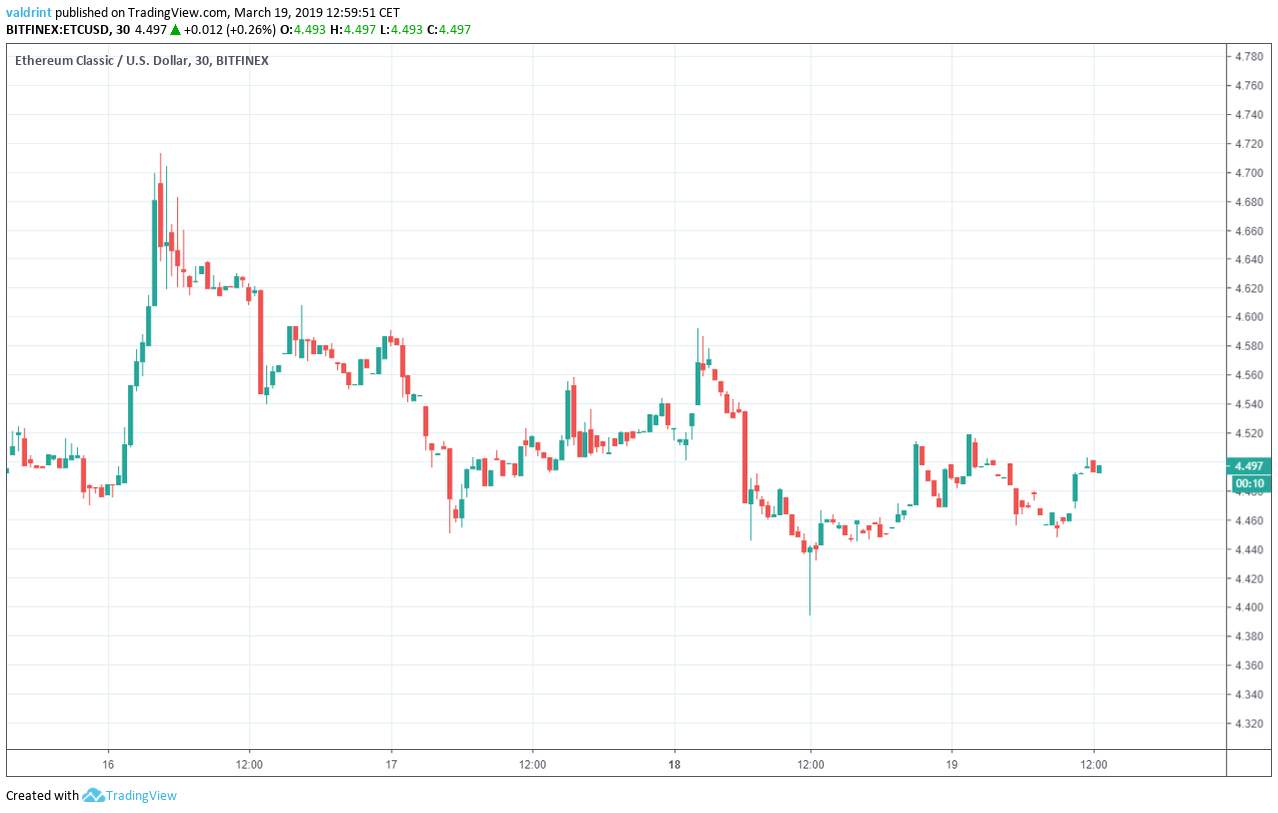 Based on this analysis, price increases are in store for the future of ETC.
Ethereum Classic (ETC): Trends and Highlights for March 19, 2019
- The price made a high of $4.475 on Mar 16.
- It has been on a downtrend since.
- The price is trading inside a descending wedge.
- There is bearish divergence developing in the RSI.
- There is resistance near $4.85 and $4.65.
- There is support near $4.40 and $4.20.
Tracing Support
The price of ETC on Binance is analyzed at 30-minute intervals from Mar 16 to Mar 19. The price of ETC made a low of $4.475 on Mar 16. A rapid upward move occurred first and was followeby by a gradual decrease. The price has made successive lows since. Tracing these lows gives us a descending support line.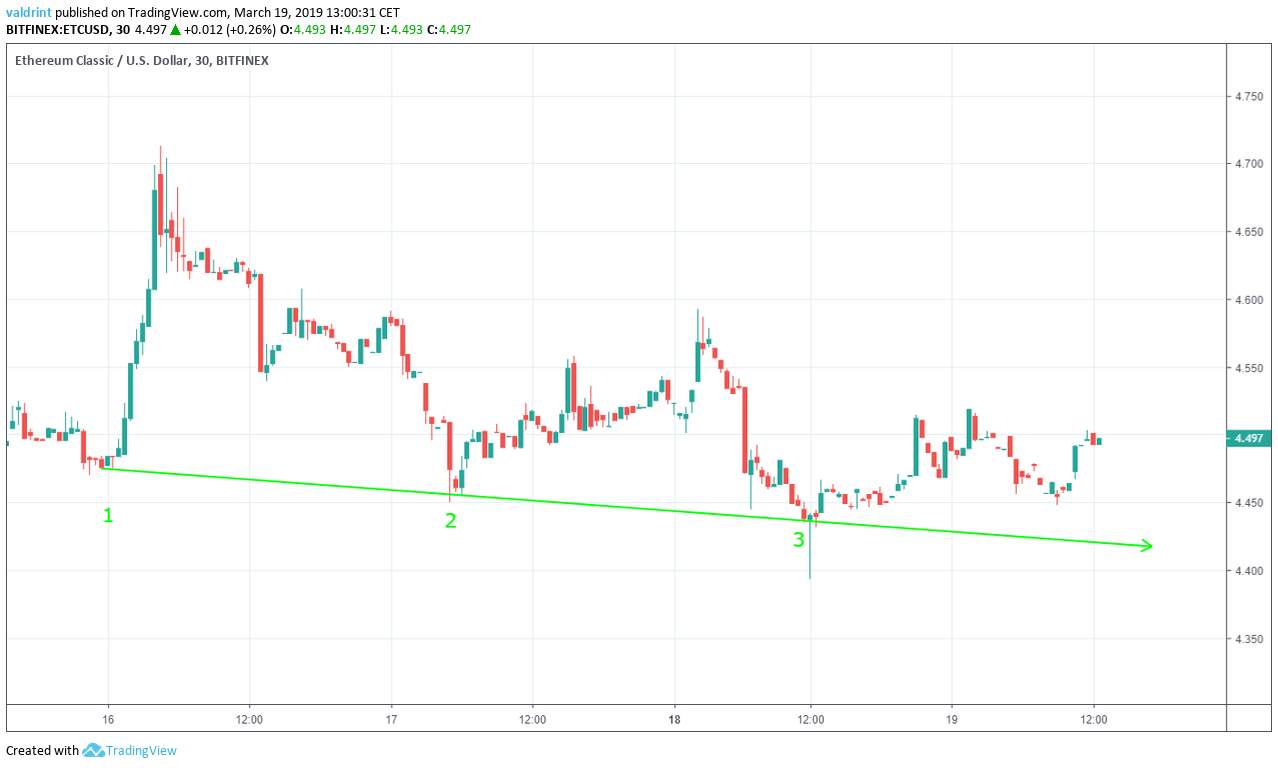 The support line can act as a floor to price, preventing further downward movement. It theoretically traces the lower limits of the price for a given period of time.
It also gauges the rate of decrease of the price. The price of ETC has decreased at the same rate as predicted by the line.
It is likely that the price keeps decreasing at the same rate as predicted by the line, unless a breakdown occurs. The support line alone is not sufficient in predicting if a breakdown will occur.
The support line can act as a floor to price, preventing further downward movement. It theoretically traces the lower limits of the price for a given period of time.
It also gauges the rate of decrease of the price. The price of ETC has decreased at the same rate as predicted by the line.
It is likely that the price keeps decreasing at the same rate as predicted by the line, unless a breakdown occurs. The support line alone is not sufficient in predicting if a breakdown will occur.
Descending Wedge
The price of ETC made a high of $4.713 on Mar 16. Several market cycles have been completed since, with each high being lower than the last. Tracing these highs gives us a descending resistance line. Similar to the support line, the resistance line can act as a ceiling to price, preventing further upward movement, and measuring the price’s rate of decrease.
The resistance and support lines combine to create a descending wedge, which is a bullish pattern, making price increases more likely than decreases.
It is likely that the price trades inside the confines of the ascending wedge until a point of convergence occurs. At that time, it is more likely that the price breaks out from the wedge.
Similar to the support line, the resistance line can act as a ceiling to price, preventing further upward movement, and measuring the price’s rate of decrease.
The resistance and support lines combine to create a descending wedge, which is a bullish pattern, making price increases more likely than decreases.
It is likely that the price trades inside the confines of the ascending wedge until a point of convergence occurs. At that time, it is more likely that the price breaks out from the wedge.
Bearish Divergence
Combining RSI bullish/bearish divergence with support/resistance essentially predicts price fluctuations. The relative strength index (RSI) is an indicator which calculates the size of the changes in price in order to determine oversold or overbought conditions in the market.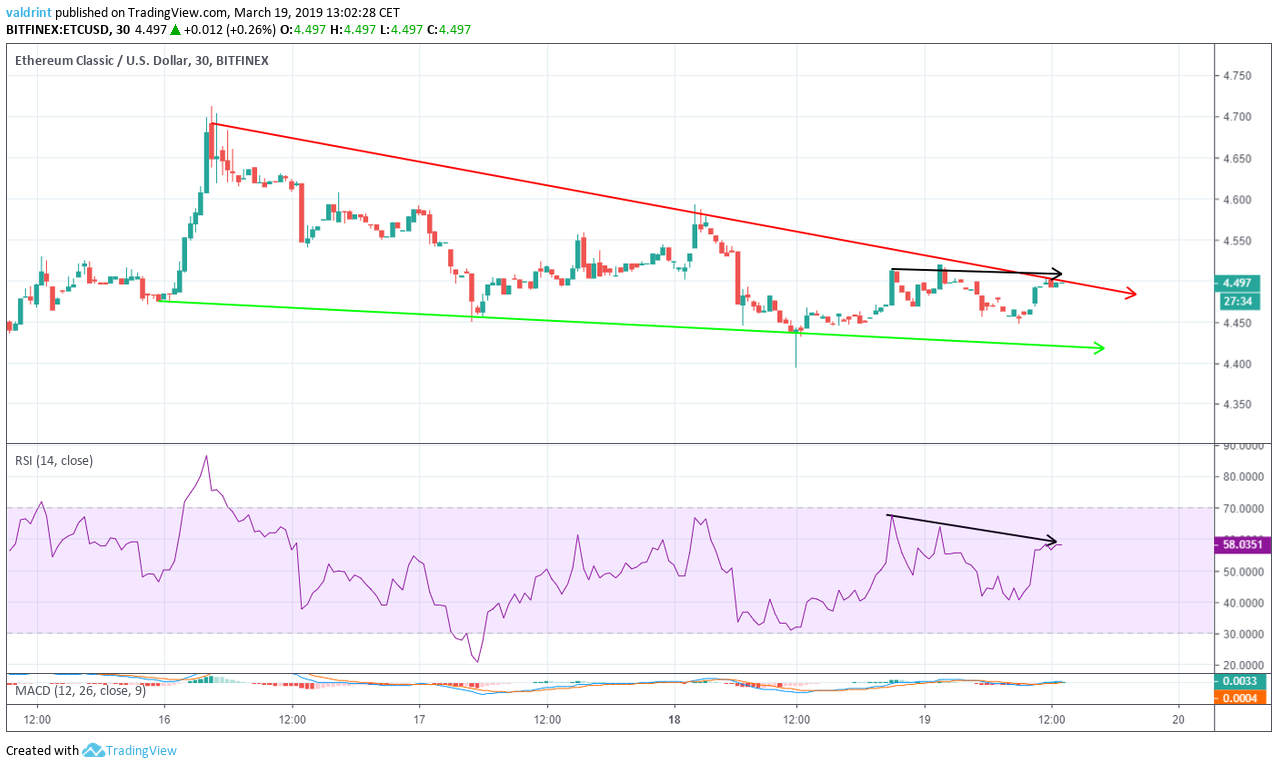 The price of ETC reached a high of $4.5 on March 18. Since then, it has revisited the same level three times.
Similarly, the RSI made the first high on Mar 18. However, it has proceeded to make lower highs since.
This is known as bearish divergence and often precedes a decrease in price.
However, the bearish divergence is occurring in a bullish pattern and is not very significant in amount.
Based on this indicator, it is possible that the price of ETC drops to touch the support line again before a subsequent price increase back toward support. At this time, the convergence between support and resistance should likely occur causing a breakout above resistance. However, it is possible that ETC breaks out prior to a return to the support.
The price of ETC reached a high of $4.5 on March 18. Since then, it has revisited the same level three times.
Similarly, the RSI made the first high on Mar 18. However, it has proceeded to make lower highs since.
This is known as bearish divergence and often precedes a decrease in price.
However, the bearish divergence is occurring in a bullish pattern and is not very significant in amount.
Based on this indicator, it is possible that the price of ETC drops to touch the support line again before a subsequent price increase back toward support. At this time, the convergence between support and resistance should likely occur causing a breakout above resistance. However, it is possible that ETC breaks out prior to a return to the support.
Reversal Areas
The price of ETC on Binance is analyzed at two-hour intervals from Feb 18 to Mar 19, in order to better visualize future reversal areas. Resistance and support areas are formed when the price visits the same level several times.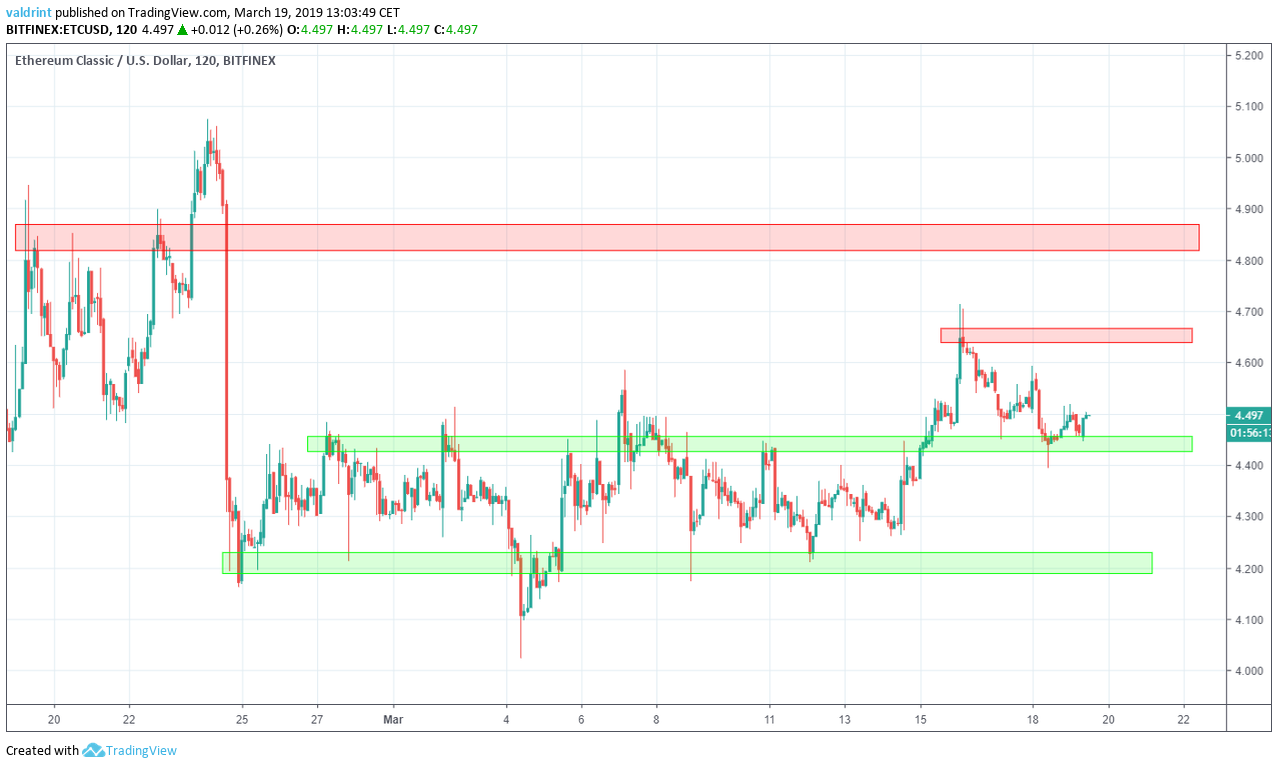 Resistance and support areas are formed when the price visits the same level several times.
The closest area of resistance is found near $4.6, followed by the resistance near $4.85. Based on our analysis, it is likely that the price reaches at least one of these areas.
The closest support area is found near $4.4, where price is currently trading. The second one is found near $4.2. Based on our analysis, it is unlikely that the price reaches the second support area.
Resistance and support areas are formed when the price visits the same level several times.
The closest area of resistance is found near $4.6, followed by the resistance near $4.85. Based on our analysis, it is likely that the price reaches at least one of these areas.
The closest support area is found near $4.4, where price is currently trading. The second one is found near $4.2. Based on our analysis, it is unlikely that the price reaches the second support area.
Summary of Analysis
Based on this analysis, the price of ETC is likely to break out from the descending wedge. If it breaks out, the prediction will be partially validated. If it touches the support line and then breaks out, it will be fully validated. A breakdown from the wedge would invalidate the prediction. What do you think will happen to the price of ETC? Let us know your thoughts in the comments below. Disclaimer: This article is not trading advice and should not be construed as such. Always consult a trained financial professional before investing in cryptocurrencies, as the market is particularly volatile.Disclaimer
In line with the Trust Project guidelines, this price analysis article is for informational purposes only and should not be considered financial or investment advice. BeInCrypto is committed to accurate, unbiased reporting, but market conditions are subject to change without notice. Always conduct your own research and consult with a professional before making any financial decisions. Please note that our Terms and Conditions, Privacy Policy, and Disclaimers have been updated.

Valdrin Tahiri
Valdrin discovered cryptocurrencies while he was getting his MSc in Financial Markets from the Barcelona School of Economics. Shortly after graduating, he began writing for several different cryptocurrency related websites as a freelancer before eventually taking on the role of BeInCrypto's Senior Analyst.
(I do not have a discord and will not contact you first there. Beware of scammers)
READ FULL BIO
Sponsored
Sponsored