


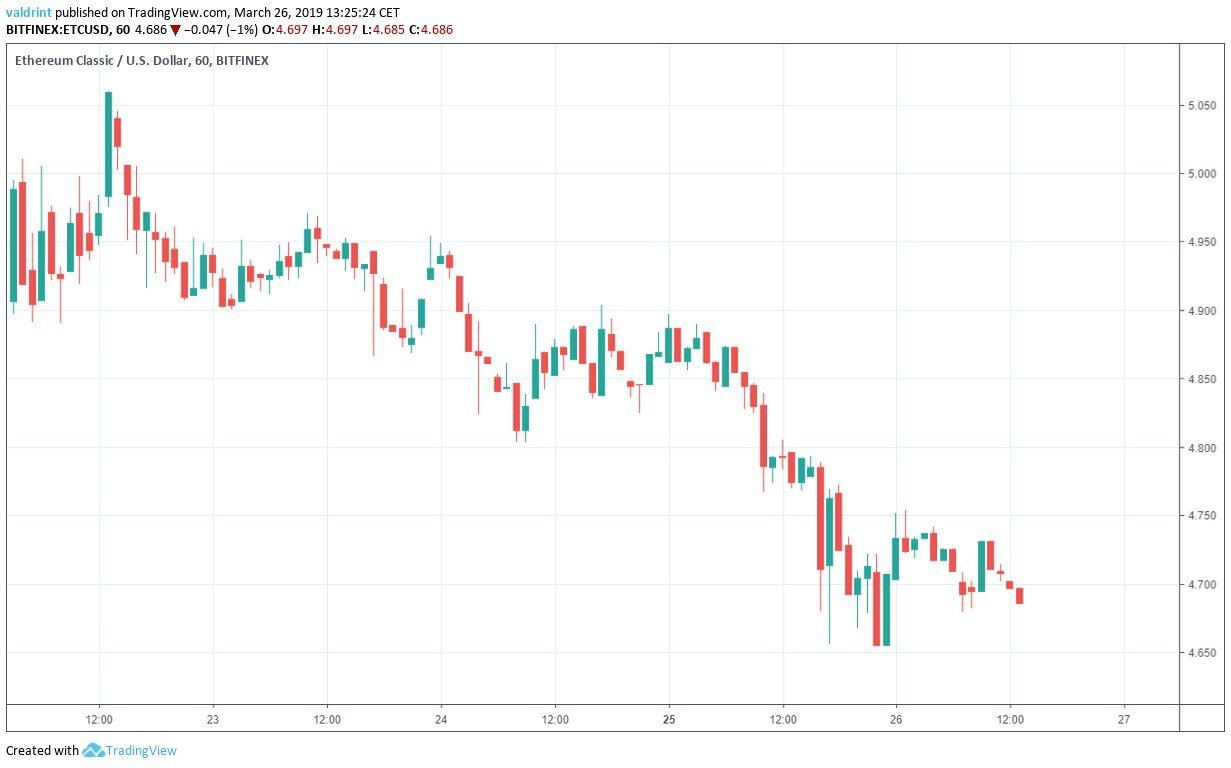
On Mar 22, 2019, the price of Ethereum Classic (ETC) made a high of $5.06. Since then, it has been on a gradual downtrend. At the time of writing on Mar 26, lows near $4.65 had been reached.
As Bitcoin, Litecoin, Ethereum, and other digital assets also experience losses, Ethereum Classic is no exception. Will these price losses continue or will ETC rebound to new heights?
Based on this analysis, it is likely that the price will experience slight increases within its current trading pattern. The pattern is defined after we summarize the key trends and highlights from today’s analysis of Ethereum Classic.
Ethereum Classic (ETC): Trends and Highlights for March 26, 2019
- The price of ETC made a high of $5.06 on Mar 22.
- Ethereum Classic has been on a downtrend since.
- The price recently broke out from a descending wedge.
- ETC is following an ascending support line.
- There is bullish divergence developing in the RSI.
- There is resistance near $4.85 and $5.
- There is support near $4.40 and $4.20.
Tracing Support
The price of ETC on Binance is analyzed at 30-minute intervals from Mar 23 to Mar 26.
On Mar 24, the price of ETC made a low of $4.82 on Mar 24. A gradual upward movement was followed by a gradual decline.
The price has made successive lower lows since. Tracing these lows gives us a descending support line:
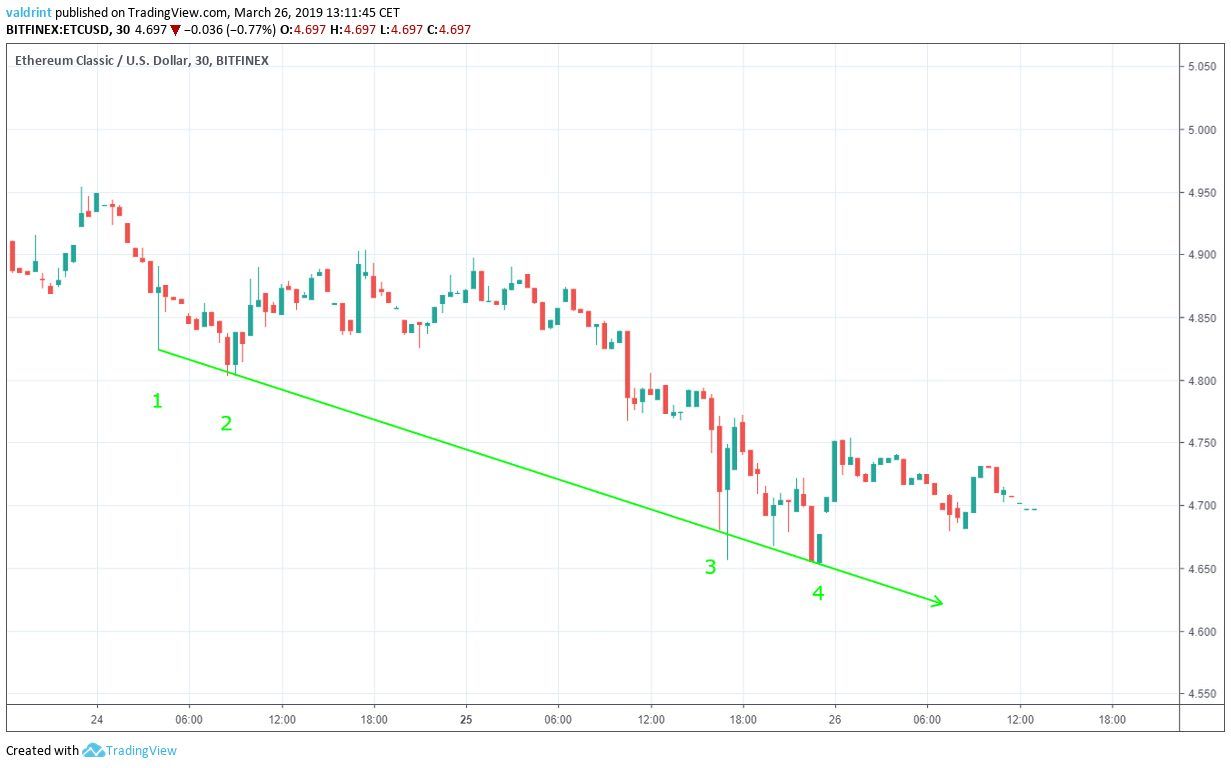
The support line can act as a floor to price, preventing further downward movement. It theoretically traces the lower limits of the price for a given period of time. It also gauges the rate of loss for an asset during a certain period of time.
The price of ETC has decreased at or above the rate predicted by the line since Mar 24’s low.
Descending Wedge
On Mar 25, the price of ETC made a high of $4.87. A sharp drop ensued. Successively lower highs followed.
Tracing these highs gives us a descending resistance line:
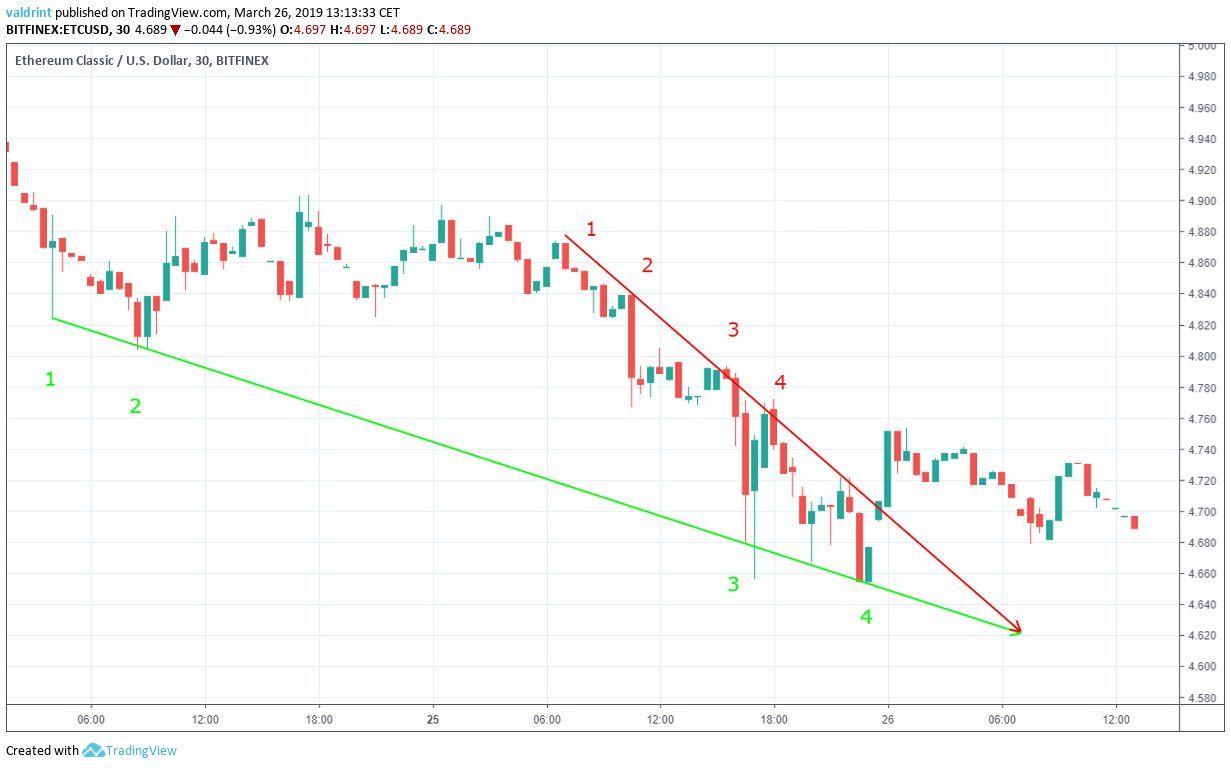
Similar to the support line, the resistance line can act as a ceiling to price, preventing further upward movement.
The resistance and support lines combine to create a descending wedge. This is a bullish pattern—suggesting that price increases may be more likely than decreases.
On Mar 25, price broke out from the wedge. By the time the wedge converged, price was still trading above the resistance. Price, however, has dropped from highs near $4.76 to below $4.70 at the time of writing.
The wedge is no longer an accurate predictor of future prices. New support and resistance lines are emerging. This will trace a new trading pattern.
Long-Term Support
The price of ETC on Binance is analyzed at one-hour intervals from Mar 14 to Mar 26. The longer time frame analysis is used in order to predict the new resistance and support levels.
On Mar 14, the price made a low of under $4.30. By Mar 22, Ethereum Classic had reached highs over $5.50 following rapid and gradual increases.
At the time of writing, ETC was trading between $4.65 and $4.70. Each low along this trend has been higher than the previous.
Tracing these lows gives us an ascending support line.
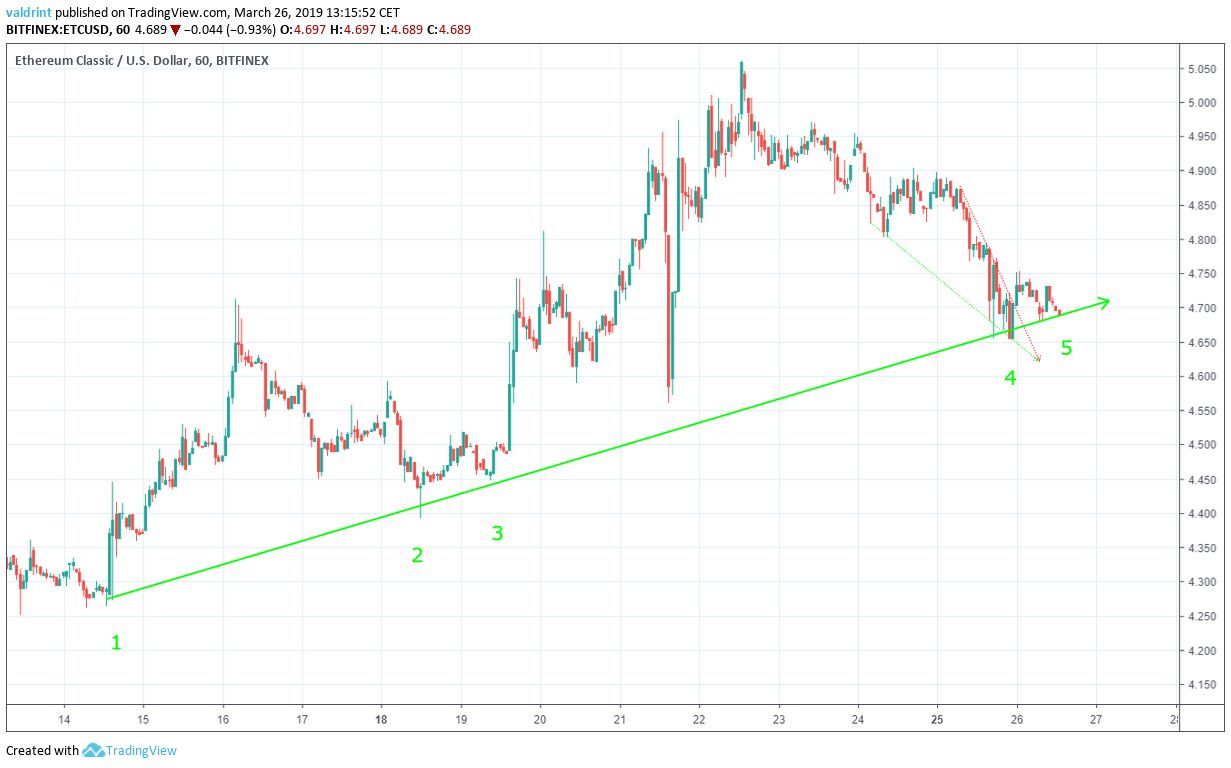
The price of ETC increased at the same rate as predicted by the line until Mar 19—when the increase accelerated. However, ETC returned to the mean on Mar 26—when it touched and validated the support line for the fourth and fifth time.
At the time of writing, Ethereum Classic was trading slightly above the support line.
It is likely that the price will keep increasing at the same rate as predicted by the line. However, this can be better assessed by integrating technical indicators into the analysis.
Bullish Divergence
Combining RSI bullish/bearish divergence with support/resistance essentially predicts price fluctuations.
The relative strength index (RSI) is an indicator which calculates the size of the changes in price in order to determine oversold or overbought conditions in the market.
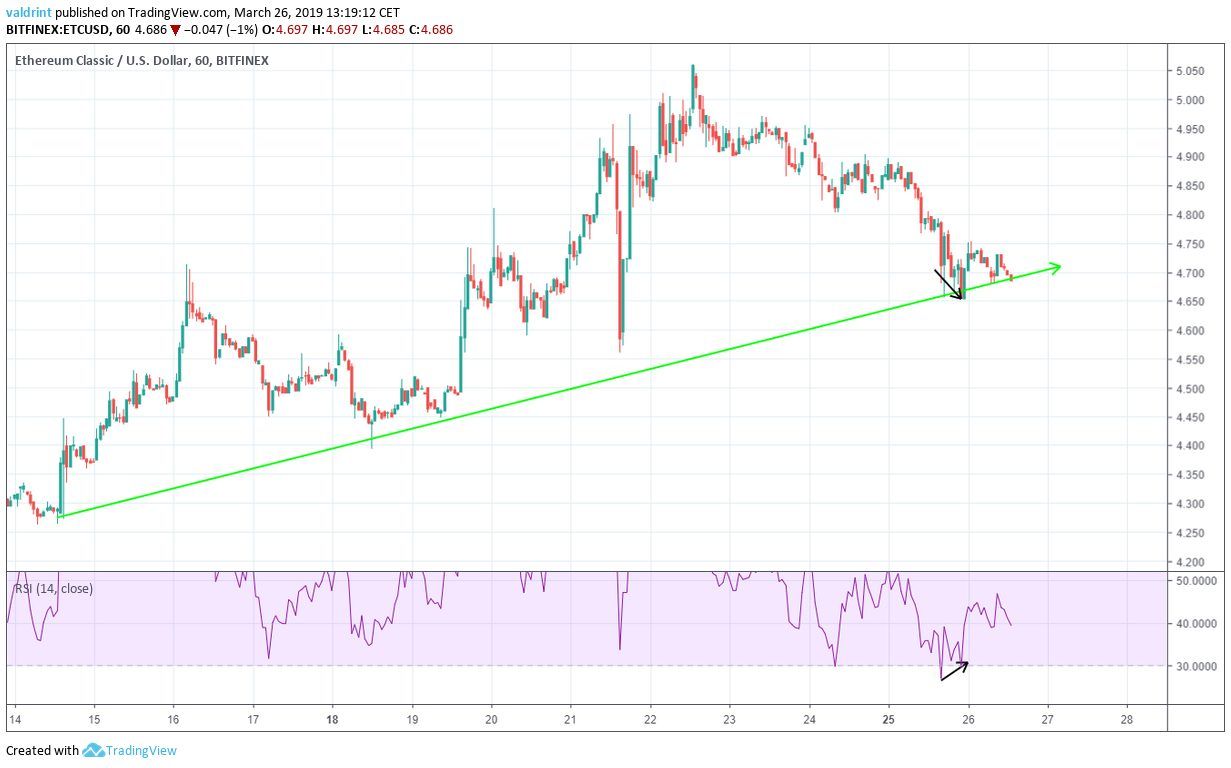
The price of ETC reached a low of $4.68 on Mar 25. Later that day, it reached a lower value of $4.65
Similarly, the RSI made the first low on Mar 25. However, it has generated higher values since.
This is known as bullish divergence and often precedes an increase in price. However, the divergence is not very significant in amount.
Based on this indicator, it is possible that the price of ETC keeps increasing at the same rate as predicted by the support line, but it cannot be ascertained for certain. A breakdown below support could occur in the near future. In such a case, price losses might constitute the continuation of a corrective period from the growth experienced between Mar 14 and 23.
Reversal Areas
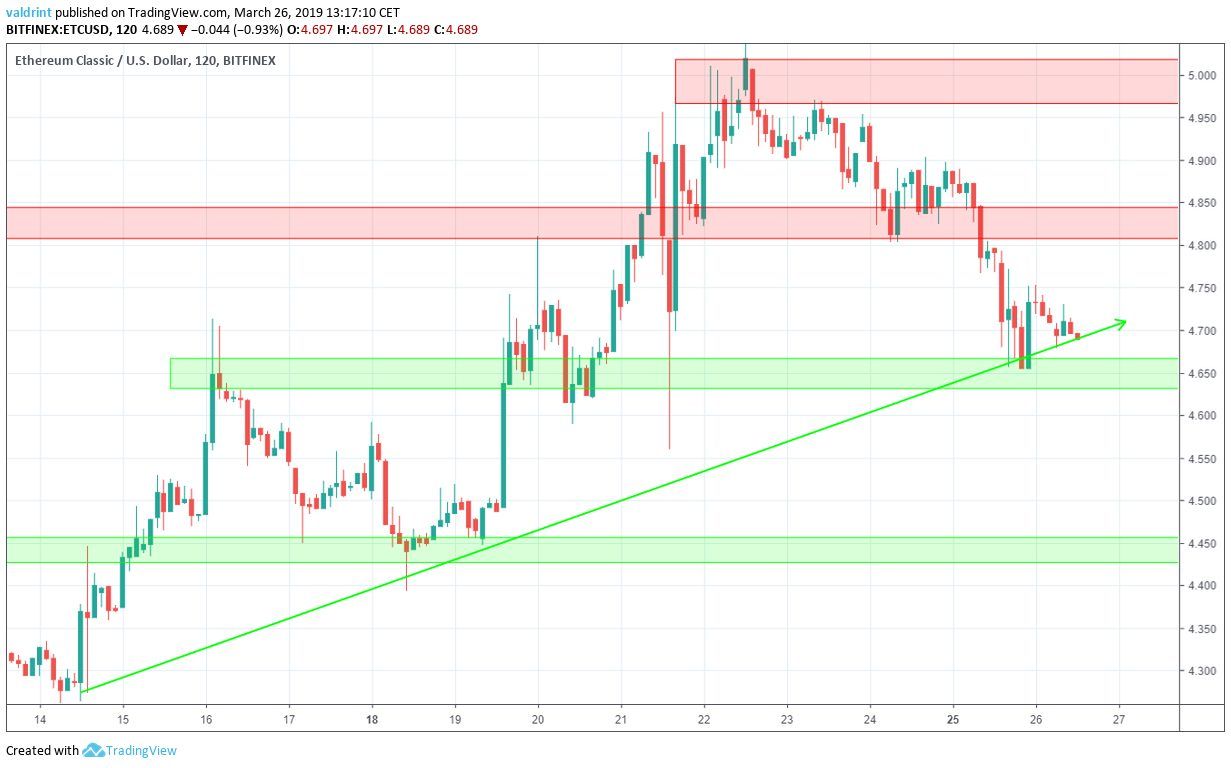
The price of ETC on Binance is analyzed at two-hour intervals from Mar 14 to Mar 26 in order to better visualize future reversal areas.
Resistance and support areas are formed when the price visits the same level several times.
Resistance and support areas are formed when the price visits the same level several times.
The closest area of resistance is found near $4.85, followed by the resistance near $5. Based on our analysis, it is unlikely that the price will reach these areas soon. However, if price continues rising at the rate projected by the support line, both support areas will will inevitably be reached in the longer term.
However, if a breakdown follows as part of correction for earlier gains, price may drop toward the first resistance level of $4.65. It recently touched this support on Mar 25.
The second support area is fond near $4.45. Both remain higher than the bottom around $4.30 experienced on Mar 14. If a breakdown occurs as part of a corrective period, the first and possibly second resistance areas may be reached.
Summary of Analysis
Based on this analysis, it is difficult to assess future price levels.
The price of ETC might increase at the rate suggested by the support.
However, it might break down beneath support as part of a corrective period following the significant gains acheived by Ethereum Class between Mar 14 and 23.
What do you think will happen to the price of ETC? Let us know your thoughts in the comments below.
Disclaimer: This article is not trading advice and should not be construed as such. Always consult a trained financial professional before investing in cryptocurrencies, as the market is particularly volatile.


