
The EOS (EOS) price is trading very close to a support level that has been in place since April.
While a bounce seems more likely, a breakdown from this support area could cause a sharp drop due to the lack of additional support below it.
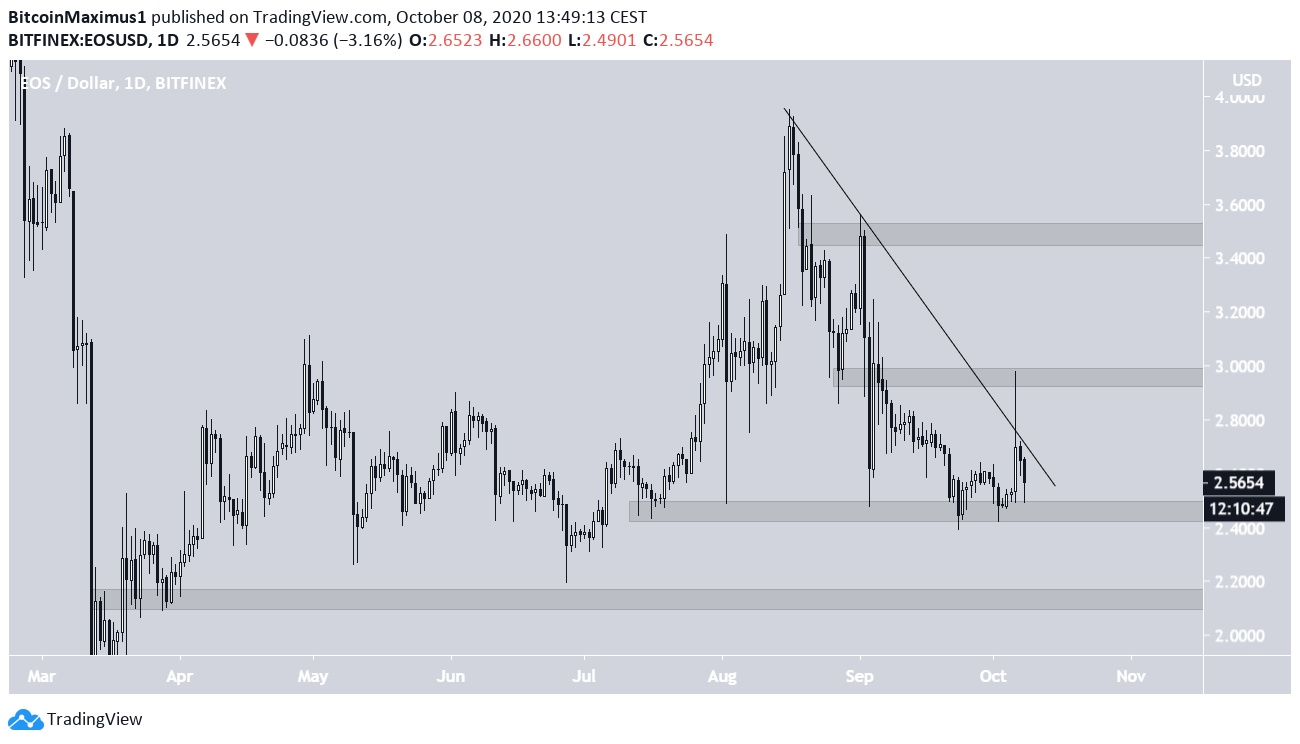
EOS Resistance and Support
The EOS price has been decreasing since it reached a local high of $3.95 on Aug 16. It has been following a descending resistance line through the downward movement. Currently, the price is trading very close to the $2.45 support area, above which it has been trading since April. On Oct 7, the price seemingly initiated a breakout, moving well above the descending resistance line to reach a high of $2.97 — 20% above the opening price for the day. However, the higher prices could not be sustained and the daily candlestick was completed with a long upper wick.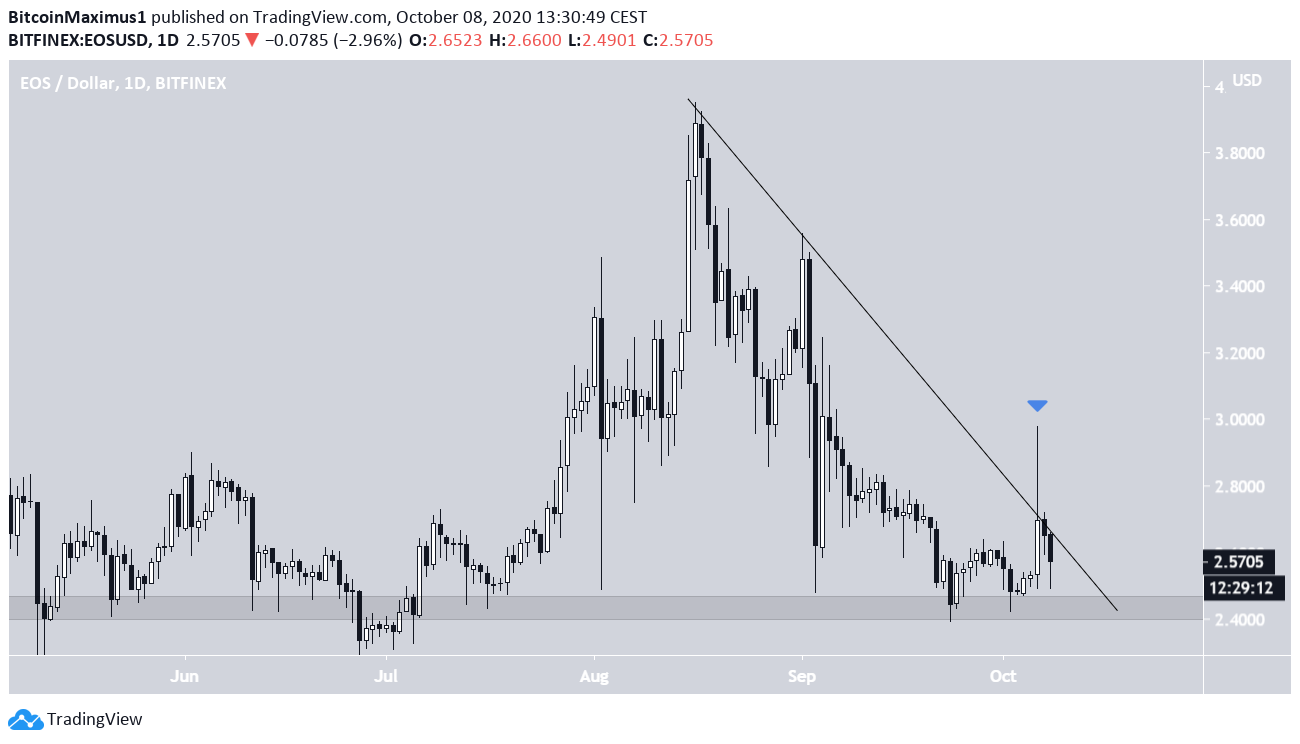
Trading Range
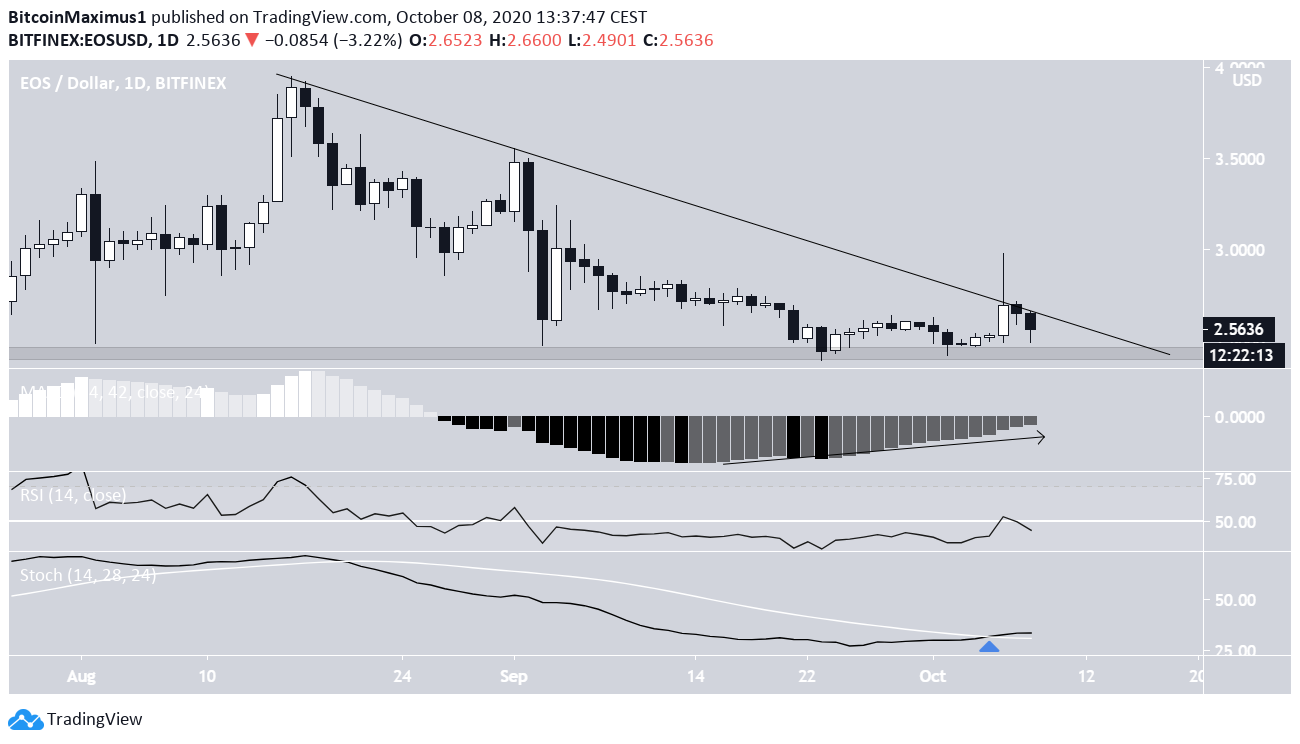
The 6-hour chart shows interesting movements in the range of $2.60-$2.90. The $2.60 area initially acted as support, before a breakdown took the price towards $2.40. The ensuing upward move served to validate the $2.60 area as resistance and create a double bottom near $2.40. During the aforementioned Oct 6 increase, the price reclaimed the $2.60 area and increased to validate the $2.90 area as resistance once more. At the time of press, EOS had returned to the $2.60 area, possibly to validate it as support again. If the price manages to continue trading above $2.60, it would be very likely for another attempt at the $2.90 resistance area to ensue. This could also cause a breakout from the descending resistance line outlined in the previous section.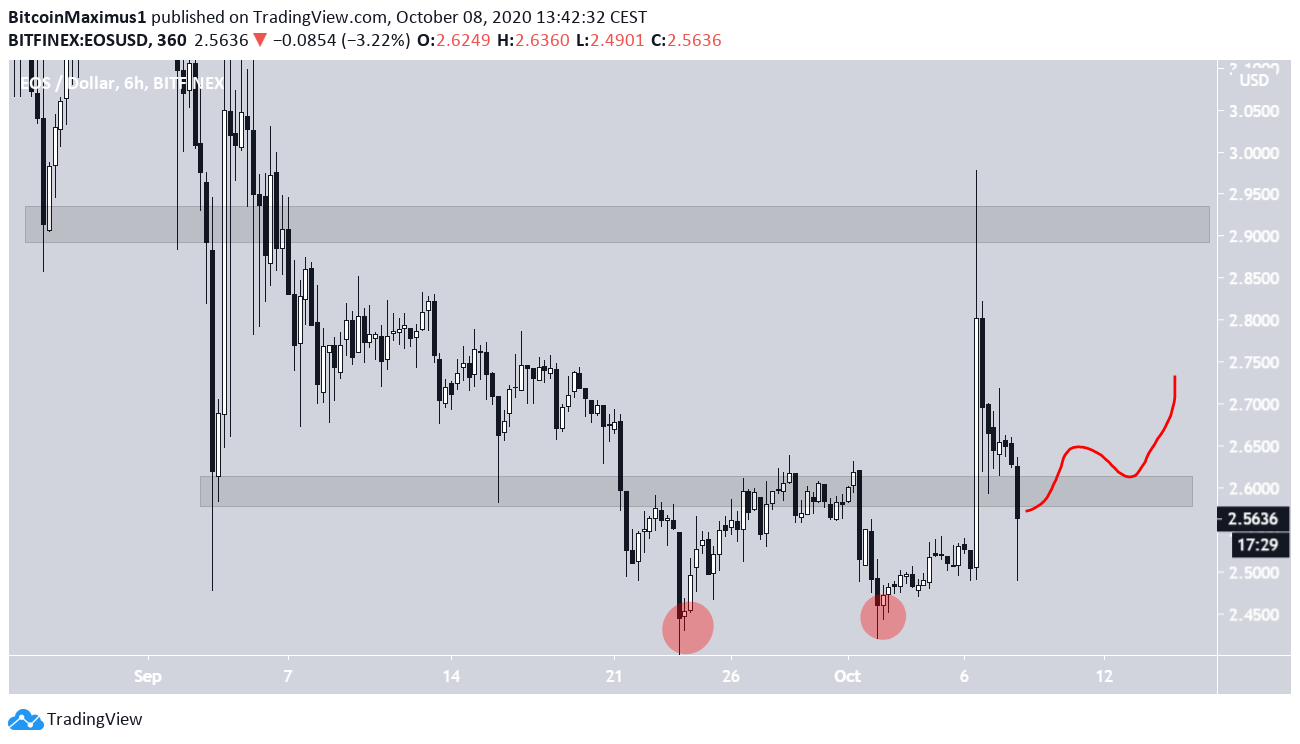
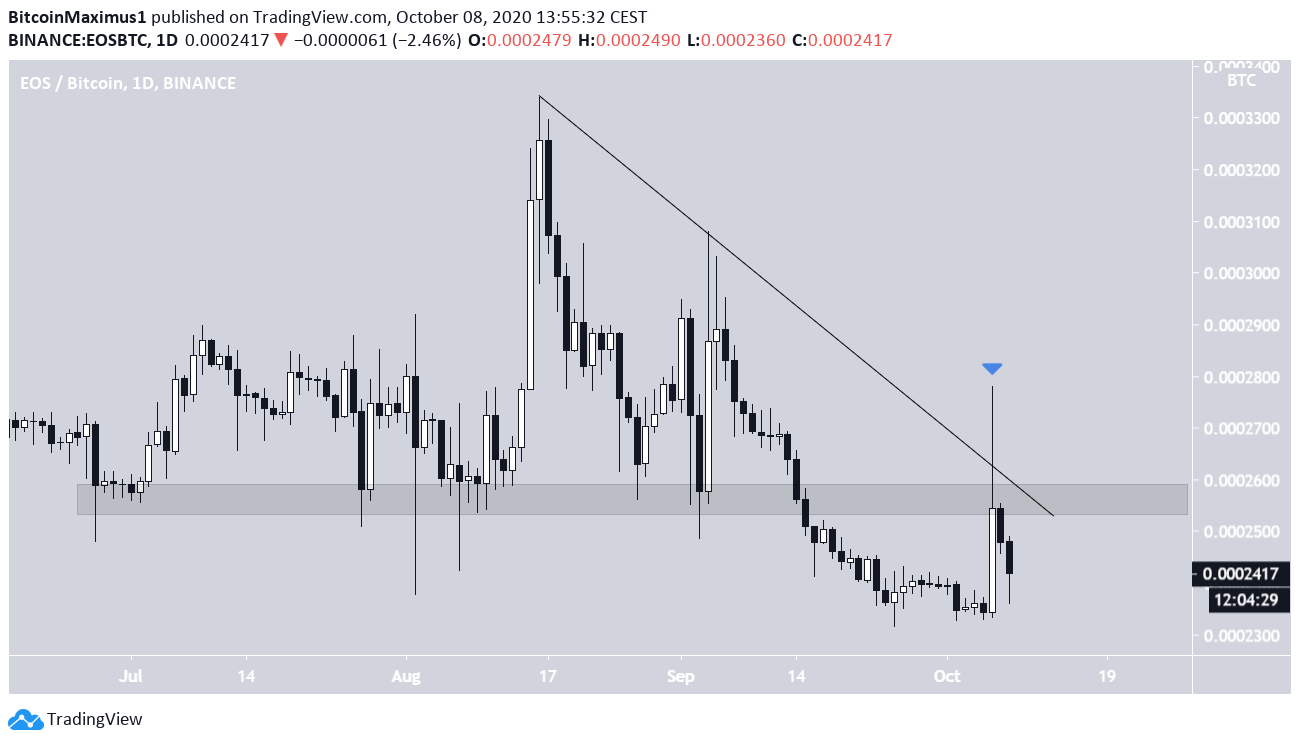
EOS/BTC
Cryptocurrency trader @CryptoDonAlt outlined an EOS/BTC chart which shows a bullish engulfing candlestick, in what he believes is possibly the beginning of a new upward trend.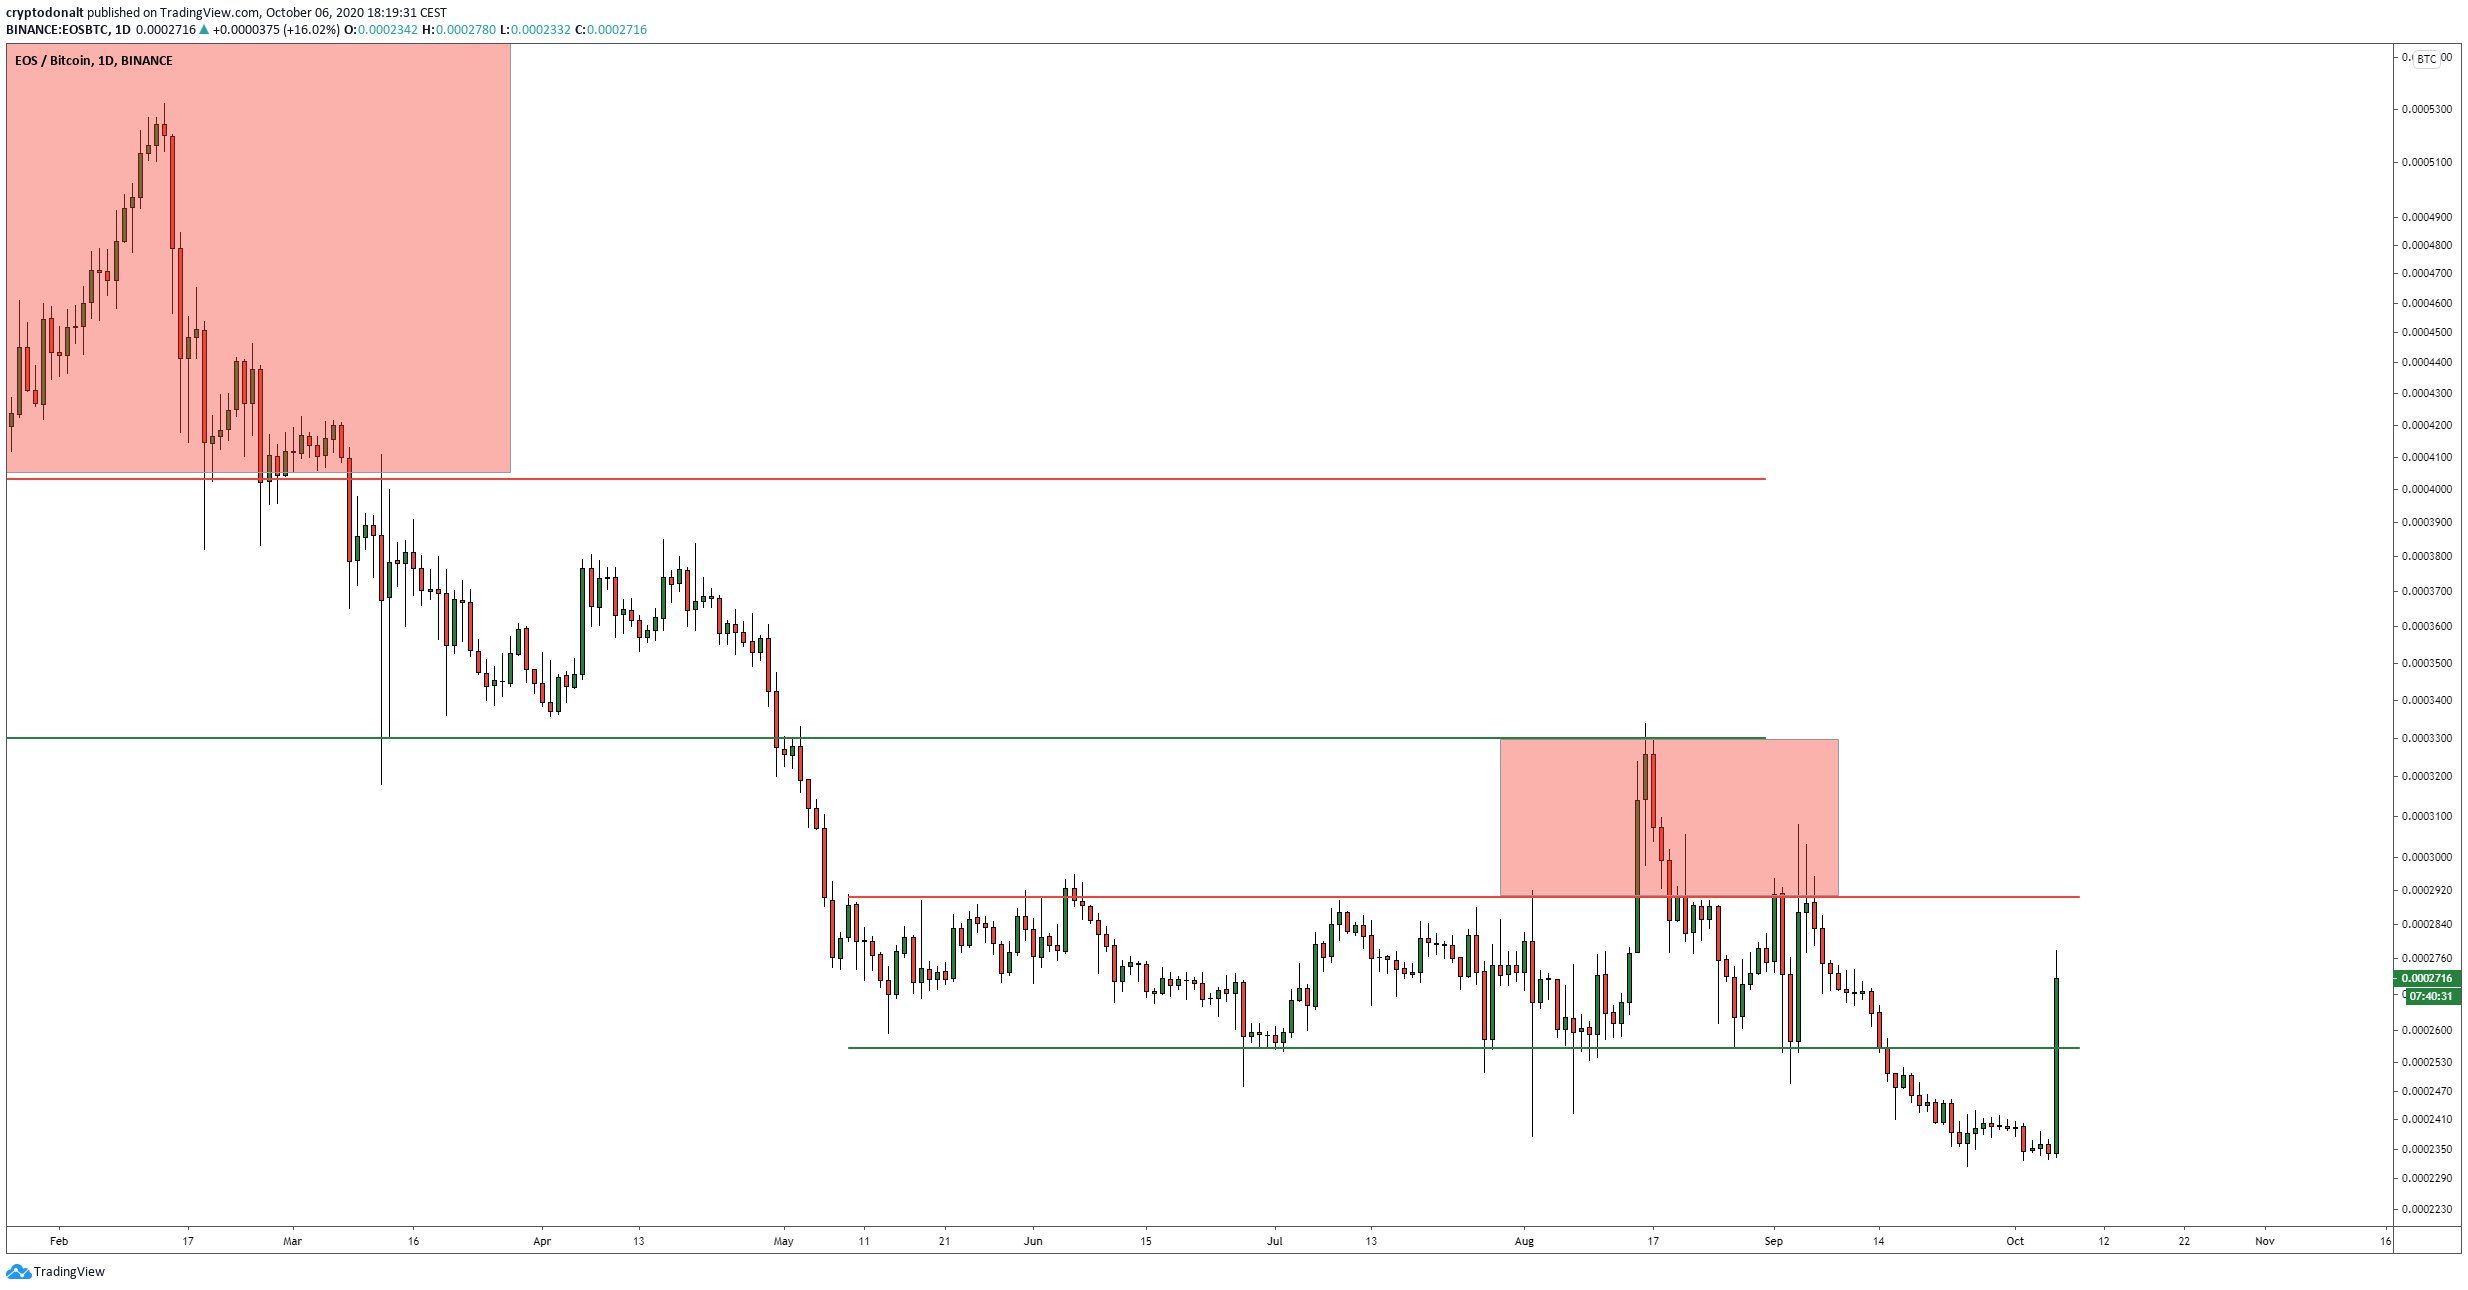
Top crypto platforms in the US
Disclaimer
In line with the Trust Project guidelines, this price analysis article is for informational purposes only and should not be considered financial or investment advice. BeInCrypto is committed to accurate, unbiased reporting, but market conditions are subject to change without notice. Always conduct your own research and consult with a professional before making any financial decisions. Please note that our Terms and Conditions, Privacy Policy, and Disclaimers have been updated.

Valdrin Tahiri
Valdrin discovered cryptocurrencies while he was getting his MSc in Financial Markets from the Barcelona School of Economics. Shortly after graduating, he began writing for several different cryptocurrency related websites as a freelancer before eventually taking on the role of BeInCrypto's Senior Analyst.
(I do not have a discord and will not contact you first there. Beware of scammers)
READ FULL BIO
Sponsored
Sponsored