


On Mar 7, 2019, the price of EOS (EOS)reached a high of nearly $4. It has been on a gradual downtrend since. The price has not experienced significant volatility in the last two weeks.
Here is a look at the prices from the period of Mar 16 to Mar 19:
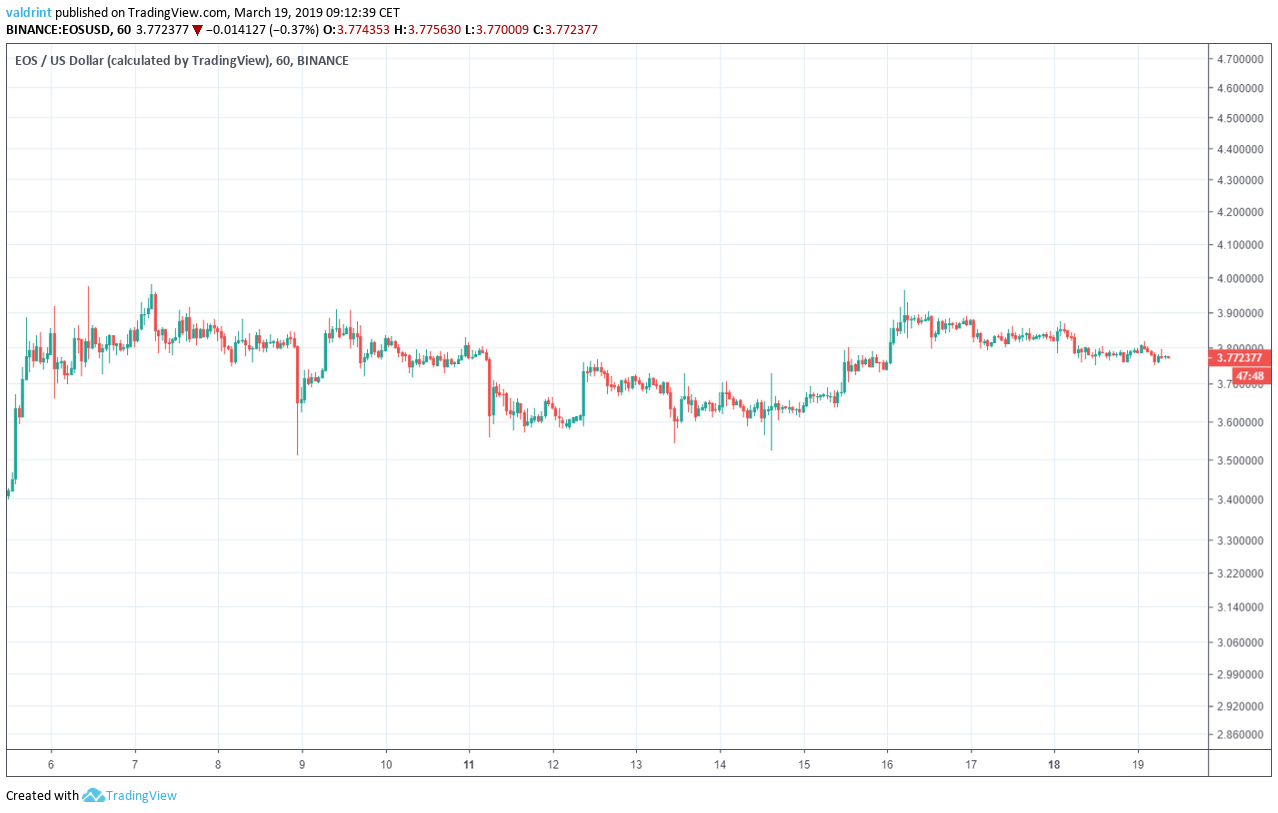
In our Mar 6 analysis of EOS we predicted that price would drop to or below the support area near $3.60. Our prediction was validated on Mar 9, when the price made a bottom of $3.50.
Based on today’s analysis, it is likely that price increases are in store for the future.
Key Highlights For Mar 19
- The price of EOS reached a high of $3.9 on Mar 16.
- A gradual downtrend has since ensued.
- The price has been moving in a horizontal channel.
- There is resistance near $4.05 and $4.40.
- There is support near $3.60 and $3.35.
Tracing The Support
The price of EOS on Binance was analyzed at one-hour intervals from Mar 6 to Mar 19.
The price made a high of $3.97 on Mar 6. It revisited the same level on Mar 7. A gradual downtrend ensued. Price reached the $3.97 level again on Mar 16.
Tracing these highs gives us a horizontal resistance line.
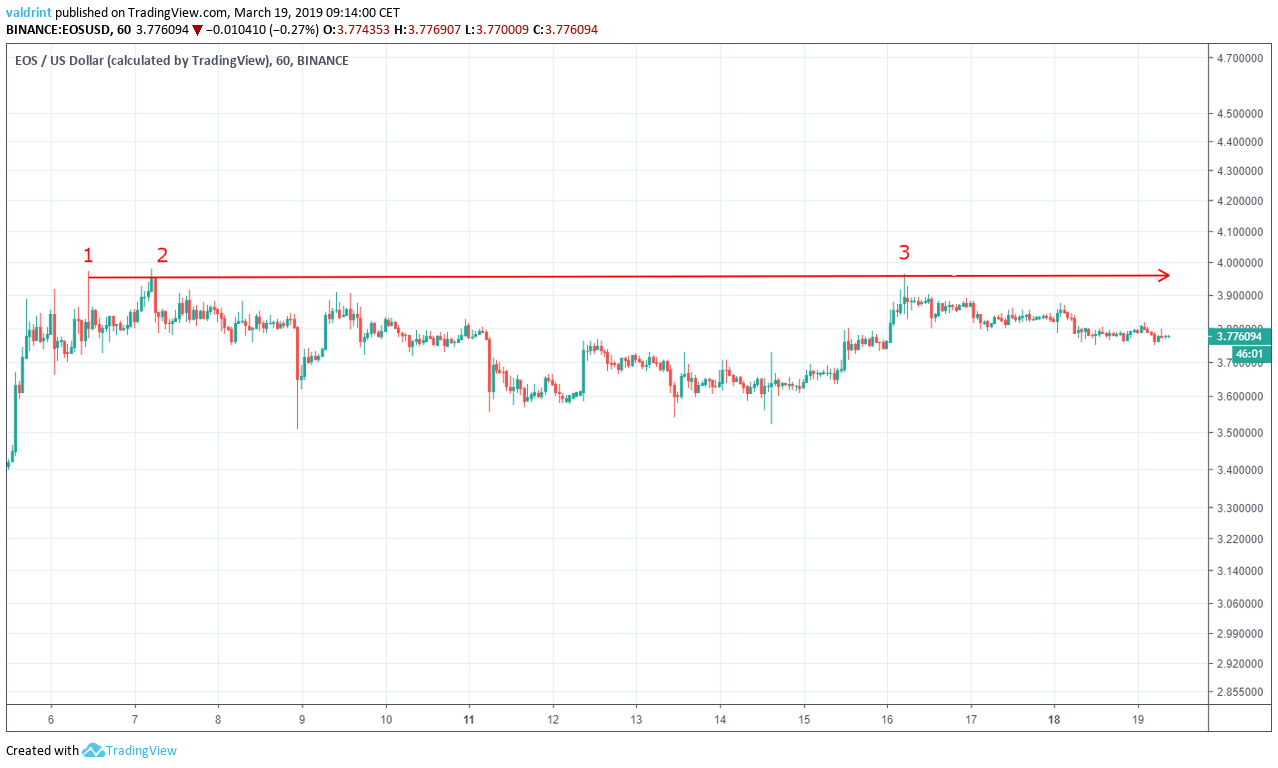
The resistance line can act as a ceiling to price, preventing further upward movement. It theoretically traces the upper limits of the price.
It is unlikely that the price moves above this line unless a breakout occurs. The resistance line alone is not sufficient in determining if a breakout will occur.
Horizontal Channel
The price made a $3.50 low on Mar 8. Since then, it has revisited the same level several more times.
Tracing these lows gives us a horizontal support line.
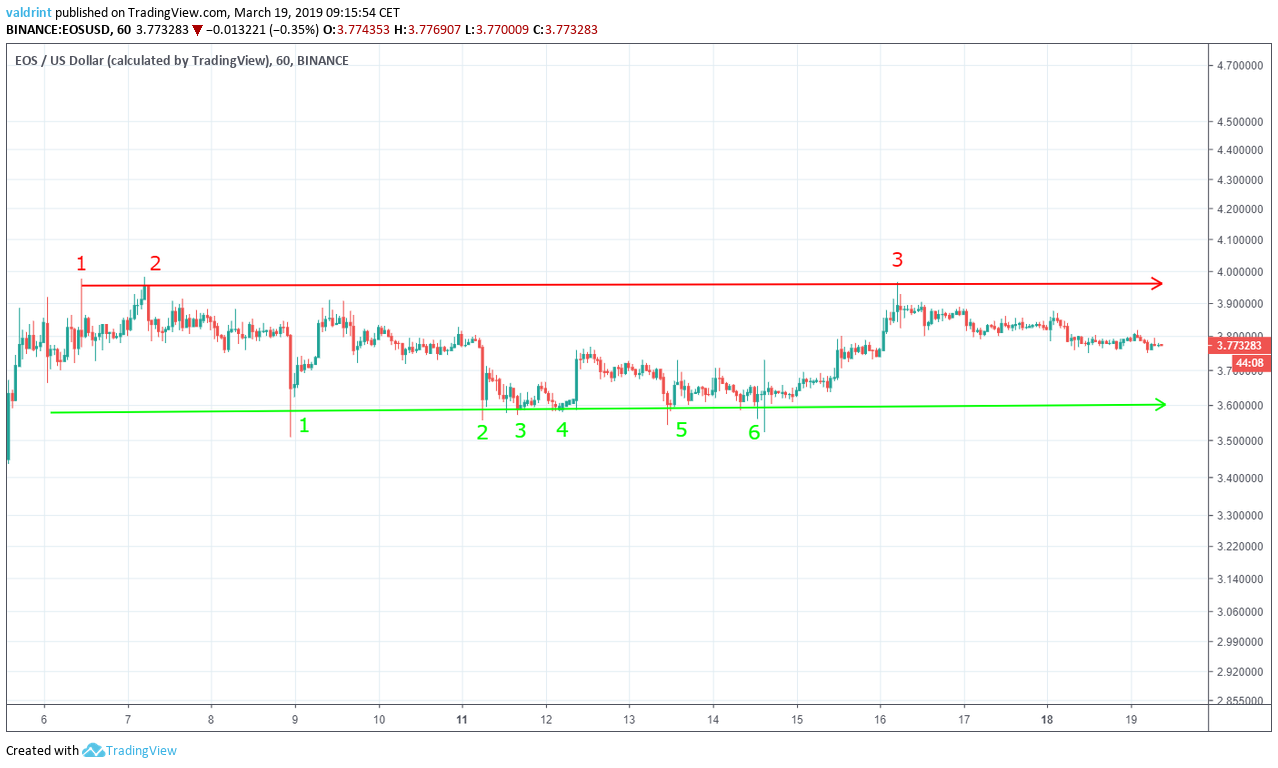
Similar to the resistance line, the support line can act as a floor to price, preventing further downward movement.
Wick breakdowns such as the ones on Mar 9 and Mar 14 can be considered insignificant since they are not supported by continuous losses.
The support and resistance lines combine to create a horizontal channel, which is a neutral pattern, making price increases and decreases equally likely. It The channel is a better predictor of price fluctuations than resistance or support alone.
Based on this pattern, it is likely that the price keeps moving within the confines of the channel until a breakout or breakdown occurs. The channel alone is not sufficient in determining when the move will occur.
In order to determine that, a more detailed look into a shorter time-frame is required.
Possible support and resistance
Combining MACD and RSI bullish/bearish divergence with support/resistance essentially predicts price fluctuations.
The relative strength index (RSI) is an indicator which calculates the size of the changes in price in order to determine oversold or overbought conditions in the market.
EOS made a high of $3.97 on Mar 16. Several market cycles have been completed since, with each high being lower than the previous one. Tracing these highs gives us a descending resistance line.
On Mar 16, EOS also made a low a low of $3.79. Lower lows followed. Tracing these lows gives us a descending support line.
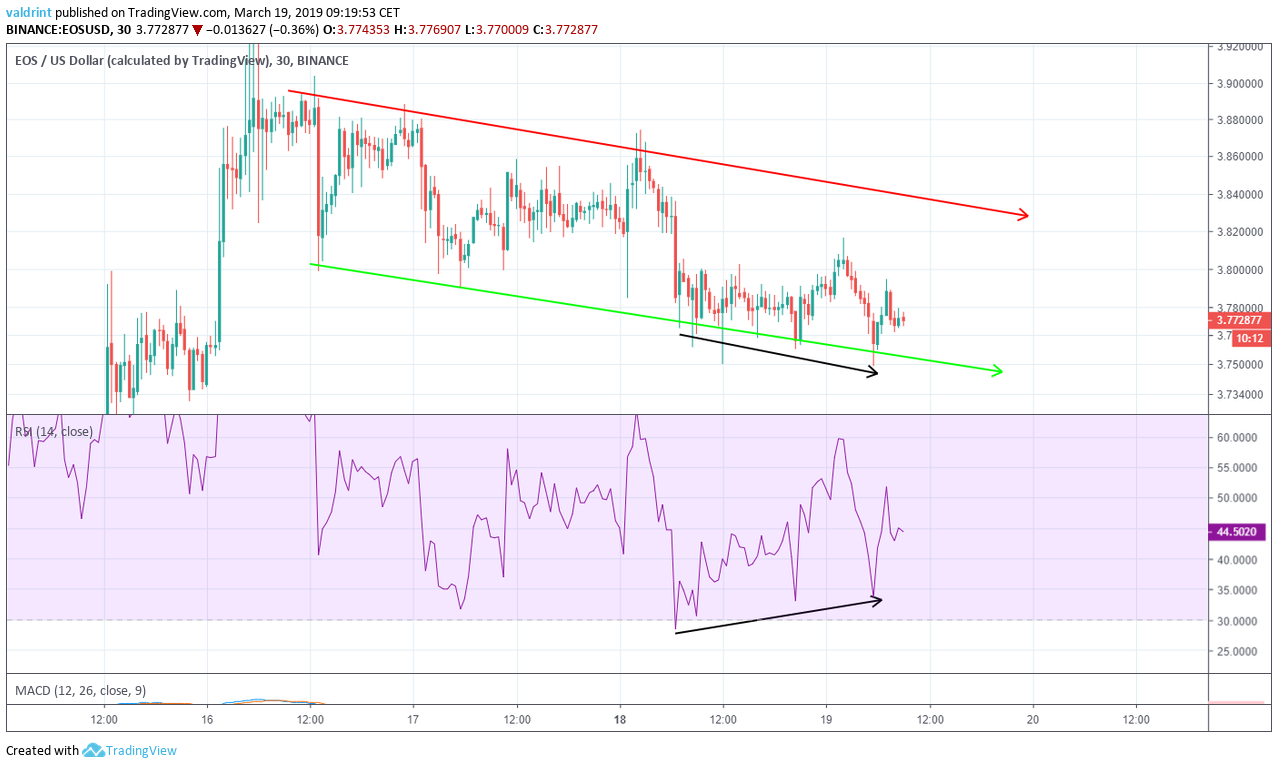
The resistance and support lines combine to create a descending channel, which is a neutral pattern, making price increases and decreases equally likely.
On Mar 18, the price made a low of $3.78. It continued to make lower lows throughout the day.
Similarly, the RSI made the first low on Mar 18. However, it continued to make higher lows.
This is known as bullish divergence and often precedes price increases.
Using this indicator and the previous market movements it is likely that a price increase is in store and the price moves upward to touch the resistance line.
Future Movement
Support and resistance areas are created when the price reaches a certain level numerous times. They can act as a floor and ceiling for the price, respectively.
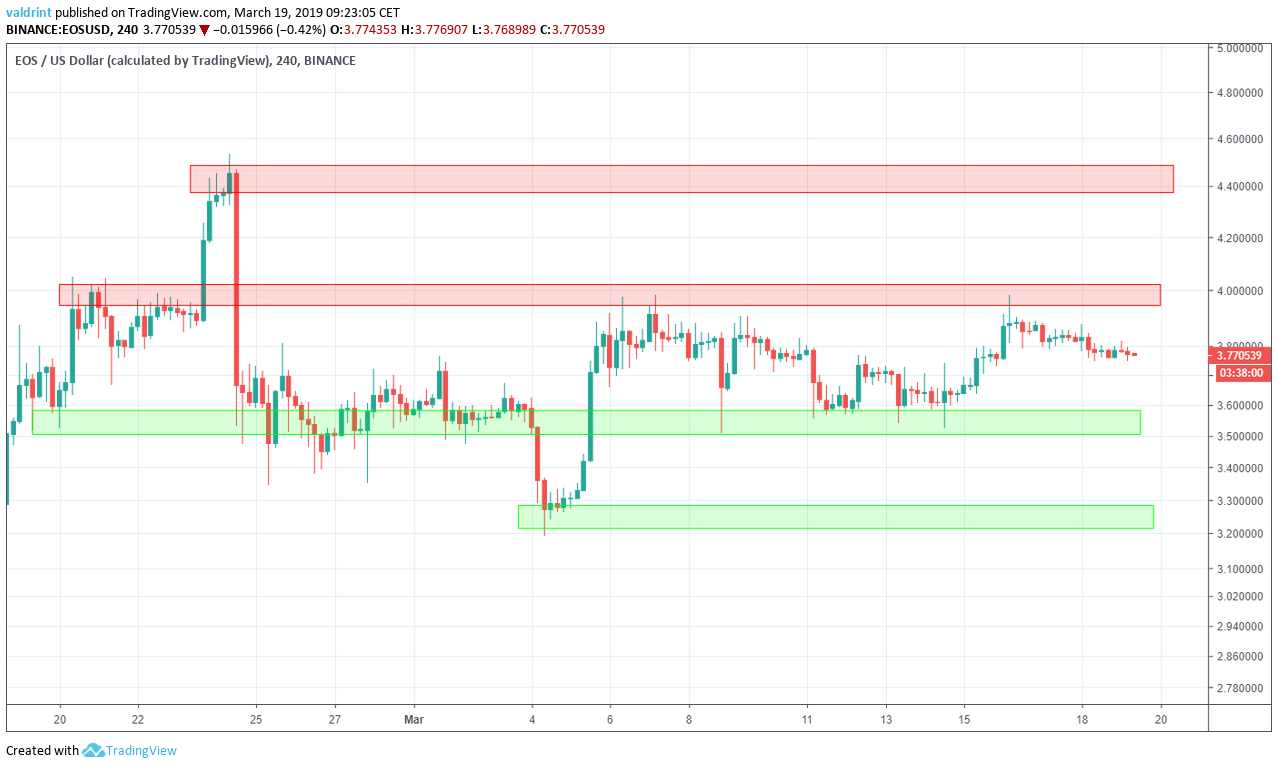
There are resistance areas near $4.03 and $4.40. If the price were to break out of the channel, these two would provide likely reversal areas. Based on our analysis, it is likely that the price reaches at least one of these areas.
There are support areas near $3.60 and $3.35. Based on our analysis, it is unlikely that the price will reach these areas in the near future.
Summary of Analysis
Based on our analysis, it is likely that the price of EOS breaks out from the descending channel. If it moves upward to touch the resistance line, this prediction will be partially validated. If it breaks out from the line, it will be fully validated. However, a breakdown below the support line would invalidate our prediction.
Do you think the price of EOS will break out or will drop to the support areas outlined? Let us know your thoughts in the comments below!
Disclaimer: This article is not trading advice and should not be construed as such. Always consult a trained financial professional before investing in cryptocurrencies, as the market is particularly volatile.


